MTF MultiMeter

Benefits:

  • A new and innovative way of looking across multiple timeframes and multiple indicators on any chart.
  • Provides instant multi-timeframe analysis of any market. i.e. forex currency pairs, cryptocurrency pairs, commodities, etc.
  • It offers precise indications across multiple timeframes of volatility as measured by RSI, ADX and STOCH within one chart.
  • Helps you determine high probability trading setups. See example strategy in comments.
  • Can see bullish/bearish volatility building across multiple timeframes and multiple indicators i.e. trading H1 chart can see RSI and STOCH gaining support across M1, M5, M15, M30.
  • Recognize trends as they develop without any need to look at multiple charts using different timeframes for the same trading pair and act accordingly.
  • Identify sudden market fluctuations as they happen due to various major events on your trading pairs.
  • Indicators are being created dynamically and react in real-time to the price action of the market.
  • Can configure indicator to suit your trading style.
  • A must-have trading tool by every trader, whether scalper, swing trader, long-term investor, etc.
  • Features:

  • Provides the ability to compare an indicator across multiple timeframes at a glance.
  • Multi-Instance (requires you give it a Unique Id#).
  • Multiple indicators are supported, currently RSI, ADX and Stochastics.
  • Can have multiple instances of the same indicator i.e. RSI(14) and RSI(2).
  • Can have multiple instances of different indicators i.e. RSI(14), ADX(14), STOCH(5,3,3).
  • Indicators are configurable via settings dialog for Period length, Smoothing, etc.
  • Provides support for highlighting Over sold / Over bought ranges.
  • Supports all common chart timeframes in one indicator i.e. M1, M5, M15, M30, H1, H4, D1, W1, MN.
  • Current Period is highlighted so you know to look left of that to see momentum building.
  • All Colors can be modified to suit your own preference via the Colors Tab.
  • Options exist to turn on or off the display of headings, timeframes, ranges and values. Note: Current Period highlighting won't show if timeframes are turned off.
  • Q&A

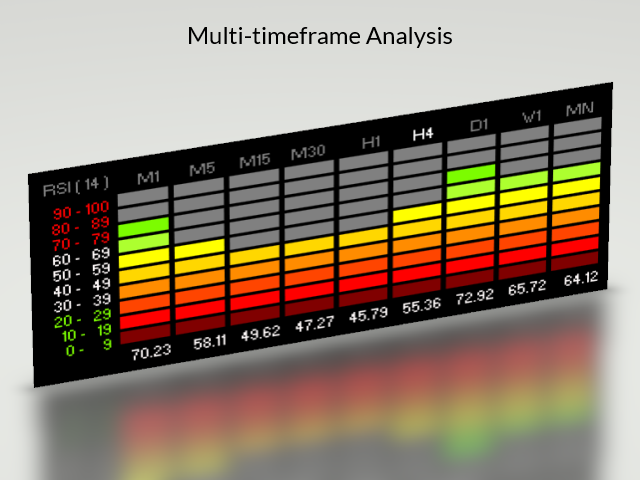
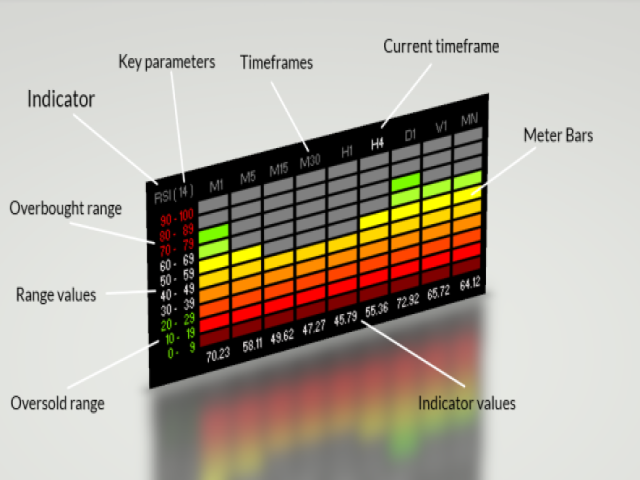
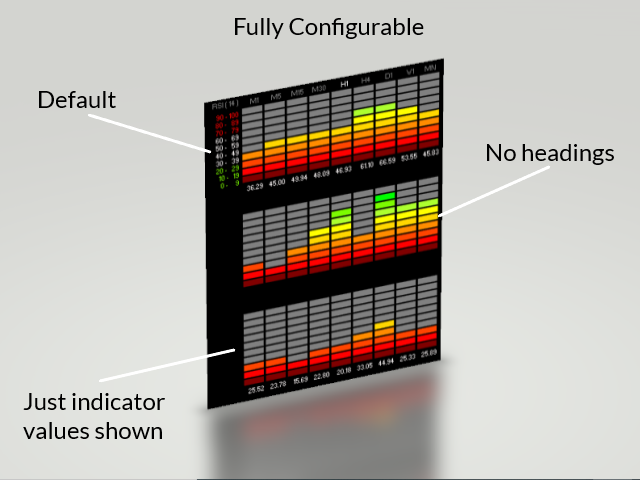
    What do you see on the chart?

    The first line:

  • Shows the indicator being used i.e. RSI, ADX and Stochastics are supported right now.
  • It also shows any key paramters for the indicator i.e. Period Length, Smoothing, etc.
  • It also shows the timeframes being used. The current chart period will be highlighted by default.
  • The second line through to the tenth line:

  • Shows the indicator range being used to compare the current value of the indcator with i.e. 50-59, 60-69, etc.
  • It then shows the level bars for each timeframe for the indicator in question i.e. based on the RSI values
  • Grey level bars mean the value didnt reach that level.
  • Colored level bars are shown going from dark red (low value) through to light green (high value).
  • The level bars will rise and fall depending upon the current value of the indicator.
  • It acts just like the graphic equaliser on your stereo does depending on the loudness of the music only we are using the indicator values instead.
  • The last line:

  • Shows the actual values of the indicator being used for each timeframe.
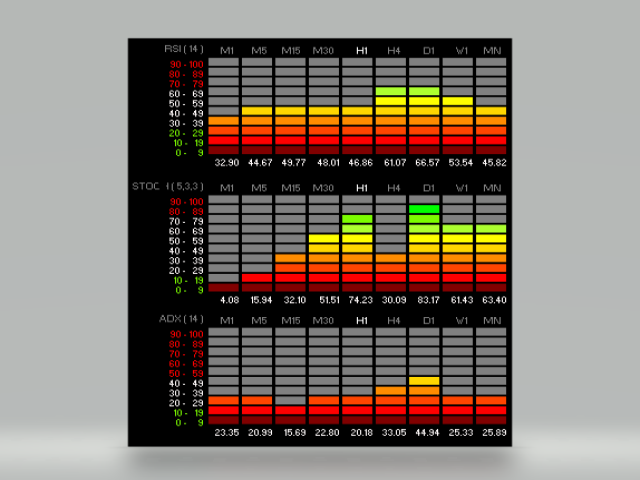
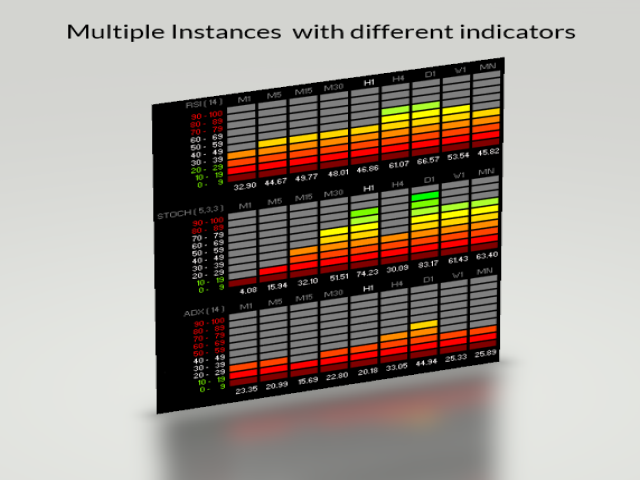
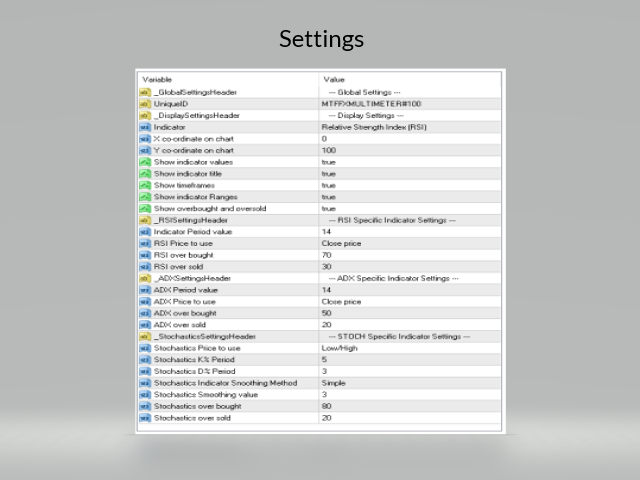
  • What indicators are currently supported?

    Indicators currently implemented are:

  • Average Directional Index (ADX)
  • Relative Strength Index (RSI)
  • Stochastic Oscillator (STOCH)
  • Do I use this indicator myself?

    Of course I do, the screenshots provided are from actual trades. I eat my own dog food as the saying goes.

    I believe the ultimate test for a developer of indicators is whether they use the indicators to trade with live themselves.

    I use this indicator daily for my own Forex/Cryptocurrency/Commodities trading.

    It is useful for my trading so I thought others may find it useful also.

    Future updates planned:

  • MT5 version
  • Alerts off overbought and oversold signals on multiple instances for current chart period.
  • Compact mode showing just the M5, M15, M30, H1, H4, D1 bars without any titles or headings.
  • Support for more indicators. i.e. STOCHRSI, etc.
  • Other changes will be based on user feedback.

  • I hope you find the MTF FX MultiMeter indicator of use to you.

    If you have any questions just leave a comment and I will answer as soon as I am next online.

    I wish you all happy trading with the MTF FX MultiMeter indicator.

    Cheers,

    Grant Cause

    Produtos recomendados
    Indicador de Tendência (Trend Candle) — Leitura Instantânea de Tendências O indicador de Tendência (Trend Candle) colore automaticamente as velas do seu gráfico, transformando análises complexas em uma imagem visualmente compreensível. Determine instantaneamente a força e a direção do mercado: verde para uma tendência de alta, vermelho para uma tendência de baixa e cinza para uma fase neutra. A ferramenta é baseada na sincronização de dois filtros adaptativos, fornecendo sinais claros sem ruíd
    Line Alerter Free
    Tomoyuki Nakazima
    5 (1)
    This indicator alerts you when indicator-created lines are "touched" by price, You can change the interval between alerts. You can change colors and styles of lines as you want. However, lines must be named "Upper" and "Lower. There is a  more powerful PRO version . Input Parameters WaitTime: Interval between alarm. How To Use Place lines wherever you want to add alarms.
    FREE
    Este indicador de vários símbolos e períodos de tempo verifica os seguintes padrões de velas (por favor, veja a captura de tela para uma explicação dos padrões): Três soldados brancos (reversão> padrão de continuação) Três corvos negros (reversão> padrão de continuação) Greve de três linhas de alta e baixa (padrão de reversão) Os padrões não aparecem com muita frequência em períodos de tempo mais altos quando a opção restrita nas configurações do indicador está habilitada. Mas quando o fazem, é
    This indicator provides useful information for quantitative analysis. It compares the 28 pairs' pips of the current day with the average of pips made in the previous three days. When in the last three days the pips value is low and the value of today's pips is below, we are in the presence of a volatility compression that will explode soon. The "Range Today" is red if today's figure is less than the range of the previous three days, but turns green when the percentage exceeds 100%. When the rang
    Goldstrike
    Nitu Brijesh Yadav
    GoldStrike Momentum Trend Indicator - The Ultimate Forex Trading Tool Description: Introducing the GoldStrike Momentum Trend Indicator , a powerful and intuitive tool designed for traders seeking precision in their Forex strategies. Using a combination of momentum analysis and the RSI (Relative Strength Index) , this indicator provides buy and sell signals that help you identify optimal entry and exit points, improving your trading decisions. Perfect For: Day traders who need quick, precise sign
    Detailed blog post with extras downloads: https://www.mql5.com/en/blogs/post/759154 About: Price ranges most of the time in forex… Like 70-80% of the time. And then it breaks out of the range to continue in a trend. Even in a trend, price makes smaller ranges all the time. Range Breaker Scalper is a tool to find the times when price breaks out of a range. A sudden break means that price will continue on for next few bars towards the breakout. So, these areas are best for scalping. Especially if
    KT Absolute Strength MT4
    KEENBASE SOFTWARE SOLUTIONS
    KT Absolute Strength measures and plots the absolute strength of the instrument's price action in a histogram form. It combines the moving average and histogram for a meaningful illustration. It supports two modes for the histogram calculation, i.e., it can be calculated using RSI and Stochastic both. However, for more dynamic analysis, RSI mode is always preferred. Buy Entry When the Absolute Strength histogram turns green and also it's higher than the previous red column. Sell Entry When th
    Spv
    Yvan Musatov
    The SPV indicator clearly reflects the cyclical nature of the market. Just one key setting! If it is equal to one, then a fast cycle is displayed, but if, for example, the parameter is 12, then the indicator looks for a cycle in the last 12 bars. You can see the ups and downs of the indicator alternate and have such dependence on the market, which can be used to draw conclusions to predict price behavior. Also, indicators can be combined with each other. Also, the indicator can indicate the qual
    TrendCore Adaptive FX — Smart Expert Advisor for Confident and Adaptive Forex Trading TrendCore Adaptive FX   is a powerful, fully automated trading robot designed for consistent performance in the Forex market. It combines trend-based technical analysis, adaptive lot management, and solid capital protection strategies to ensure robust and efficient trading under real market conditions. Whether you're a professional trader or a long-term investor, this EA offers an intelligent solution to a
    Whale Alert
    Tran Thanh Tuyen
    Whale Alert EA   is a trading system based on medium-term impulse price fluctuations. Each trade is opened when there is a corresponding trend. Whale Alert conducts in-depth technical analysis of your chosen currency pair. The Expert Advisor does not use aggressive and dangerous trading methods and therefore is as stable as possible when using certain settings. For safe and the most stable trading, you should always use SL. With its unique filtering algorithm for false market entry signals, Wha
    The indicator colors bars displaying prices of overbought and oversold areas on the chart. It will help you to estimate moments when market climate changes and the price has its local extreme values. It can be used both independently and as a good supplement to any channel trading system. And this indicator is easy-to-use in expert advisors due to usage of indicator buffers instead of graphical objects. Settings ExtPeriod = 100 — indicator period; Sensitivity = 80 — indicator sensitivity.
    Description of work The MA7 Aster indicator is based on the standard Moving Average indicator. Shows the price deviation from the moving average. Detailed information about the MA7 Aster indicator. Indicator settings General settings: Period ; Method ; Apply to ; Minimum distance – minimum distance from the moving average to the closing price of the candle. Message settings: Send message to the terminal (Alert) – permission to send messages to the terminal using the Alert function; Send messag
    Power Bank
    Sergey Kasirenko
    5 (2)
    O Power Bank EA é um sistema de acompanhamento de tendências baseado no indicador de canal CCI que ajuda os operadores a identificar a direção da tendência, as zonas de sobrecompra/sobreventa e as possíveis zonas de rutura através de bandas de canal. O EA pode detetar com precisão o início de tendências alcistas e bajistas e controlar as operações abertas através de um método martingala/quadrícula até atingir o ponto de repouso. Pares recomendados: Todos os pares principais como o EURUSD, o AUD
    Description of work The MA7 Galega indicator is based on the standard Moving Average indicator. Shows a puncture of the moving average. Detailed information about the MA7 Galega indicator. Indicator settings General settings: Period ; Method ; Apply to ; Consider the direction of the candle . Message settings: Send message to the terminal (Alert) – permission to send messages to the terminal using the Alert function; Send message to the mobile terminal (Push) – permission to send messages to t
    HMA grid EA
    Dorian Baranes
    3.67 (12)
    HMA Grid EA is a grid system which analyzes trend based on the Hull Moving Average (HMA) indicator. Unlike the Simple Moving Average (SMA) the curve of HMA attempts to give an accurate signal by minimizing lags and improving the smoothness. This EA proposes two trading strategies which combine a slow period HMA to identify the main trend and a short period HMA to identify short trend reversal movement. This combination make usually sell and buy signals accurate and in case if the trend reverse w
    FREE
    Market Pulse AM
    Andrii Matviievskyi
    5 (1)
    The presented indicator analyzes the direction of the short-term and long-term trend for specified periods, taking into account the volatility of the market. This approach allows combining high sensitivity of the indicator with a high probability of execution of its signals. The principle of use is extremely simple: the indicator histogram is greater than 0 - a buy signal / the indicator histogram is less than 0 - a sell signal. The indicator allows you to configure two types of parameters: fast
    BBandsEx
    Andrej Nikitin
    Advanced Bollinger Bands (BB) indicator. The standard Bands.mq4 indicator was complemented with a range of upper/lower band and signal of possible reverses. Parameters: BandsPeriod - indicator period. BandsRange - period of determining a range. BandsDeviations - number of standard deviations. Averaging Fast Period - fast period of averaging. Averaging Slow Period - slow period of averaging. Buffer indexes: 0 - Middle line, 1 - Upper line, 2 - Lower line, 3 - Upper range, 4 - Lower range, 5 -
    Market Meeter
    Hapu Arachchilage Tharindu Lakmal
    Hello, traders! Welcome to the introduction of   Market Meeter  ( MT4 ) This is the   Meta Trader 4   version of the "Multi Timeframe Analyzer". Click here   to   Get MT5 version   <<---  What is this indicator? Simply put, this indicator analyzes the market across   eight different timeframes , from lower to higher, and predicts the next price direction along with an estimated continuation time. It does this by using   volume, volatility, and price patterns   in its calculations. Let's dive
    This powerful indicator intercepts 21 patterns simultaneously on 28 Pairs and on all timeframes. Just put the indicator on a single chart to see all patterns that appear on all pairs in all timeframes The patterns found are: For Bearish: Bearish Abandoned Baby; Bearish Engulfing; Bearish Harami; Bear Kicker; Dark Cloud Cover; Evening Doji Star; Evening Star; Shooting Star; Three Black Crows; Three Inside Down; Three Outside Down; For Bullish: Bullish Abandoned Baby; Bullish Engulfing; Bullish Ha
    AI Nodiurnal EA
    Ugochukwu Mobi
    O AI Nodiurnal EA é um avançado robô de Forex que utiliza tecnologia de ponta de aprendizado de máquina para otimizar estratégias de negociação e aprimorar o desempenho no dinâmico mercado de câmbio. O termo "Nodiurnal" reflete sua capacidade de se adaptar e operar não apenas durante as típicas horas diurnas de negociação, mas também durante períodos não convencionais, proporcionando uma abordagem contínua e adaptativa para a negociação forex. Configurações: Configurações padrão no par de moedas
    Multi Fair Value Gap
    Kourosh Hossein Davallou
    **Added to the Original Text:**   This indicator (Fair Value Gap - FVG) also **has the capability** to display **multiple timeframes** of your choice **simultaneously on a single chart**. This feature allows you to identify **stronger and more accurate signals**, as you can analyze price discrepancies (Gaps) across higher or lower timeframes, helping you make smarter trading decisions.   For example, if you spot a bullish FVG on the **1-hour timeframe** and it is also confirmed on the **4-hour
    Keltner MTF
    Algoritmic Capital, Ltd.
    Keltner MTF     (Not repaint!!!) is a channel indicator that can display price channels from different timeframes on a single chart of quotes. For example, on the H1 chart, you can see at the same time the Keltner price channel from the M15 and H4 timeframe. This tactic makes it possible to more clearly understand the tendency of price movements, to determine trading goals and points for making deals. How the Keltner MTF Indicator Works The Keltner MTF indicator can be used both - for trading in
    This indicator uses a different approach from the previous version to get it's trendlines. This method is derived from Orchard Forex, and the process of making the indicator is demonstrated in there video   https://www.youtube.com/watch?v=mEaiurw56wY&t=1425s . The basic idea behind this indicator is it draws a   tangent line   on the highest levels and lowest levels of the bars used for calculation, while ensuring that the lines don't intersect with the bars in review (alittle confusing? I know
    FREE
    Oscillator helps determine the direction of the market Shows the direction of the price movement and is painted in the appropriate color. Allows you to conduct trend and counter trend trading It works on all timeframes, on any currency pairs, metals and cryptocurrency Can be used when working with binary options Distinctive features Does not redraw; Simple and clear settings; It works on all timeframes and on all symbols; Suitable for trading currencies, metals, options and cryptocurrency (Bitco
    Holy Trend PRO
    Bianca Seara
    5 (1)
    About Holy Trend was developed to identify trend and strength. VIDEO (information and tips) [HERE] Features Identifies trend Identifies strength of trend Identifies lines of support and resistance Easy to analyze Fast signals All timeframes Not repaint (when candle close) No settings required Can be used in Renko charts Can be used with indicator Holy Renko PRO Alerts, email and push notifications Advantages Sensitive identifier of trend able to identify the long, short movements and correct
    Smart Volume 2026 - Estrutura de Mercado Institucional & Volume Profile Smart Volume 2026 é a solução definitiva "Tudo-em-Um" para análise de Estrutura de Mercado no MetaTrader 4. A maioria dos traders falha porque opera às cegas, ignorando onde os volumes institucionais estão realmente se movendo. O Smart Volume 2026 resolve esse problema visualizando os três dados mais cruciais em um único gráfico limpo: Distribuição de Volume , Intensidade da Volatilidade e Rompimentos de Sessão (Breakouts)
    Moving Average Trend Scanner is a multi symbol multi timeframe triple MA crossover dashboard that helps traders to monitor, and identify potential market trends from one chart. This panel scans 3 moving averages in up to 28 configurable instruments and 9 timeframes for triple moving average alignment and moving average crossover  with a deep scan feature to scan all market watch symbols (up to 1000 instruments!). Download Demo here  (Scans only M1 and W1) Settings description here MT5 version
    Este indicador multi-quadro de tempo e multi-símbolo identifica topo / fundo duplo, cabeça       E       ombros, flâmula / triângulo e padrões de bandeira. Também é possível configurar alertas apenas quando uma ruptura do decote / triângulo / mastro tiver ocorrido (ruptura do decote = sinal confirmado para parte superior / inferior e cabeça e ombros).   O indicador também pode ser usado no modo de gráfico único. Por favor, leia mais sobre esta opção no produto   blog .       Combinado com suas p
    Hidden Gap by MMD MT4
    Mariusz Maciej Drozdowski
    Hidden Gap by MMD Hidden Gap by MMD is a unique indicator that detects hidden gaps between three consecutive candles. This observation isn't my own, but in the MMD methodology, it has its application alongside other original indicators. You can apply this indicator to the chart multiple times and set the interval from which you want to see the hidden gaps. You can show or hide these gaps as needed. For example, you can view the chart at an M5 interval and see hidden gaps from an M15 chart, etc.
    Custom Alerts: Monitore vários mercados e não perca nenhuma oportunidade importante Visão geral Custom Alerts é uma solução dinâmica para traders que desejam monitorar configurações potenciais em vários instrumentos a partir de um único local. Integrando dados de nossas ferramentas principais — como FX Power, FX Volume, FX Dynamic, FX Levels e IX Power — o Custom Alerts notifica automaticamente sobre movimentos importantes do mercado, sem a necessidade de alternar entre diversos gráficos ou pe
    Os compradores deste produto também adquirem
    Scalper Inside PRO
    Alexey Minkov
    4.74 (69)
    An exclusive indicator that utilizes an innovative algorithm to swiftly and accurately determine the market trend. The indicator automatically calculates opening, closing, and profit levels, providing detailed trading statistics. With these features, you can choose the most appropriate trading instrument for the current market conditions. Additionally, you can easily integrate your own arrow indicators into Scalper Inside Pro to quickly evaluate their statistics and profitability. Scalper Inside
    Gann Made Easy
    Oleg Rodin
    4.83 (156)
    Gann Made Easy é um sistema de negociação Forex profissional e fácil de usar, baseado nos melhores princípios de negociação usando a teoria do sr. W. D. Gann. O indicador fornece sinais precisos de COMPRA e VENDA, incluindo níveis de Stop Loss e Take Profit. Você pode negociar mesmo em movimento usando notificações PUSH. Entre em contato comigo após a compra para receber instruções de negociação e ótimos indicadores extras gratuitamente! Provavelmente você já ouviu muitas vezes sobre os métodos
    M1 Sniper
    Oleg Rodin
    5 (20)
    O M1 SNIPER é um sistema indicador de negociação fácil de usar. É um indicador de seta projetado para o período M1. O indicador pode ser usado como um sistema independente para scalping no período M1 e pode ser usado como parte do seu sistema de negociação existente. Embora este sistema de negociação tenha sido projetado especificamente para negociação no M1, ele também pode ser usado em outros períodos. Originalmente, desenvolvi este método para negociar XAUUSD e BTCUSD. Mas considero-o útil ta
    Atomic Analyst
    Issam Kassas
    5 (4)
    Primeiramente, vale ressaltar que este Indicador de Negociação não repinta, não redesenha e não apresenta atrasos, tornando-o ideal tanto para negociação manual quanto automatizada. Manual do utilizador: configurações, entradas e estratégia. O Analista Atômico é um Indicador de Ação de Preço PA que utiliza a força e o momentum do preço para encontrar uma vantagem melhor no mercado. Equipado com filtros avançados que ajudam a remover ruídos e sinais falsos, e aumentam o potencial de negociação.
    Linear Trend Predictor - Um indicador de tendência que combina pontos de entrada e linhas de apoio de direção. Funciona com base no princípio de quebrar o canal de preço alto/baixo. O algoritmo do indicador filtra o ruído do mercado, tem em conta a volatilidade e a dinâmica do mercado. Capacidades do indicador  Utilizando métodos de suavização, mostra a tendência do mercado e os pontos de entrada para abrir ordens de COMPRA ou VENDA.  Adequado para determinar os movimentos de mercado de curto
    O indicador " Dynamic Scalper System " foi desenvolvido para o método de scalping, operando dentro de ondas de tendência. Testado nos principais pares de moedas e ouro, é possível a compatibilidade com outros instrumentos de negociação. Fornece sinais para a abertura de posições de curto prazo ao longo da tendência, com suporte adicional para o movimento dos preços. O princípio do indicador: As setas grandes determinam a direção da tendência. Um algoritmo para gerar sinais de scalping sob a fo
    Trend Screener
    STE S.S.COMPANY
    4.79 (95)
    Indicador de tendência, solução única inovadora para negociação e filtragem de tendências com todos os recursos de tendências importantes construídos dentro de uma ferramenta! É um indicador multi-timeframe e multi-moedas 100% sem repintura que pode ser usado em todos os símbolos/instrumentos: forex, commodities, criptomoedas, índices e ações. OFERTA POR TEMPO LIMITADO: O indicador Support and Resistance Screener está disponível por apenas US$ 50e vitalício. (Preço original US$ 250) (oferta este
    Trend Lines PRO
    Roman Podpora
    5 (1)
    LINHAS DE TENDÊNCIA PRO       Ajuda a entender onde o mercado está realmente mudando de direção. O indicador mostra inversões de tendência reais e pontos onde os principais participantes retornam ao mercado. Você vê     Linhas BOS     Análise de tendências e níveis-chave em prazos maiores — sem configurações complexas ou ruídos desnecessários. Os sinais não são repintados e permanecem no gráfico após o fechamento da barra. VERSÃO MT 5      -      Revela seu potencial máximo quando emparelhada co
    NAM Order Blocks
    NAM TECH GROUP, CORP.
    3.67 (3)
    Indicador de detecção de blocos de pedidos de multi-timeframe MT4. Características - Totalmente personalizável no painel de controle do gráfico, fornece interação completa. - Oculte e mostre o painel de controle onde quiser. - Detectar OBs em vários períodos de tempo. - Selecione a quantidade de OBs para exibir. - Interface de usuário de OBs diferente. - Filtros diferentes em OBs. - Alerta de proximidade OB. - Linhas ADR de alta e baixa. - Serviço de notificação (alertas de tela | not
    GOLD Impulse with Alert
    Bernhard Schweigert
    4.67 (12)
    Este indicador é uma super combinação dos nossos 2 produtos Advanced Currency IMPULSE with ALERT  +   Currency Strength Exotics . Funciona para todos os períodos de tempo e mostra graficamente impulso de força ou fraqueza para as 8 principais moedas mais um Símbolo! Este Indicador é especializado para mostrar a aceleração da força da moeda para quaisquer símbolos como Ouro, Pares Exóticos, Commodities, Índices ou Futuros. É o primeiro do seu género, qualquer símbolo pode ser adicionado à 9ª
    MTF Supply Demand Zones
    Georgios Kalomoiropoulos
    4.82 (22)
    Próxima geração de zonas automatizadas de oferta e demanda. Algoritmo novo e inovador que funciona em qualquer gráfico. Todas as zonas estão sendo criadas dinamicamente de acordo com a ação do preço do mercado. DOIS TIPOS DE ALERTAS --> 1) QUANDO O PREÇO ATINGE UMA ZONA 2) QUANDO UMA NOVA ZONA É FORMADA Você não recebe mais um indicador inútil. Você obtém uma estratégia de negociação completa com resultados comprovados.     Novas características:     Alertas quando o preço atinge a zona d
    MetaForecast M4
    Vahidreza Heidar Gholami
    5 (2)
    MetaForecast prevê e visualiza o futuro de qualquer mercado com base nas harmonias nos dados de preços. Embora o mercado nem sempre seja previsível, se houver um padrão nos preços, o MetaForecast pode prever o futuro com a maior precisão possível. Em comparação com outros produtos similares, o MetaForecast pode gerar resultados mais precisos ao analisar as tendências do mercado. Parâmetros de entrada Past size (Tamanho do passado) Especifica o número de barras que o MetaForecast usa para criar
    Introducing the Delta Volume Profile Indicator - Unleash the Power of Institutional Precision!  Technical Indicator: Are you ready to trade like the pros? The Delta Volume Profile Indicator is no ordinary tool. It’s a high-precision, cutting-edge indicator that puts the power of institutional-grade trading in your hands. This unique indicator analyses delta volume distribution in real-time, revealing the market's hidden buy/sell imbalances that the biggest financial institutions rely on to antic
    Dynamic Forex28 Navigator
    Bernhard Schweigert
    4.43 (7)
    Dynamic Forex28 Navigator - A ferramenta de negociação Forex de última geração. ATUALMENTE 49% DE DESCONTO. Dynamic Forex28 Navigator é a evolução dos nossos indicadores populares de longa data, combinando o poder de três em um: Indicador Advanced Currency Strength28 (695 avaliações) + Advanced Currency IMPULSE com ALERTA (520 avaliações) + Sinais CS28 Combo (Bônus). Detalhes sobre o indicador https://www.mql5.com/en/blogs/post/758844 O que o Next-Generation Strength Indicator oferece?  Tudo
    Advanced Supply Demand
    Bernhard Schweigert
    4.91 (299)
    Atualmente com 40% de desconto! A melhor solução para qualquer Trader Novato ou especialista! Este indicador é uma ferramenta de negociação exclusiva, de alta qualidade e acessível porque incorporamos uma série de recursos proprietários e uma nova fórmula. Com esta atualização, você poderá mostrar fusos horários duplos. Você não só será capaz de mostrar um TF mais alto, mas também mostrar ambos, o TF do gráfico, MAIS o TF mais alto: MOSTRANDO ZONAS ANINHADAS. Todos os traders de Oferta e Demanda
    RFI levels PRO
    Roman Podpora
    5 (1)
    O indicador mostra com precisão os pontos de reversão e as zonas de retorno de preço onde o   Principais players . Você identifica onde novas tendências estão se formando e toma decisões com máxima precisão, mantendo o controle sobre cada negociação. VERSION MT5     -     Revela seu potencial máximo quando combinado com o indicador   TREND LINES PRO. O que o indicador mostra: Estruturas de reversão e níveis de reversão com ativação no início de uma nova tendência. Exibição dos níveis de   TAKE
    Adaptive Volatility Range [AVR] is a powerful tool for identifying key trend reversal points. AVR accurately reflects the Average True Range (ATR) of volatility, taking into account the Volume-Weighted Average Price (VWAP). The indicator adapts to any market volatility by calculating the average volatility over a specific period, ensuring a stable rate of profitable trades. You receive not just an indicator but a professional automated trading system , AVR-EA . Advantages: Automated Trading Sys
    TPSpro RFI Levels
    Roman Podpora
    4.86 (28)
    INSTRUÇÕES RUS  /  INSTRUÇÕES   ENG  /  Versão MT5 Principais funções: Exibe zonas ativas de vendedores e compradores! O indicador exibe todos os níveis/zonas de impulso iniciais corretos para compras e vendas. Quando esses níveis/zonas são ativados, onde a busca por pontos de entrada começa, os níveis mudam de cor e são preenchidos com cores específicas. Setas também aparecem para uma percepção mais intuitiva da situação. LOGIC AI - Exibição de zonas (círculos) para busca de pontos de entrada
    Super Reversal Indicator with Alert Visão Geral Super Reversal Indicator with Alert é uma ferramenta de trading multi timeframe projetada para identificar oportunidades de reversão de alta probabilidade no mercado, utilizando uma combinação de momentum do estocástico, zonas de oferta e demanda e sinais de rejeição de preço. O indicador ajuda os traders a detectar possíveis pontos de reversão no mercado através de sinais visuais claros e alertas em tempo real. Principais Funcionalidades Análise E
    Versão MT5 disponível aqui: https://www.mql5.com/en/market/product/50048 Canal e grupo do Telegram: https://t.me/bluedigitsfx Acesso ao grupo V.I.P: Envie o comprovante de pagamento de qualquer um dos nossos produtos pagos para a nossa caixa de entrada Corretora recomendada: https://bit.ly/BlueDigitsFxStarTrader BlueDigitsFx Easy 123 System — Sistema poderoso para detecção de reversões e rompimentos no MT4 Sistema tudo-em-um e sem repintura para identificar mudanças na estrutura do mercado,
    TrendLine PRO MT4
    Evgenii Aksenov
    4.83 (167)
    The Trend Line PRO indicator is an independent trading strategy. It shows the trend change, the entry point to the transaction, as well as automatically calculates three levels of Take Profit and Stop Loss protection. Trend Line PRO is perfect for all Meta Trader symbols: currencies, metals, cryptocurrencies, stocks and indices. The indicator is used in trading on real accounts, which confirms the reliability of the strategy. Robots using   Trend Line PRO   and real Signals can be found here:   
    Currency Strength Wizard é um indicador muito poderoso que fornece uma solução completa para uma negociação bem-sucedida. O indicador calcula o poder deste ou daquele par forex usando os dados de todas as moedas em vários intervalos de tempo. Esses dados são representados em uma forma de índice de moeda fácil de usar e linhas de energia de moeda que você pode usar para ver o poder desta ou daquela moeda. Tudo o que você precisa é anexar o indicador ao gráfico que deseja negociar e o indicador mo
    Volatility Trend System - um sistema de negociação que dá sinais para entradas. O sistema de volatilidade fornece sinais lineares e pontuais na direção da tendência, bem como sinais para sair dela, sem redesenho e atrasos. O indicador de tendência monitora a direção da tendência de médio prazo, mostra a direção e sua mudança. O indicador de sinal é baseado em mudanças na volatilidade e mostra entradas no mercado. O indicador está equipado com vários tipos de alertas. Pode ser aplicado a vários i
    FX Power MT4 NG
    Daniel Stein
    4.95 (21)
    FX Power: Analise a Força das Moedas para Decisões de Negociação Mais Inteligentes Visão Geral FX Power é a sua ferramenta essencial para compreender a força real das principais moedas e do ouro em quaisquer condições de mercado. Identificando moedas fortes para comprar e fracas para vender, FX Power simplifica as decisões de negociação e revela oportunidades de alta probabilidade. Quer você prefira seguir tendências ou antecipar reversões usando valores extremos de Delta, esta ferramenta adap
    Matrix Arrow Indicator MT4
    Juvenille Emperor Limited
    5 (3)
    O Matrix Arrow Indicator MT4 é uma tendência única 10 em 1 seguindo um indicador multi-timeframe 100% sem repintura que pode ser usado em todos os símbolos/instrumentos: forex, commodities, criptomoedas, índices, ações. O Matrix Arrow Indicator MT4 determinará a tendência atual em seus estágios iniciais, reunindo informações e dados de até 10 indicadores padrão, que são: Índice de movimento direcional médio (ADX) Índice de canal de commodities (CCI) Velas clássicas de Heiken Ashi Média Móvel Di
    Scalper Vault
    Oleg Rodin
    5 (36)
    Scalper Vault é um sistema profissional de escalpelamento que fornece tudo o que você precisa para um escalpelamento bem-sucedido. Este indicador é um sistema de negociação completo que pode ser usado por comerciantes de forex e opções binárias. O período de tempo recomendado é M5. O sistema fornece sinais de seta precisos na direção da tendência. Ele também fornece sinais superiores e inferiores e níveis de mercado Gann. Os indicadores fornecem todos os tipos de alertas, incluindo notificações
    Actualmente 40% OFF ! A melhor solução para qualquer novato ou comerciante especializado! Este software de painel de instrumentos está a funcionar em 28 pares de moedas. É baseado em 2 dos nossos principais indicadores (Advanced Currency Strength 28 e Advanced Currency Impulse). Dá uma grande visão geral de todo o mercado Forex. Mostra valores avançados de força da moeda, velocidade de movimento da moeda e sinais para 28 pares de divisas em todos os (9) períodos de tempo. Imagine como a sua n
    Order Block Hunter
    Noha Mohamed Fathy Younes Badr
    5 (10)
    Order block hunter indicator is the best indicator for  hunt the order blocks that area where there has been a large concentration of limit orders waiting to be executed Order blocks are identified on a chart by observing previous price action and looking for areas where the price experienced significant movement or sudden changes in direction .This indicator does that for you by using very complicated codes and helps you to take the best areas To buy and sell because it make marks at the best a
    Trend indicator AI
    Ramil Minniakhmetov
    4.49 (84)
    O indicador Trend Ai é uma ótima ferramenta que irá melhorar a análise de mercado de um trader, combinando a identificação de tendências com pontos de entrada acionáveis e alertas de reversão. Este indicador permite que os usuários naveguem pelas complexidades do mercado forex com confiança e precisão Além dos sinais primários, o indicador Trend Ai identifica pontos de entrada secundários que surgem durante retrações ou retrações, permitindo que os comerciantes capitalizem as correções de preço
    GEM Signal Pro GEM Signal Pro é um indicador seguidor de tendência para MetaTrader 4, desenvolvido para traders que desejam sinais mais claros, setups mais estruturados e uma gestão de risco mais prática diretamente no gráfico. Em vez de mostrar apenas uma seta simples, o GEM Signal Pro ajuda a apresentar a ideia completa da operação de forma mais clara e fácil de entender. Quando as condições são confirmadas, o indicador pode mostrar o preço de entrada, o stop loss e os alvos de take profit no
    Mais do autor
    MTF MultiMeter5
    GRANTLEY LAURENCE CAUSE
    Benefits: A new and innovative way of looking across multiple timeframes and multiple indicators on any chart. Provides instant multi-timeframe analysis of any market. i.e. forex currency pairs, cryptocurrency pairs, commodities, etc. It offers precise indications across multiple timeframes of volatility as measured by RSI, ADX and STOCH within one chart. Helps you determine high probability trading setups. See example strategy in comments. Can see bullish/bearish volatility building across mult
    Filtro:
    Sem comentários
    Responder ao comentário