AC Chart Indicator

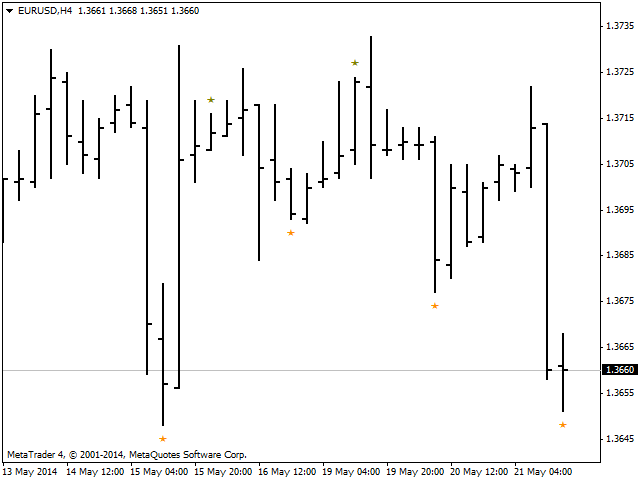
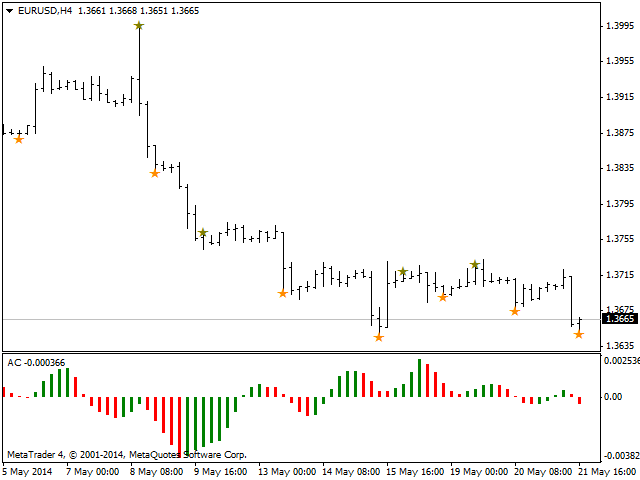
O indicador mostra sobre os sinais do gráfico de Accelerator Oscillator (AC) de acordo com as estratégias de Bill Williams.

Gráfico de barras AC é a diferença entre o valor de 5/34 do gráfico de barras força motriz e 5-período média móvel simples, retiradas desse gráfico de barras.

Interpretação do acelerador oscilador (AC) baseia-se nas seguintes regras-se o AC for maior do que a linha de nada, considerou-se que a aceleração continuará o movimento para cima. A mesma regra se aplica para movimentos descendentes, se o AC está abaixo da linha zero. Sinais de um aumento mercado são confirmadas por duas barras verdes (um a seguir ao outro) e o AC está acima da linha de zero. Indicação de um declínio do mercado é confirmada por duas barras vermelhas (uma após a outra), quando o AC está abaixo da linha zero.

Uma abordagem mais agressiva para a interpretação AC procura de sinais, ao passo que o oscilador de CA está no lado oposto da linha de zero (para os comerciantes, considerando uma posição longa - abaixo da linha de zero, e o oposto no caso de posições curtas). Em tal situação seria necessário para a confirmação de uma barra adicional. Como resultado, quando o AC está abaixo da linha zero eo investidor está considerando abrir uma posição longa, deve haver pelo menos três barras verdes que aparecem abaixo da linha de nada.

1. Sinais de compra aparece nos seguintes casos:

◾ valor indicador está acima da linha de zero e cresce na barra de corrente e o anterior;
◾ valor do indicador está abaixo da linha zero e cresce na barra atual e as duas anteriores.

2. Sinais de venda aparece quando:

◾ valor do indicador está abaixo da linha zero e diminui na corrente ea barra anterior;
◾ valor do indicador está acima da linha zero e diminui na barra atual e as duas anteriores.
Produtos recomendados
Infinity Trend Pro
Yaroslav Varankin
1 (1)
This is a trend indicator without redrawing Developed instead of the binary options strategy (by the color of the Martingale candlestick) Also works well in forex trading When to open trades (binary options) A signal will appear in the place with a candle signaling the current candle It is recommended to open a deal for one candle of the current timeframe M1 and M5 When a blue dot appears, open a deal up When a red dot appears, open a trade down. How to open trades on Forex. When a signal is rec
Indicador Crypto_Forex "Morning Star pattern" para MT4. - O indicador "Morning Star pattern" é um indicador muito poderoso para negociação de Price Action: sem repintura, sem atraso. - O indicador detecta padrões Morning Star otimistas no gráfico: sinal de seta azul no gráfico (veja as imagens). - Com alertas para PC, celular e e-mail. - Também seu irmão - o indicador bearish "Evening Star pattern" está disponível (siga o link abaixo). - O indicador "Morning Star pattern" é excelente para comb
Mirror
Stanislav Korotky
This indicator predicts rate changes based on the chart display principle. It uses the idea that the price fluctuations consist of "action" and "reaction" phases, and the "reaction" is comparable and similar to the "action", so mirroring can be used to predict it. The indicator has three parameters: predict - the number of bars for prediction (24 by default); depth - the number of past bars that will be used as mirror points; for all depth mirroring points an MA is calculated and drawn on the ch
Alpha Trend sign has been a very popular trading tool in our company for a long time. It can verify our trading system and clearly indicate trading signals, and the signals will not drift. Main functions: Based on the market display of active areas, indicators can be used to intuitively determine whether the current market trend belongs to a trend market or a volatile market. And enter the market according to the indicator arrows, with green arrows indicating buy and red arrows indicating se
Trendiness Index
Libertas LLC
5 (3)
"The trend is your friend" is one of the best known sayings in investing, because capturing large trendy price movements can be extremely profitable. However, trading with the trend is often easier said than done, because many indicators are based on price reversals not trends. These aren't very effective at identifying trendy periods, or predicting whether trends will continue. We developed the Trendiness Index to help address this problem by indicating the strength and direction of price trend
Phase Analytics Pro: Advanced Cyclic Market Analyzer Phase Analytics Pro is a sophisticated technical tool designed for traders who prioritize mathematical precision over lag-heavy traditional indicators. Based on the principles of digital signal processing, this indicator decomposes price action into phase and quadrature components to identify the dominant market cycle. How it works: The algorithm calculates the instantaneous phase of the market, allowing it to distinguish between trending and
The Th3Eng PipFinite indicator is based on a very excellent analysis of the right trend direction with perfect custom algorithms. It show the true direction and the best point to start trading. With StopLoss point and Three Take Profit points. Also it show the right pivot of the price and small points to order to replace the dynamic support and resistance channel, Which surrounds the price. And Finally it draws a very helpful Box on the left side on the chart includes (take profits and Stop loss
Super Reversal Pattern
Parfait Mujinga Ndalika
Super Reversal Pattern Indicator Unlock the power of advanced pattern recognition with our Super Reversal Pattern Indicator. Designed for traders seeking precision and reliability, this indicator identifies one of the most effective reversal patterns in technical analysis, offering a significant edge in your trading strategy. Key Features: Non-Repainting Accuracy: Enjoy the confidence of non-repainting technology. Once a Super Reversal Pattern is detected, it remains static, providing consiste
O indicador Crypto_Forex "Auto FIBO Pro" é uma ótima ferramenta auxiliar na negociação! - O indicador calcula e coloca automaticamente no gráfico os níveis de Fibonacci e as linhas de tendência locais (cor vermelha). - Os níveis de Fibonacci indicam áreas-chave onde o preço pode reverter. - Os níveis mais importantes são 23,6%, 38,2%, 50% e 61,8%. - Pode utilizá-lo para scalping de reversão ou para negociação de grelha de zona. - Existem muitas oportunidades para melhorar o seu sistema atual ut
MA Crosses PRO MT4
Volodymyr Hrybachov
MA CROSSES PRO MT4 é um indicador de seta cruzada de média móvel. Os parâmetros do indicador têm nomes intuitivos e cada uma das linhas é configurada separadamente. O indicador pode sinalizar um sinal exibindo setas, emitindo um sinal sonoro, enviando uma notificação para terminais móveis e e-mail. O indicador NÃO é redesenhado Sinais apenas no fechamento da vela Excelente para escalpelamento Funciona em qualquer par e qualquer período de tempo Quanto mais antigo for o prazo, melhor será o s
"Adjustable Fractals Pro" - é uma versão avançada do indicador fractal, uma ferramenta de negociação muito útil! - Como sabemos, o indicador Standard fractals mt4 não tem definições, o que é muito inconveniente para os traders. - O Adjustable Fractals Pro resolveu este problema - tem todas as definições necessárias: - Período ajustável do indicador (valores recomendados - acima de 7). - Distância ajustável entre máximas e mínimas de preço. - Design ajustável de setas fractais. - Possui Info Sp
Point61 Indicator
Evgeniy Machok
5 (1)
The Point61 indicator is the result of many years of monitoring of price behavior of currency pairs and metals. It is not a secret, that in times of uncertainty, traders are looking for possible levels of support and resistance - the point, where price should stop its movement. There are 2 possible scenarios at these points: 1. Reverse (correction) to the opposite direction; 2. Breakthrough to continue movement. Very often these points are used to set stop orders - TakeProfit or StopLoss
Stepping Trend
Mpendulo Chiliza
The Stepping Trend Indicator     The Steppi ng Trend indicator uses the  average true range  (ATR indicator) in its calculation. This gives you control to set your own average true range period, I set the Default as 10.   Indicator Details. Green Arrow Up: This means you are at the starting point of a new bullish trend, it’s time to buy.   Red  Arrow  Down : This means you are at the starting point of a new  bearish  trend, it’ s time to sell .   What if you miss the Arrow Signal?   No prob
Trend Monitor
Pavel Zamoshnikov
4 (4)
The indicator generates early signals basing on ADX reading data combined with elements of price patterns. Works on all symbols and timeframes. The indicator does not redraw its signals. You see the same things on history and in real time. For better visual perception signals are displayed as arrows (in order not to overload the chart). Features Easy to use. Filter configuration only requires selection of sensitivity in the " Sensitivity of the indicator " input. Signals can be filtered using
Trade with Gann on your side!! MASTER CIRCLE 360 CIRCLE CHART, originally created by Gann admitted that this is “The Mother of all charts”. It is one of the last studies that this great trader left for us. The numeric tab le is apparently quite simple like all the tables and is based on square numbers, the SQUARE OF 12 and is by evolution, one of the most important square numbers. Here we can find CYCLE, PRICE AND TIME thanks to angles and grades, to show past and future support and resistance.
Distinctive
Tatiana Savkevych
Distinctive is a forex trending arrow indicator for identifying potential entry points. I like it, first of all, because it has a simple mechanism of work, adaptation to all time periods and trading tactics. Created on the basis of a regression channel with filters. Plotting the Lawrence indicator signals on a price function chart using a mathematical approach. How it works - when the price breaks out in the overbought / oversold zone (channel levels), a buy or sell signal is generated. Everyt
Cosmic Diviner X Planet
Olena Kondratenko
4 (2)
This unique multi-currency strategy simultaneously determines the strength of trends and market entry points, visualizing this using histograms on the chart. The indicator is optimally adapted for trading on the timeframes М5, М15, М30, Н1. For the convenience of users, the indicator renders the entry point (in the form of an arrow), recommended take profit levels (TP1, TP2 with text labels) and the recommended Stop Loss level. The take profit levels (TP1, TP2) are automatically calculated for
RSI Speed mp
DMITRII GRIDASOV
Indicador Crypto_Forex "RSI SPEED" para MT4 - ótima ferramenta preditiva, sem necessidade de repintura. - O cálculo deste indicador é baseado em equações da física. O RSI SPEED é a primeira derivada do próprio RSI. - O RSI SPEED é bom para entradas de scalping na direção da tendência principal. - Use-o em combinação com um indicador de tendência adequado, por exemplo, HTF MA (como nas imagens). - O indicador RSI SPEED mostra a rapidez com que o próprio RSI muda de direção - ele é muito sensíve
Fractal Zig Zag
Mikhail Nazarenko
A   professional version of the ZigZag indicator for visualizing the structure of price movements by fractals. Fractal ZigZag fixes the flaws of the standard version of the ZigZag indicator MT4. It uses Price action and a unique filtering algorithm to determine fractals. Suitable for all types of trading. Ideal for trading according to the WM pattern "Sniper" strategy !!! Features Marks the place of price reversal during the formation of a new fractal with specified parameters. Suitable for al
“Naturu” é um indicador manual que usa a simetria da natureza como seu algoritmo. Domine o mercado com uma estratégia simples e sabedoria oculta! Ao carregar o indicador, você verá duas linhas: Superior (Top) e Inferior (Bottom). Clique uma vez em uma linha para ativá-la. Para movê-la, basta clicar na vela onde deseja posicioná-la. Você define um ponto alto e um ponto baixo, e o indicador calcula automaticamente: Uma zona magenta que mostra onde os interesses de touros e ursos estão mais próximo
O indicador SMC Venom Model BPR é uma ferramenta profissional para os traders que trabalham com o conceito Smart Money (SMC). Identifica automaticamente dois padrões principais no gráfico de preços: FVG   (Fair Value Gap) é uma combinação de três velas, em que existe um gap entre a primeira e a terceira velas. Forma uma zona entre níveis onde não há suporte de volume, o que geralmente leva a uma correção de preço. BPR   (Balanced Price Range) é uma combinação de dois padrões FVG que formam uma “
Chart Patterns Detect 15 patterns (Ascending Triangle, Descending Triangle, Rising Wedge, Falling Wedge, Bullish Flag, Bearish Flag, Bullish Rectangle, Bearish Rectangle Symmetrical triangle, Head and Shoulders, Inverted Head and Shoulders, Triple top, Triple Bottom, Double Top, Double Bottom) Use historical data to calculate the probability of each pattern to succeed (possibility to filter notification according to the chance of success) gives graphic indication about the invalidation level and
Trend Ray
Andriy Sydoruk
The indicator shows the potential trend direction by cyclical-wave dependence. Thus, all the rays of the intersection will be optimal rays, in the direction of which the price is expected to move, taking into account the indicator period. Rays can be used as a direction for potential market movement. But we must not forget that the approach must be comprehensive, the indicator signals require additional information to enter the market.
Swing Continuation
Noiros Tech
2.6 (5)
The swing continuation pattern happens in a trend direction after a short reversal / pull back . As the name suggests , these patterns occurs along the swing high and swing lows of a trend , this makes the patterns very low risk patterns with potential high rewards . The swing continuation indicator also combines Currency Meter as a filter for its execution. The idea is to go with both the price trend flow and currency trend flow. Which means the price action must be supported by the currency st
The indicator draws candles of the selected high timeframe on the current chart. It supports both standard timeframes and custom ones set in minutes. Built-in support for displaying the size of the candle, its body, as well as the upper and lower shadows. Alerts when High / Low breaks the previous candlestick of the selected timeframe. Customized types of elements for the simultaneous operation of several indicators on the same chart.
This indicator is another variant of the famous powerful indicator Fibonacci-SS https://www.mql5.com/en/market/product/10136 but has different behaviour in placing Pending Order and TP Line. Automatically places Fibonacci retracement lines from the last highest and lowest visible bars on the chart with: An auto Pending Order (Buy/Sell). Taking Profit 1, Taking Profit 2 is pivot point and Taking Profit 3 for extended reward opportunity. The best risk and reward ratio. Simple and powerful indicat
Renko, Heiken Ashi, Ticks Bar, Range Bar.    Easy switching, easy setup, all in one window.        Place the Custom Chart indicator and view Renko, Heiken Ashi, Tick bar, Range bar charts in real time at real chart.    Position the offline chart window so that the indicator control panel is visible.    Switch the chart mode by click of a button.    Connect to the output chart any indicator, expert advisor without any restrictions.    No, it doesn't work in the tester.    Yes, you can use an
Indicador. "Onda indicadora ou Indicador Ma". Usando 23 indicadores padrão e o algoritmo do autor, os níveis de compras (de 0 a +100) e vendas (de 0 a -100) são calculados. Em seguida, usando os níveis calculados, o "Indicador de onda" desenha uma onda com 21 médias móveis. O número da onda é igual ao período médio dos níveis calculados. Ondas # 1 - 7 médias móveis rápidas Ondas das médias móveis 8 -14 médias Ondas das médias móveis lentas nº 15-21 Olhando para os números desenhados pelo indi
This indicator monitors the market for a flat state and possible breakout. The flat state is detected as a predefined number of consecutive bars during which price fluctuates inside a small range. If one of the next bars closes outside the range, breakout is signaled. The indicator shows 3 lines: blue - upper bound of flat ranges AND consecutive breakout areas; red - lower bound of flat ranges AND consecutive breakout areas; yellow - center of flat ranges (NOT including breakout areas). When a b
Line Magnit
Aleksey Trenin
The LineMagnit Indicator for MT4 is a highly precise tool that builds support and resistance levels which magnetically attract prices. This feature allows traders to easily determine the most probable entry and exit points in the market, as well as identify the market's directional forces, as levels are based on capital inflows into the instrument. Equipped with an intuitively understandable graphical interface, the LineMagnit Indicator enables users to quickly locate and analyze support and res
Os compradores deste produto também adquirem
Neuro Poseidon MT4
Daria Rezueva
4.96 (27)
Neuro Poseidon is a new indicator by Daria Rezueva. It combines precise trading signals with adaptive TP/SL levels - creating best possible trades as a result! Message me and get  Neuro Poseidon Assistant  as a gift to automize your trading process! What makes it stand out? 1. Proven profitability on all assets and timeframes 2. Only confirmed BUY and SELL signals present on the chart 3. Adaptive TP & SL levels generated by the software for each trade 4. Easy to understand - suitable for all
M1 Sniper
Oleg Rodin
5 (23)
O M1 SNIPER é um sistema indicador de negociação fácil de usar. É um indicador de seta projetado para o período M1. O indicador pode ser usado como um sistema independente para scalping no período M1 e pode ser usado como parte do seu sistema de negociação existente. Embora este sistema de negociação tenha sido projetado especificamente para negociação no M1, ele também pode ser usado em outros períodos. Originalmente, desenvolvi este método para negociar XAUUSD e BTCUSD. Mas considero-o útil ta
Gann Made Easy
Oleg Rodin
4.84 (164)
Gann Made Easy é um sistema de negociação Forex profissional e fácil de usar, baseado nos melhores princípios de negociação usando a teoria do sr. W. D. Gann. O indicador fornece sinais precisos de COMPRA e VENDA, incluindo níveis de Stop Loss e Take Profit. Você pode negociar mesmo em movimento usando notificações PUSH. Entre em contato comigo após a compra para receber instruções de negociação e ótimos indicadores extras gratuitamente! Provavelmente você já ouviu muitas vezes sobre os métodos
Scalper Inside PRO
Alexey Minkov
4.74 (68)
Scalper Inside PRO Scalper Inside PRO is an intraday trend and scalping indicator for MetaTrader 4 that uses an exclusive algorithm to quickly detect market direction and key target levels. It automatically calculates entry, exit and multiple profit targets, and shows detailed performance statistics so you can see how different instruments and strategies performed. This helps you choose the most suitable trading instruments for the current market conditions. Additionally, you can easily integrat
O sistema PRO Renko é um sistema de negociação altamente preciso especialmente concebido para a negociação de gráficos RENKO. Trata-se de um sistema universal que pode ser aplicado a vários instrumentos de negociação. O sistema neutraliza eficazmente o chamado ruído de mercado, dando-lhe acesso a sinais de inversão precisos. O indicador é muito fácil de usar e tem apenas um parâmetro responsável pela geração de sinal. Você pode facilmente adaptar a ferramenta a qualquer instrumento de negocia
Dynamic Forex28 Navigator
Bernhard Schweigert
4.43 (7)
Dynamic Forex28 Navigator - A ferramenta de negociação Forex de última geração. ATUALMENTE 49% DE DESCONTO. Dynamic Forex28 Navigator é a evolução dos nossos indicadores populares de longa data, combinando o poder de três em um: Indicador Advanced Currency Strength28 (695 avaliações) + Advanced Currency IMPULSE com ALERTA (520 avaliações) + Sinais CS28 Combo (Bônus). Detalhes sobre o indicador https://www.mql5.com/en/blogs/post/758844 O que o Next-Generation Strength Indicator oferece?  Tudo
Trend Catcher ind
Ramil Minniakhmetov
5 (1)
INDICADOR TREND CATCHER O Indicador Trend Catcher analisa os movimentos de preços do mercado, utilizando uma combinação de indicadores de análise de tendências adaptativos, proprietários e personalizados pelo autor. Identifica a verdadeira direção do mercado, filtrando o ruído de curto prazo e focando a força do momentum subjacente, a expansão da volatilidade e o comportamento da estrutura de preços. Utiliza também uma combinação de indicadores personalizados de suavização e filtragem de tendê
Trend Lines PRO
Roman Podpora
5 (1)
LINHAS DE TENDÊNCIA PRO       Ajuda a entender onde o mercado está realmente mudando de direção. O indicador mostra inversões de tendência reais e pontos onde os principais participantes retornam ao mercado. Você vê     Linhas BOS     Análise de tendências e níveis-chave em prazos maiores — sem configurações complexas ou ruídos desnecessários. Os sinais não são repintados e permanecem no gráfico após o fechamento da barra. VERSÃO MT 5      -      Revela seu potencial máximo quando emparelhada co
Enigmera
Ivan Stefanov
5 (8)
ENIGMERA: O núcleo do mercado Importante: A demonstração do MQL5.com funciona no Strategy Tester e pode não refletir completamente a funcionalidade do Enigmera. Verifique a descrição, as capturas de tela e o vídeo para mais detalhes. Fique à vontade para me enviar uma mensagem com qualquer dúvida! O código do indicador foi completamente reescrito. A versão 3.0 adiciona novas funcionalidades e corrige erros acumulados desde o início do indicador. Introdução Este indicador e sistema de negociação
KT Alpha Hunter Arrows MT4
KEENBASE SOFTWARE SOLUTIONS
A maioria dos indicadores de setas entrega um sinal e deixa você descobrir todo o resto sozinho. O KT Alpha Hunter Arrows entrega um plano de trading completo. Cada seta de sinal aparece com um plano completo já desenhado no gráfico: linha de entrada, stop loss, quatro níveis de take profit e um veredito de edge em tempo real, mostrando se aquele ativo e timeframe valem a pena ser operados naquele momento. O pacote inclui o Trade Manager EA, que cuida da execução depois que você entra na operaçã
Este indicador é um indicador para análise automática de ondas que é perfeito para negociações práticas! Caso... Nota:   Não estou acostumado a usar nomes ocidentais para classificação de ondas. Devido à influência da convenção de nomenclatura de Tang Lun (Tang Zhong Shuo Zen), nomeei a onda básica como   uma caneta   e a banda de onda secundária como   um segmento   . ao mesmo tempo, o segmento tem a direção da tendência.   O segmento de tendência principal   é nomeado (esse método de nomencl
Genesis Matrix Pro is a professional multi-timeframe trend detection indicator designed to help traders identify high-quality market alignment with clarity and structure. It combines 12 different technical indicators into one visual alignment matrix, allowing traders to quickly see when market conditions are bullish, bearish, or neutral. A signal is generated only when the selected strategies are aligned, helping reduce noise and improve decision-making. PLEASE CONTACT ME AFTER PURCHASE TO GET
Este produto foi atualizado para o mercado de 2026 e otimizado para as versões mais recentes do MT5. AVISO DE ATUALIZAÇÃO DE PREÇO: Smart Trend Trading System está atualmente disponível por $99 . O preço aumentará para $199 após as próximas 30 compras . OFERTA ESPECIAL: Após comprar o Smart Trend Trading System, envie-me uma mensagem privada para receber o Smart Universal EA GRÁTIS e transformar seus sinais do Smart Trend em operações automatizadas. Smart Trend Trading System é um sistema de tr
MTF Supply Demand Zones
Georgios Kalomoiropoulos
4.82 (22)
Próxima geração de zonas automatizadas de oferta e demanda. Algoritmo novo e inovador que funciona em qualquer gráfico. Todas as zonas estão sendo criadas dinamicamente de acordo com a ação do preço do mercado. DOIS TIPOS DE ALERTAS --> 1) QUANDO O PREÇO ATINGE UMA ZONA 2) QUANDO UMA NOVA ZONA É FORMADA Você não recebe mais um indicador inútil. Você obtém uma estratégia de negociação completa com resultados comprovados.     Novas características:     Alertas quando o preço atinge a zona d
PZ Trend Trading
PZ TRADING SLU
4.8 (5)
O Trend Trading é um indicador projetado para lucrar o máximo possível com as tendências que ocorrem no mercado, cronometrando retrocessos e rupturas. Ele encontra oportunidades de negociação analisando o que o preço está fazendo durante as tendências estabelecidas. [ Guia de instalação | Guia de atualização | Solução de problemas | FAQ | Todos os produtos ] Negocie mercados financeiros com confiança e eficiência Lucre com as tendências estabelecidas sem ser chicoteado Reconhecer retrocessos
Step into the world of Forex trading with confidence, clarity, and precision using   Gold Indicator   a next-generation tool engineered to take your trading performance to the next level. Whether you’re a seasoned professional or just beginning your journey in the currency markets, Gold Indicator equips you with powerful insights and help you trade smarter, not harder. Built on the proven synergy of three advanced indicators, Gold Indicator focuses exclusively on medium and long-term trends eli
MetaBands M4
Vahidreza Heidar Gholami
3.5 (6)
MetaBands utiliza algoritmos poderosos e únicos para desenhar canais e detectar tendências, a fim de fornecer aos traders pontos potenciais para entrar e sair de negociações. É um indicador de canal mais um indicador de tendência poderoso. Inclui diferentes tipos de canais que podem ser mesclados para criar novos canais simplesmente usando os parâmetros de entrada. O MetaBands usa todos os tipos de alertas para notificar os usuários sobre eventos de mercado. Recursos Suporta a maioria dos algori
Current event:  https://c.mql5.com/1/326/A2SR2025_NoMusic.gif A. O que é A2SR ?   * É um indicador técnico importante (sem repintura, sem atraso). -- Orientação : -- em https://www.mql5.com/en/blogs/post/734748/page4#comment_16532516 -- e https://www.mql5.com/en/users/yohana/blog A2SR tem uma técnica especial para determinar os níveis de Suporte (demanda) e Resistência (oferta). Ao contrário da maneira comum que vimos na rede, o A2SR tem um conceito original na determinação dos níveis reais
Versão Swing M30/H1/H4 disponível Quer pegar os grandes movimentos? Gold Signal Swing Pro (M30/H1/H4). Alvo: $20-$80+ por operação. https://www.mql5.com/en/market/product/177643 KURAMA GOLD SIGNAL PRO (MT4) — Sistema Completo de Trading XAUUSD com Filtro de 7 Camadas, TP/SL Automático e Pontuação de Qualidade SEM REPINTURA. SEM REDESENHO. SEM ATRASO. Cada sinal é permanente. O que você vê é o que recebe. BÔNUS: Compre a licença vitalícia e receba AI
BTMM State Engine Pro is a MetaTrader 4 indicator for traders who use the Beat The Market Maker approach: Asian session context, kill zone timing, level progression, peak formation detection, and a multi-pair scanner from a single chart. It combines cycle state logic with a built-in scanner dashboard so you do not need the same tool on many charts at once. What it does Draws the Asian session range; session times can follow broker server offset or be set in inputs. Tracks level progression (L
Advanced Supply Demand
Bernhard Schweigert
4.91 (300)
Atualmente com 40% de desconto! A melhor solução para qualquer Trader Novato ou especialista! Este indicador é uma ferramenta de negociação exclusiva, de alta qualidade e acessível porque incorporamos uma série de recursos proprietários e uma nova fórmula. Com esta atualização, você poderá mostrar fusos horários duplos. Você não só será capaz de mostrar um TF mais alto, mas também mostrar ambos, o TF do gráfico, MAIS o TF mais alto: MOSTRANDO ZONAS ANINHADAS. Todos os traders de Oferta e Demanda
Price & Time Market Structure Indicator A professional market structure tool that analyzes waves through both price and time — not price alone. Main Description NeoWave PRO is a professional market structure indicator for MetaTrader 4 designed for traders who want to move beyond traditional one-dimensional wave tools such as ZigZag, swing indicators, and basic high/low systems. Most wave indicators analyze only one thing: Price. But a real market wave is not only a price movement. A true wave de
RFI levels PRO
Roman Podpora
5 (1)
O indicador mostra com precisão os pontos de reversão e as zonas de retorno de preço onde o   Principais players . Você identifica onde novas tendências estão se formando e toma decisões com máxima precisão, mantendo o controle sobre cada negociação. VERSION MT5     -     Revela seu potencial máximo quando combinado com o indicador   TREND LINES PRO. O que o indicador mostra: Estruturas de reversão e níveis de reversão com ativação no início de uma nova tendência. Exibição dos níveis de   TAKE
Quant Direction
Georgios Kalomoiropoulos
Quant Direction é uma ferramenta de análise de mercado tridimensional. Ela oferece uma análise de mercado totalmente objetiva, baseada em algoritmos, que calcula simultaneamente desvios percentuais precisos em diversos parâmetros. Desenvolvido com ferramentas avançadas de modelagem com inteligência artificial e rigorosamente testado, o algoritmo foi projetado para interpretar o mercado com precisão sem precedentes. Você pode analisar qualquer par de moedas ou instrumento financeiro em sua plataf
MonsterDash Harmonic Indicator is a harmonic pattern dashboard. It recognizes all major patterns. MonsterDash is a dashboard that displays all detected patterns for all symbols and (almost) all timeframes in sortable and scrollable format. Users can add their own user defined patterns . MonsterDash can open and update charts with the pattern found. Settings MonsterDash's default settings are good enough most of the time. Feel free to fine tune them to your needs. The color settings are for thos
O Apollo SR Master é um indicador de Suporte/Resistência com recursos especiais que tornam a negociação com zonas de Suporte/Resistência mais fácil e confiável. O indicador calcula as zonas de Suporte/Resistência em tempo real, sem qualquer atraso, detectando topos e fundos de preço locais. Em seguida, para confirmar a área de Suporte/Resistência recém-formada, o indicador exibe um sinal especial que indica que a zona pode ser considerada e usada como um sinal de VENDA ou COMPRA. Nesse caso, a f
ACTUALMENTE COM 40% DE DESCONTO A melhor solução para qualquer novato ou comerciante especializado! Este Indicador é uma ferramenta comercial única, de alta qualidade e acessível, porque incorporámos uma série de características proprietárias e uma nova fórmula. Com apenas UM gráfico, pode ler a força da moeda para 28 pares de Forex! Imagine como a sua negociação irá melhorar porque é capaz de apontar o ponto exacto do gatilho de uma nova tendência ou oportunidade de escalada? Manual do util
Auto Optimized Parabolic RSI: Avançado Motor de Momentum 3D A maioria dos indicadores de varejo falha porque depende de parâmetros estáticos que quebram no momento em que a volatilidade do mercado muda. O Auto Optimized Parabolic RSI resolve o problema de "obsolescência do indicador" recalculando continuamente a sua própria vantagem matemática, trazendo uma adaptação quantitativa de nível institucional diretamente para o seu terminal MT5. A Vantagem Principal: Otimização 3D em Memória Personaliz
PZ 123 Pattern
PZ TRADING SLU
1 (1)
O 123 Pattern é um dos padrões de gráficos mais populares, poderosos e flexíveis. O padrão é composto por três pontos de preço: fundo, pico ou vale e retração de Fibonacci entre 38,2% e 71,8%. Um padrão é considerado válido quando as quebras de preços além do último pico ou vale, momento em que o indicador traça uma flecha, sobe um alerta, e o comércio pode ser colocado. [ Guia de instalação | Guia de atualização | Solução de problemas | FAQ | Todos os produtos ] Sinais de negociação claros C
Market Makers
Mohamed Hassan
5 (4)
After purchase, contact me privately to receive 1 month of free testing with EA Forex Proton! This advanced MT4 trading robot automatically executes signals from any MT4 indicator, including Market Makers. The latest version also includes AI integration, allowing each trade signal to be analyzed using Artificial Intelligence. Live Signal with EA Forex Proton: Click here Market Makers is a powerful price action trading system designed to identify high-probability Buy and Sell opportunities based
Mais do autor
Angulation indicator
Bohdan Kasyanenko
4 (1)
The indicator draws angulation lines on a chart. These lines can help make decision on whether to enter the market or stay out of it. It is used to filter the signal "The First Wise Man" described in Bill Williams' strategy. Angulation in this indicator is displayed for any bar that is formed after Alligator's mouth is crossed (not only for reversal). Settings: Show angulation lines . Show info - show additional details (angulation degree, calculation points, number of bars). Minimal angle to fi
FREE
Wise Men Indicator demo
Bohdan Kasyanenko
3 (2)
The indicator displays signals according to the strategy of Bill Williams on the chart. Demo version of the indicator has the same features as the paid, except that it can work only on a demo account . Signal "First Wise Man" is formed when there is a divergent bar with angulation.  Bullish divergent bar - with lower minimum and closing price in the upper half. Bearish divergent bar - higher maximum and the closing price at the bottom half. Angulation is formed when all three lines of Alligator
FREE
The indicator displays signals according to the strategy of Bill Williams on a chart: 1. Signal "First Wise Man" is formed when there is a divergent bar with angulation. A bullish divergent bar has a lower minimum and the closing price in its upper half. A bearish divergent bar has a higher maximum and the closing price at the bottom half. Angulation is formed when all three lines of Alligator are intertwined, and the price has gone up significantly(or downwards). A valid bullish/bearish diver
Indicator displays signals of the Awesome Oscillator on the chart according to the strategy of Bill Williams: Signal "Saucer" - is the only signal to buy (sell), which is formed when the Awesome Oscillator histogram is above (below) the zero line. A "Saucer" is formed when the histogram changes its direction from descending to ascending (buy signal) or from ascending to descending (sell signal). In this case all the columns AO histogram should be above the zero line (for a buy signal) or below
Exchange Time
Bohdan Kasyanenko
Trading volume and volatility change for different currency pairs, depending on the movement of the clock hands. You will be able to trade more efficiently if you know which currency pairs are at the center of attention at one time or another. Timing plays a very big role when trading currencies. The indicator shows the trading sessions of the largest exchanges in the world. The operating time is displayed in the form of a countdown before the opening time and the closing time according to UTC (
BW Alligator
Bohdan Kasyanenko
An improved version of the classic Alligator indicator by Bill Williams. Description The Alligator technical indicator is a combination of moving averages (balance lines). Blue line (Alligator Jaw) is a 13-period smoothed moving average, shifted by 8 bars into the future; Red line (Alligator Teeth) is an 8-period smoothed moving average, shifted by 5 bars into the future; Green line (Alligator Lips) is a 5-period smoothed moving average, shifted by 3 bars into the future; Purple line (Fast Gato
Filtro:
Sem comentários
Responder ao comentário