ACI Moving Average

4

Tired of adjusting the indicator settings losing precious time? Tired of the uncertainty regarding their efficiency? Afraid of the uncertainty in their profitability? Then the indicator ACI (automatically calibrateable indicator) is designed exactly for you. Launching it, you can easily solve these three issues just performing the simplest action: clicking a single Calibrate button. To achieve the highest efficiency, you should perform another additional action: move the power slider to the maximum.

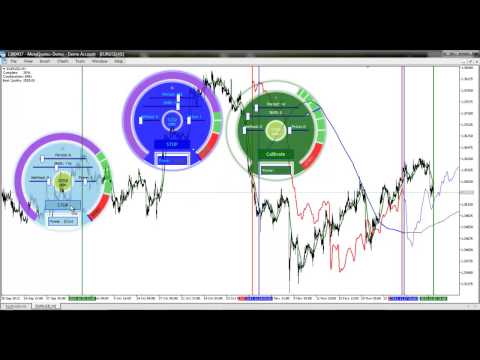
ACI will save you a lot of time that can be spent on more useful things, for example, vacation, but the effeciency will increase many times. In addition, thanks to the separate graphical interface, you can not only watch but also easily change the settings of the indicator on the fly, with the ability to select calibration areas visually on the chart.


Indicator for Calibrating

Standard built-in Moving Average is used as a calibrated one. The calibrated properties are used:

  1. Averaging period for the calculation of the moving average. 
  2. Shift of the indicator relative to the price chart.
  3. Smoothing type:
    • Simple averaging.
    • Exponential averaging.
    • Smoothed averaging.
    • Linear-weighted averaging.
  4. The price used:
    • Close price.
    • Open price.
    • The maximum price for the period.
    • The minimum price for the period.
    • Median price.
    • Typical price.
    • Average price.

Standard input/output signals are used to calculate the quality (profitability):

If the closing price of the previous bar is higher than or equal to the value of the indicator on the same bar, the signal is considered as a buy one. Otherwise the signal will be considered as a sell one.


ACI

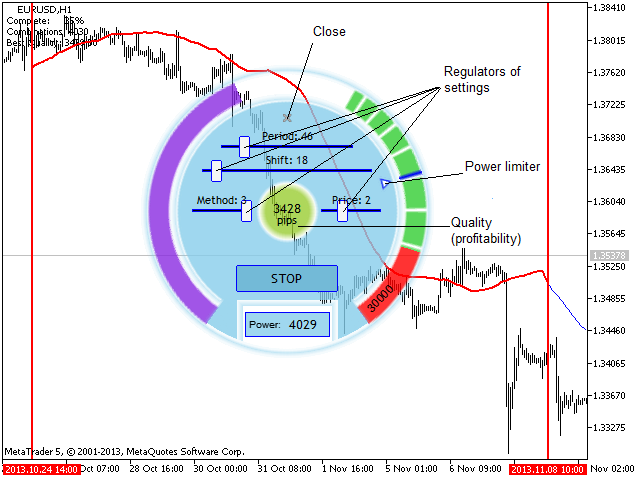
Automatic calibrator and the calibrated indicator can be controlled by ACI graphical interface which reduces the amount of actions you should perform to a minimum. To start the calibration process, click Calibrate button. When the calibration power reaches the specified mark, calibration stops, or else it can be stopped by another click.

Besides calibration, ACI also quickly calculates and displays the quality (profitability) of the selected parameters of the calibrated indicator at a specified time interval of a chart. The calculation is made by the method specified in the settings ("Criterion for calibration" parameter). The time interval on the chart can be changed using the levels. To do this, move the cursor to the upper or lower part of the level, highlight it with a click and start changing.

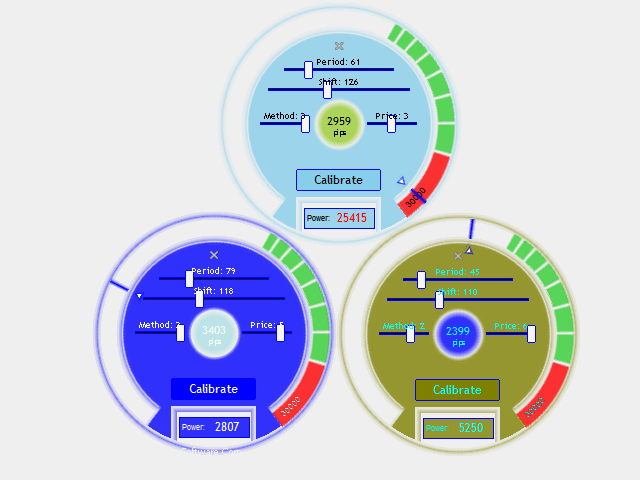
If necessary, you can increase or decrease the power (Power) calibrator moving the slider clockwise or counterclockwise, respectively. The dial's transparent area allows you to adjust from 0% to 20% of the total power, the green one - from 20% to 50% and the red one - from 50% to 100%. If necessary, you can work with multiple copies of this indicator on the same chart.


Settings

The indicator has multiple settings ranging from calibrated indicator parameters to ACI graphical interface ones.

Property name Description
Moving Average default settings
Default MA Period Averaging period for the calculation of the moving average, default.
Default MA Shift Shift of the indicator relative to the price chart, default.
Default MA Method Smoothing type, default.
Default MA Price The price used, default.
Power
Default Power Default power to be achieved during calibration.
Maximum Power  Maximum power.
Criterion
Criterion for Calibration  Calibration criterion. Method of calculating the quality (profitability).
If you select "Total_Net_Profit", then quality = total net profit (in pips) - the total net loss (in pips).
If you select "Total_Net_Profit_Total_Drawdown", then quality = total net profit (in pips) - the total net loss (in pips) - total for all signals maximum drawdown (in pips).
Only bar Close prices are used.
Selected interval of the chart 
Start bar  The bar for specifying the time interval beginning.
Finish bar  The bar for specifying the time interval end.
Moving Average regulator settings
Minimum MA Period Averaging period for the calculation of the moving average, minimum. 
Minimum MA Shift Shift of the indicator relative to the price chart, minimum.
Minimum MA Method Smoothing type, minimum.
Minimum MA Price The price used, minimum.
Maximum MA Period Averaging period for the calculation of the moving average, maximum.
Maximum MA Shift Shift of the indicator relative to the price chart, maximum.
Maximum MA Method Smoothing type, maximum.
Maximum MA Price The price used, maximum.
UI panel settings
Panel size Panel size (in pixels). 0 - automatic size calculation.
Panel Transparent Transparent level of panel. 0 - fully visible, 100 - fully hidden.
Panel color General panel color.
Font color of panel Panel fonts color.
Quality color  Quality (profitability) color.
Comentários 9
AdilsonGodin
84
AdilsonGodin 2022.12.10 19:03 
 

ficou showw de bola parabéns..

Produtos recomendados
RSI abcd
Francisco Gomes Da Silva
3 (1)
RSI ABCD Pattern Finder: Estratégia Técnica 1. Como o Indicador Funciona Combina o RSI clássico com detecção automática de padrões harmônicos ABCD . Componentes Principais RSI Padrão (período ajustável) Marcações de Topos e Fundos (setas) Padrões ABCD (linhas verdes/vermelhas) Filtros de Overbought (70) e Oversold (30) 2. Configuração no MT5 period = 14 ; // Período do RSI size = 4 ; // Tamanho máximo do padrão OverBought = 70 ; // Nível de sobrecompra OverSold = 30 ; // Nível de sobrevenda Filt
FREE
Risk5Percent is a custom indicator for MetaTrader 5 designed to help you manage your risk exposure precisely. By entering the desired risk percentage and the number of lots used, it calculates and displays the corresponding price level on the chart that represents your maximum anticipated loss (e.g., 5%), automatically considering contract and tick size for the selected instrument. Key Features: Custom settings for trade direction (long/short), risk percentage, and lot size. Automatic adjus
FREE
Important Lines
Terence Gronowski
4.87 (23)
This indicator displays Pivot-Lines, preday high and low, preday close and the minimum and maximum of the previous hour. You just have to put this single indicator to the chart to have all these important lines, no need to setup many single indicators. Why certain lines are important Preday high and low : These are watched by traders who trade in a daily chart. Very often, if price climbs over or falls under a preday low/high there is an acceleration in buying/selling. It is a breakout out of a
FREE
Follow The Line MT5
Oliver Gideon Amofa Appiah
4.6 (35)
This indicator obeys the popular maxim that: "THE TREND IS YOUR FRIEND" It paints a GREEN line for BUY and also paints a RED line for SELL. (you can change the colors). It gives alarms and alerts of all kinds. IT DOES NOT REPAINT and can be used for all currency pairs and timeframes. Yes, as easy and simple as that. Even a newbie can use it to make great and reliable trades. NB: For best results, get my other premium indicators for more powerful and reliable signals. Get them here: https://www.m
FREE
Descrição geral Este indicador é uma versão aprimorada do Canal Donchian clássico, enriquecida com funções práticas para o trading real. Além das três linhas padrão (máxima, mínima e linha do meio), o sistema detecta breakouts e os mostra visualmente com setas no gráfico, exibindo apenas a linha oposta à direção da tendência atual para uma leitura mais limpa. O indicador inclui: Sinais visuais : setas coloridas nos breakouts Notificações automáticas : alerta pop-up, push e e-mail Filtro RSI : pa
FREE
Indicator and Expert Adviser  EA Available in the comments section of this product. Download with Indicator must have indicator installed for EA to work. Mt5 indicator alerts for bollinger band and envelope extremes occurring at the same time. Buy signal alerts occur when A bullish candle has formed below both the lower bollinger band and the lower envelope  Bar must open and close below both these indicators. Sell signal occur when A bear bar is formed above the upper bollinger band and upper
FREE
Indicador Heiken Ashi MT5 Eleve sua análise de mercado com o Indicador Heiken Ashi MT5. Esta poderosa ferramenta transforma os dados de preços padrão em velas mais suaves, focadas em tendências, facilitando a identificação de tendências de mercado e potenciais pontos de reversão. Características principais: Identificação clara de tendências: Distingue visualmente entre tendências de alta e baixa com cores de velas distintas. Redução de ruído: Filtra as flutuações de preços, proporcionando uma v
FREE
Statistical Arbitrage Spread Generator for Cointegration [MT5] What is Pair Trading? Pair trading is a market-neutral strategy that looks to exploit the relative price movement between two correlated assets — instead of betting on the direction of the market. The idea? When two assets that usually move together diverge beyond a statistically significant threshold, one is likely mispriced. You sell the expensive one, buy the cheap one , and profit when they converge again. It’s a statistica
FREE
FlatBreakout MT5 (Free Version) Flat Range Detector and Breakout Panel for MT5 — GBPUSD Only FlatBreakout MT5   is the free version of the professional FlatBreakoutPro MT5 indicator, specially designed for flat (range) detection and breakout signals on the   GBPUSD   pair only. Perfect for traders who want to experience the unique fractal logic of FlatBreakout MT5 and test breakout signals on a live market without limitations. Who Is This Product For? For traders who prefer to trade breakout of
FREE
O indicador identifica quando ocorre uma divergência entre o preço e um indicador ou oscilador. Ele identifica divergências regulares e ocultas. Combinado com suas próprias regras e técnicas, este indicador permitirá que você crie (ou aprimore) seu próprio sistema poderoso. Recursos Pode detectar divergências para os seguintes osciladores / indicadores:       MACD, OsMA, Stochastics, RSI, CCI, RVI, Awesome, ADX, ATR, OBV, Índice composto, MFI e Momentum. Apenas um oscilador / indicador pode ser
FREE
VFI Quantum
Nikita Berdnikov
5 (1)
Introducing VFI (Volume Flow Indicator) – a trading indicator that analyzes the relationship between volume and price movement to identify key trading opportunities. The indicator displays the strength and direction of volume flow, providing clear signals about potential entry and exit points. Signals are formed based on zero line crossovers, crossovers between the VFI line and its exponential moving average (EMA), and when the indicator exits overbought and oversold zones. Attention! This stra
FREE
Coral Indi
Dinh Duong Luong
Coral trend is   a trend-following indicator that is widely popular among FOREX traders . It is usually used as a confluence with other indicators. It uses combinations of moving averages with complex smoothing formulas! It has two configurable parameters: Coefficient   - smoothing ratio (*) Applied price Calculation: Coral = (-0.064) * B6 + 0.672 * B5 - 2.352 * B4 + 2.744 * B3
FREE
Easy Correlations Indicator The Easy Correlations Indicator is designed to help traders analyze the relationship between two correlated instruments. By monitoring the distance between their Relative Strength Index (RSI) values, the indicator highlights situations where one instrument has moved significantly further than the other. This creates potential trading opportunities: Sell the stronger instrument (overstretched RSI) Buy the weaker instrument (lagging RSI) Because the positions are opened
FREE
MACD Enhanced
Nikita Berdnikov
5 (2)
Introducing the MACD  Enhanced – an advanced MACD (Moving Average Convergence Divergence) indicator that provides traders with extended capabilities for trend and momentum analysis in financial markets. The indicator uses the difference between the fast and slow exponential moving averages to determine momentum, direction, and strength of the trend, creating clear visual signals for potential entry and exit points. Attention! To achieve the best results, it is recommended to adapt the indicator
FREE
# DAILY SUPPORT AND RESISTANCE LEVELS - SEO OPTIMIZED DESCRIPTION ## SHORT DESCRIPTION (160 characters max) ``` Free pivot points indicator with daily support resistance levels for MT5. Perfect for intraday forex day trading and scalping strategies. ``` **Character count:** 159 **Keywords included:** pivot points, support, resistance, MT5, forex, day trading, scalping, free --- ## FULL DESCRIPTION (HTML Formatted for MQL5) ### Main Title **Daily Support and Resistance Levels - Free Pivot
FREE
Free automatic Fibonacci is an indicator that automatically plots a Fibonacci retracement based on the number of bars you select on the BarsToScan setting in the indicator. The Fibonacci is automatically updated in real time as new highest and lowest values appears amongst the selected bars. You can select which level values to be displayed in the indicator settings. You can also select the color of the levels thus enabling the trader to be able to attach the indicator several times with differe
FREE
High Low Open Close
Alexandre Borela
4.98 (42)
Se você gosta deste projeto, deixe uma revisão de 5 estrelas. Este indicador desenha os preços abertos, altos, baixos e finais para o especificado período e pode ser ajustado para um fuso horário específico. Estes são níveis importantes olhados por muitos institucional e profissional comerciantes e pode ser útil para você saber os lugares onde eles podem ser mais activa. Os períodos disponíveis são: Dia anterior. Semana anterior. Mês anterior. Quarto anterior. Ano anterior. Ou: Dia atual. Seman
FREE
Haven FVG Indicator
Maksim Tarutin
5 (7)
O indicador   Haven FVG   é uma ferramenta para analisar mercados que permite identificar áreas de ineficiência (Fair Value Gaps, FVG) no gráfico, fornecendo aos traders níveis-chave para a análise de preços e a tomada de decisões comerciais. Outros produtos ->  AQUI Principais características: Configurações individuais de cores: Cor para FVG de alta   (Bullish FVG Color). Cor para FVG de baixa   (Bearish FVG Color). Visualização flexível de FVG: Quantidade máxima de velas para buscar FVG. Exte
FREE
PZ Penta O MT5
PZ TRADING SLU
3.5 (4)
The Penta-O is a 6-point retracement harmonacci pattern which usually precedes big market movements. Penta-O patterns can expand and repaint quite a bit. To make things easier this indicator implements a twist: it waits for a donchian breakout in the right direction before signaling the trade. The end result is an otherwise repainting indicator with a very reliable trading signal. The donchian breakout period is entered as an input. [ Installation Guide | Update Guide | Troubleshooting | FAQ | A
FREE
Magic 7 Indicator
Marek Pawel Szczesny
Overview Magic 7 Indicator is a comprehensive MetaTrader 5 (MQL5) indicator that identifies seven different trading scenarios based on candlestick patterns and technical analysis. The indicator combines traditional price action patterns with modern concepts like Fair Value Gaps (FVG) to provide trading signals with precise entry points and stop loss levels. Features 7 Trading Scenarios : Each scenario identifies specific market conditions and trading opportunities Visual Signals : Clear buy/sell
FREE
This indicator is especially for the binary trading. Time frame is 1 minutes and exp time 5 or 3 minutes only. You must be use martingale 3 step. So you must put lots size is 10 % at most. You should use Mt2 trading platform to connect with my indicator to get more signal without human working. This indicator wining rate is over 80% but you may get 100% of profit by using martingale 3 step. You should use MT2 Trading Platform to connect meta trader platform and binary platform . You can get mt2
FREE
Easy GOLD MT5
Franck Martin
4.03 (40)
Easy Gold is the latest addition to the BotGPT family. It is surprising and very powerful. It is ideal for beginners due to its simplicity.  There is absolutely nothing to do, it's 100% automated, simply indicate the percentage of risk you want to take per trade and the EA is ready. Whatever your capital, the EA takes care of everything. Optimized on (XAUUSD).  Unleash all the power with the professional version (AGI Gold) and its connection to the neural network, available in my store. My othe
FREE
Volatility Break Signals Description: The  Volatility Break Signals  is an indicator designed to detect potential trend changes while partially filtering market noise. It uses an adaptive volatility measure based on the selected price (Close, Open, High, Low, etc.) and generates Buy and Sell signals when the price shows a reversal relative to the previous direction. How it works: Price Volatility Measurement The indicator calculates the absolute price changes from bar to bar ( |price - previous
FREE
Zigzag Price Arrows
Aiman Saeed Salem Dahbag
The Zigzag Price Arrow indicator is an enhanced version of the classic Zigzag indicator, combining the traditional zigzag pattern with advanced visual features. It not only identifies major market turning points but also provides clear trading signals through: • Directional arrows: Displays colored arrows (green for buy, magenta for sell) indicating potential trend directions. • Price labels: Shows the exact price values at each pivot point directly on the chart. • Improved visual clarity: Make
FREE
TK Rainbow
Nguyen Trung Khiem
5 (1)
Indicador TK - Rainbow Descrição: O indicador TK - Rainbow é uma ferramenta robusta para análise técnica, projetada para fornecer uma visão clara das tendências de mercado por meio de uma abordagem com várias linhas. Com 30 linhas calculadas em diferentes períodos, oferece uma análise extensa dos movimentos de preços. O indicador utiliza um esquema de duas cores para destacar tendências de alta e baixa, facilitando a interpretação das condições do mercado de relance. Principais Características:
FREE
PZ Three Drives MT5
PZ TRADING SLU
2.83 (6)
This indicator finds Three Drives patterns. The Three Drives pattern is a 6-point reversal pattern characterised by a series of higher highs or lower lows that complete at a 127% or 161.8% Fibonacci extension. It signals that the market is exhausted and a reversal can happen. [ Installation Guide | Update Guide | Troubleshooting | FAQ | All Products ] Customizable pattern sizes Customizable colors and sizes Customizable breakout periods Customizable 1-2-3 and 0-A-B ratios It implements visual/s
FREE
This indicator is a zero-lag indicator and displays  strength of trend change . True Trend  Oscillator Pro works best in combination with True Trend Moving Average Pro that displays exact trend as is. Oscillator value is exact price change in given direction of the trend. True Trend Moving Average Pro: https://www.mql5.com/en/market/product/103586 If you set PERIOD input parameter to 1 this indicator becomes a sharpshooter for binary options. Developers can use True Trend Oscillator in Exper
FREE
PZ Pivot Points MT5
PZ TRADING SLU
4.91 (22)
This indicator displays pivot points in the chart, including historical vales, and supports many calculation modes for Pivot Points and S/R levels. [ Installation Guide | Update Guide | Troubleshooting | FAQ | All Products ] It plots historical levels for backtesting purposes It allows you to select the reference timeframe It implements different Pivot Point calculation modes It implements different SR calculation modes It implements customizable colors and sizes Calculation Modes The indicato
FREE
ACI Bollinger Bands
Marat Sultanov
4 (3)
Tired of adjusting the indicator settings losing precious time? Tired of the uncertainty regarding their efficiency? Afraid of the uncertainty in their profitability? Then the indicator ACI (automatically calibrateable indicator) is designed exactly for you. Launching it, you can easily solve these three issues just performing the simplest action: clicking a single Calibrate button. To achieve the highest efficiency, you should perform another additional action: move the power slider to the maxi
FREE
Multi-timeframe trend indicator based on the ADX / ADXWilder indicator with Fibonacci levels The indicator shows trend areas using ADX or ADXWilder indicator data from multiple timeframes. The impulse mode of the indicator allows you to catch the beginning of a trend, and several "Screens" with different timeframes allow you to filter out market noise. Fibonacci levels are added to the price chart, which have flexible settings. How the indicator works: if PDI is greater than NDI, then   it`s
FREE
Os compradores deste produto também adquirem
Se você comprar este indicador, receberá meu Gerenciador de Operações Profissional + EA  GRATUITAMENTE. Primeiramente, vale ressaltar que este Sistema de Trading é um Indicador Não Repintado, Não Redesenho e Não Atrasado, o que o torna ideal tanto para o trading manual quanto para o automatizado. Curso online, manual e download de predefinições. O "Sistema de Trading Inteligente MT5" é uma solução completa de trading projetada para traders novos e experientes. Ele combina mais de 10 indicadores
Power Candles MT5
Daniel Stein
5 (2)
Power Candles – Sinais de entrada baseados em força para qualquer mercado Power Candles leva a análise de força comprovada da Stein Investments diretamente para o seu gráfico de preços. Em vez de reagir apenas ao preço, cada candle é colorido com base na força real do mercado, permitindo identificar instantaneamente a construção de momentum, aceleração de força e transições limpas de tendência. Uma única lógica para todos os mercados Power Candles funciona automaticamente em todos os símbolos de
Divergence Bomber
Ihor Otkydach
4.96 (77)
Cada comprador deste indicador recebe adicionalmente, e de forma gratuita: A ferramenta exclusiva "Bomber Utility", que acompanha automaticamente cada operação, define os níveis de Stop Loss e Take Profit e fecha operações de acordo com as regras da estratégia; Arquivos de configuração (set files) para ajustar o indicador em diferentes ativos; Set files para configurar o Bomber Utility nos modos: "Risco Mínimo", "Risco Balanceado" e "Estratégia de Espera"; Um vídeo tutorial passo a passo que aju
***Entry In The Zone and SMC Multi Timeframe é uma ferramenta de análise de mercado em tempo real desenvolvida com base nos Smart Money Concepts (SMC). Ela foi projetada para ajudar os traders a analisarem a estrutura do mercado de forma sistemática e obterem uma visão mais clara da direção geral do mercado. O sistema analisa automaticamente Pontos de Reversão, Zonas-Chave e a Estrutura de Mercado em múltiplos timeframes, enquanto exibe Points of Interest (POI), sinais sem repaint e níveis autom
Atomic Analyst MT5
Issam Kassas
4.19 (27)
Primeiramente, vale ressaltar que este Indicador de Negociação não repinta, não redesenha e não apresenta atrasos, tornando-o ideal tanto para negociação manual quanto automatizada. Manual do utilizador: configurações, entradas e estratégia. O Analista Atômico é um Indicador de Ação de Preço PA que utiliza a força e o momentum do preço para encontrar uma vantagem melhor no mercado. Equipado com filtros avançados que ajudam a remover ruídos e sinais falsos, e aumentam o potencial de negociação.
ARICoins
Temirlan Kdyrkhan
ARICoin is a powerful trading companion designed to generate high-probability entry signals with dynamic TP/SL/DP levels based on volatility. Built-in performance tracking shows win/loss stats, PP1/PP2 hits, and success rates all updated live. Key Features: Buy/Sell signals with adaptive volatility bands Real-time TP/SL/DP levels based on ATR Built-in MA Filter with optional ATR/StdDev volatility Performance stats panel (Success, Profit/Loss, PP1/PP2) Alerts via popup, sound, push, or email Cust
AriX
Temirlan Kdyrkhan
1 (4)
AriX Indicator for MT5 A powerful trend-following and signal-evaluation tool AriX is a custom MT5 indicator that combines Moving Averages and ATR-based risk/reward logic to generate clear buy/sell signals. It visualizes dynamic SL/TP levels, evaluates past trade outcomes, and displays win/loss statistics in a clean on-chart panel. Key features include: Buy/Sell signals based on MA crossovers ATR-based SL/TP1/TP2/TP3 levels with visual lines and labels Signal outcome tracking with real-time stat
Gold Sniper Scalper Pro
Ich Khiem Nguyen
3.29 (7)
Gold Sniper Scalper Pro - Sistema de Negociação de Ouro (XAU/USD) no MetaTrader 5 Para o negociador sério: Aborde a negociação de Ouro com uma metodologia estruturada e baseada em dados que combina múltiplos fatores de análise de mercado. Esta ferramenta foi construída para apoiar a sua análise de negociação de Ouro. Oportunidade de Preço Limitada Esta é uma chance de possuir o Gold Sniper Scalper Pro antes que o preço aumente. O preço do produto aumentará $50 após cada 10 compras subsequentes.
O Game Changer é um indicador de tendências revolucionário, concebido para ser utilizado em qualquer instrumento financeiro, transformando o seu metatrader num poderoso analisador de tendências. O indicador não se retraça nem apresenta atrasos. Funciona em qualquer período de tempo e auxilia na identificação de tendências, sinaliza potenciais reversões, atua como um mecanismo de trailing stop e fornece alertas em tempo real para respostas rápidas do mercado. Quer seja um profissional experiente
FX Power MT5 NG
Daniel Stein
5 (28)
FX Power: Analise a Força das Moedas para Decisões de Negociação Mais Inteligentes Visão Geral FX Power é a sua ferramenta essencial para compreender a força real das principais moedas e do ouro em quaisquer condições de mercado. Identificando moedas fortes para comprar e fracas para vender, FX Power simplifica as decisões de negociação e revela oportunidades de alta probabilidade. Quer você prefira seguir tendências ou antecipar reversões usando valores extremos de Delta, esta ferramenta adap
Azimuth Pro
Ottaviano De Cicco
5 (1)
PROMOÇÃO DE LANÇAMENTO O preço do Azimuth Pro está inicialmente definido em 299 $ para os primeiros 100 compradores. O preço final será de 499 $. A DIFERENÇA ENTRE ENTRADAS RETAIL E INSTITUCIONAIS NÃO É O INDICADOR — É A LOCALIZAÇÃO. A maioria dos traders entra em níveis de preço arbitrários, perseguindo momentum ou reagindo a sinais atrasados. As instituições esperam o preço atingir níveis estruturados onde oferta e demanda realmente mudam. Azimuth Pro mapeia esses níveis automaticamente: V
ARIScalping
Temirlan Kdyrkhan
ARIScalp is a powerful trading companion designed to generate high-probability entry signals with dynamic TP/SL/DP levels based on volatility. Built-in performance tracking shows win/loss stats, PP1/PP2 hits, and success rates all updated live. Key Features: Buy/Sell signals with adaptive volatility bands Real-time TP/SL/DP levels based on ATR Built-in MA Filter with optional ATR/StdDev volatility Performance stats panel (Success, Profit/Loss, PP1/PP2) Alerts via popup, sound, push, or email Cus
Trend Screener Pro MT5
STE S.S.COMPANY
4.84 (99)
Desbloqueie o poder da negociação de tendências com o indicador Trend Screener: sua solução definitiva de negociação de tendências, alimentada por lógica difusa e sistema de múltiplas moedas! Eleve sua negociação de tendências com o Trend Screener, o revolucionário indicador de tendências alimentado por lógica difusa. É um poderoso indicador de acompanhamento de tendências que combina mais de 13 ferramentas e recursos premium e 3 estratégias de negociação, tornando-o uma escolha versátil para to
Smart Stop Indicator – Precisão inteligente de stop-loss diretamente no seu gráfico Visão geral O Smart Stop Indicator é a solução ideal para traders que desejam definir seu stop-loss de forma clara e metódica, sem adivinhações ou decisões baseadas apenas na intuição. A ferramenta combina lógica clássica de price action (topos mais altos, fundos mais baixos) com um sistema moderno de detecção de rompimentos para identificar onde realmente deve estar o próximo nível lógico de stop. Seja em tend
FX Levels MT5
Daniel Stein
5 (12)
FX Levels: Suporte e Resistência com Precisão Excepcional para Todos os Mercados Visão Geral Rápida Procurando um meio confiável de identificar níveis de suporte e resistência em qualquer mercado—incluindo pares de moedas, índices, ações ou commodities? FX Levels combina o método “Lighthouse” tradicional com uma abordagem dinâmica de vanguarda, fornecendo uma precisão quase universal. Baseado em nossa experiência real com corretores e em atualizações automáticas diárias mais as de tempo real,
Trend indicator AI mt5
Ramil Minniakhmetov
5 (13)
O indicador Trend Ai é uma ótima ferramenta que irá melhorar a análise de mercado de um trader, combinando a identificação de tendências com pontos de entrada acionáveis e alertas de reversão. Este indicador permite que os usuários naveguem pelas complexidades do mercado forex com confiança e precisão Além dos sinais primários, o indicador Trend Ai identifica pontos de entrada secundários que surgem durante retrações ou retrações, permitindo que os comerciantes capitalizem as correções de preço
SynaptixQuant Dominance Matrix
Devie Arevalo Montemayor
5 (1)
SynaptixQuant Dominance Matrix: Institutional-Grade Market State Extraction Engineered for traders who require a data-driven view of market behaviour beyond surface-level indicators. The Synaptix Quant (SQ) Dominance Matrix is not a conventional currency strength display. Behind its intentionally streamlined interface runs a sophisticated analytical architecture designed to quantify market conditions with precision. Every output is generated through layered signal processing built to identify d
- Real price is 80$ - 45% Discount (It is 45$ now) Contact me for extra bonus   indicator, instruction or any questions! - Lifetime update free - Non-repaint - Related product: Gann Gold EA - I just sell my products in Elif Kaya Profile, any other websites are stolen old versions, So no any new updates or support. Advantages of  M1 Scalper Pro  Profitability: M1 Scalper Pro is highly profitable with a strict exit strategy. Frequent Opportunities: M1 Scalper Pro  takes advantage of numerous smal
IX Power MT5
Daniel Stein
4.92 (12)
IX Power: Descubra informações de mercado para índices, commodities, criptomoedas e forex Visão Geral IX Power é uma ferramenta versátil projetada para analisar a força de índices, commodities, criptomoedas e símbolos de forex. Enquanto o FX Power oferece a máxima precisão para pares de moedas ao utilizar dados de todos os pares disponíveis, o IX Power foca exclusivamente nos dados do mercado do símbolo subjacente. Isso torna o IX Power uma excelente escolha para mercados fora do forex e uma o
Grabber System MT5
Ihor Otkydach
4.81 (21)
Apresento a você um excelente indicador técnico: Grabber, que funciona como uma estratégia de trading “tudo incluído”, pronta para usar. Em um único código estão integradas ferramentas poderosas de análise técnica de mercado, sinais de entrada (setas), funções de alertas e notificações push. Cada comprador deste indicador também recebe gratuitamente: Utilitário Grabber: ferramenta para gerenciamento automático de ordens abertas Vídeo tutorial passo a passo: como instalar, configurar e operar com
Quantum TrendPulse
Bogdan Ion Puscasu
5 (20)
Apresentando   Quantum TrendPulse   , a ferramenta de negociação definitiva que combina o poder do   SuperTrend   ,   RSI   e   Stochastic   em um indicador abrangente para maximizar seu potencial de negociação. Projetado para traders que buscam precisão e eficiência, este indicador ajuda você a identificar tendências de mercado, mudanças de momentum e pontos de entrada e saída ideais com confiança. Principais características: Integração SuperTrend:   siga facilmente a tendência predominante do
ARIPoint
Temirlan Kdyrkhan
1 (1)
ARIPoint is a powerful trading companion designed to generate high-probability entry signals with dynamic TP/SL/DP levels based on volatility. Built-in performance tracking shows win/loss stats, PP1/PP2 hits, and success rates all updated live. Key Features: Buy/Sell signals with adaptive volatility bands Real-time TP/SL/DP levels based on ATR Built-in MA Filter with optional ATR/StdDev volatility Performance stats panel (Success, Profit/Loss, PP1/PP2) Alerts via popup, sound, push, or email Cu
Gartley Hunter Multi
Siarhei Vashchylka
5 (11)
Gartley Hunter Multi - An indicator for searching for harmonic patterns simultaneously on dozens of trading instruments and on all possible timeframes. Manual (Be sure to read before purchasing) | Version for MT4 Advantages 1. Patterns: Gartley, Butterfly, Shark, Crab. Bat, Alternate Bat, Deep Crab, Cypher 2. Simultaneous search for patterns on dozens of trading instruments and on all possible timeframes 3. Search for patterns of all possible sizes. From the smallest to the largest 4. All fou
Weis Wave with Alert MT5
Trade The Volume Waves Single Member P.C.
4.94 (17)
Rental/Lifetime Package Options and Privileges  Rent Monthly Six Months   Yearly/Lifetime Weis Wave with Speed with Alert+Speed Index x x x Manual  x x x Quick Set up Video x x x Blog x x x Lifetime Updates x x x Setup and Training Material x x Discord Access Channel "The SI traders"          x Rectangle Break Alert Tool      x How to trade with it:    http://www.tradethevolumewaves.com   ** If you purchase please contact me to setup your  : Training Room and  complete manual access.  Wei
SuperScalp Pro
Van Minh Nguyen
5 (1)
SuperScalp Pro – Sistema avançado de indicador de scalping com múltiplos filtros SuperScalp Pro é um sistema avançado de indicador de scalping que combina o clássico Supertrend com múltiplos filtros inteligentes de confirmação. O indicador opera de forma eficiente em todos os timeframes de M1 a H4 e é especialmente adequado para XAUUSD, BTCUSD e principais pares Forex. Pode ser usado como sistema independente ou integrado de forma flexível a estratégias de trading existentes. O indicador integra
Antes de tudo, vale ressaltar que esta Ferramenta de Negociação é um Indicador Não Repintante, Não Redesenhante e Não Atrasado, o que a torna ideal para negociação profissional. Curso online, manual do utilizador e demonstração. O Indicador de Conceitos de Ação de Preço Inteligente é uma ferramenta muito poderosa tanto para traders novos quanto experientes. Ele combina mais de 20 indicadores úteis em um único, combinando ideias avançadas de negociação como Análise do Trader do Círculo Interno
MTF Supply Demand Zones MT5
Georgios Kalomoiropoulos
5 (1)
Próxima geração de zonas automatizadas de oferta e demanda. Algoritmo novo e inovador que funciona em qualquer gráfico. Todas as zonas estão sendo criadas dinamicamente de acordo com a ação do preço do mercado. DOIS TIPOS DE ALERTAS --> 1) QUANDO O PREÇO ATINGE UMA ZONA 2) QUANDO UMA NOVA ZONA É FORMADA Você não recebe mais um indicador inútil. Você obtém uma estratégia de negociação completa com resultados comprovados.     Novas características:     Alertas quando o preço atinge a zona d
ACB Breakout Arrows MT5
KEENBASE SOFTWARE SOLUTIONS
5 (1)
O indicador ACB Breakout Arrows fornece um sinal de entrada crucial no mercado ao detectar um padrão especial de rompimento. O indicador escaneia constantemente o gráfico em busca de um momento de consolidação em uma direção e fornece o sinal preciso logo antes do movimento principal. Obtenha o scanner de múltiplos ativos e múltiplos períodos aqui - Scanner para ACB Breakout Arrows MT5 Principais recursos Níveis de Stop Loss e Take Profit são fornecidos pelo indicador. Acompanha um painel Scan
Trend Forecaster
Alexey Minkov
5 (7)
The Trend Forecaster indicator utilizes a unique proprietary algorithm to determine entry points for a breakout trading strategy. The indicator identifies price clusters, analyzes price movement near levels, and provides a signal when the price breaks through a level. The Trend Forecaster indicator is suitable for all financial assets, including currencies (Forex), metals, stocks, indices, and cryptocurrencies. You can also adjust the indicator to work on any time frames, although it is recommen
Trend Flow PRO
Aliaksandr Alferchyk
TREND FLOW PRO ajuda a identificar onde o mercado realmente muda de direção. O indicador destaca reversões de tendência e áreas onde os principais participantes do mercado voltam a entrar. As marcações BOS no gráfico representam mudanças reais de tendência e níveis-chave de timeframes superiores. Os dados do indicador não são redesenhados e permanecem no gráfico após o fechamento de cada candle. Principais elementos do indicador: BOS FLOW – ondas de tendência e mudanças reais de tendência. Repre
Mais do autor
Every indicator has its advantages and disadvantages. Trending ones show good signals during a trend, but lag during a flat. Flat ones thrive in the flat, but die off as soon as a trend comes. All this would not be a problem, if it was easy to predict when a flat changes to a trend and when a trend changes to a flat, but in practice it is an extremely serious task. What if you develop such an algorithm, which could eliminate an indicator's flaws and enhance its strengths? What if such an algori
The B150 model is a fully revised version of the Historical Memory indicator with a significantly improved algorithm. It also features a graphical interface what makes working with this perfect tool quick and convenient. Indicator-forecaster. Very useful as an assistant, acts as a key point to forecast the future price movement. The forecast is made using the method of searching the most similar part in the history (patter). The indicator is drawn as a line that shows the result of change of the
ACI Bollinger Bands
Marat Sultanov
4 (3)
Tired of adjusting the indicator settings losing precious time? Tired of the uncertainty regarding their efficiency? Afraid of the uncertainty in their profitability? Then the indicator ACI (automatically calibrateable indicator) is designed exactly for you. Launching it, you can easily solve these three issues just performing the simplest action: clicking a single Calibrate button. To achieve the highest efficiency, you should perform another additional action: move the power slider to the maxi
FREE
Historical Memory
Marat Sultanov
3.33 (3)
Indicator-forecaster. Muito útil como assistente, atua como um ponto-chave para prever o movimento do preço futuro. A previsão é feito usando o método de busca a parte mais semelhante no histórico (padrão). O indicador é desenhada como uma linha que mostra o resultado da alteração do preço de fechamento das barras. A profundidade do histórico, o número de barras na previsão, o tamanho e a qualidade alinhador de busca pode ser ajustado através das definições do indicador. Configurações: PATTERN_
FREE
The B150 model is a fully revised version of the Historical Memory indicator with an improved search algorithm. It also features a graphical interface what makes working with this tool quick and convenient. Indicator-forecaster. Very useful as an assistant, acts as a key point to forecast the future price movement. The forecast is made using the method of searching the most similar part in the history (patter). The indicator is drawn as a line that shows the result of change of the close price o
Do you want to see the future lines of the ZigZag indicator? This indicator will help you do that because the indicator model is based on two indicators:   Historical Memory   and ZigZag. So it can forecast the ZigZag lines. Very useful as an assistant, acts as a key point to forecast the future price movement. The forecast is made using the method of searching the most similar part in the history (pattern)   to the current one.  The indicator is drawn as a line that shows the result of change o
Deep Moving Average
Marat Sultanov
5 (1)
Every indicator has its advantages and disadvantages. Trending ones show good signals during a trend, but lag during a flat. Flat ones thrive in the flat, but die off as soon as a trend comes. All this would not be a problem, if it was easy to predict when a flat changes to a trend and when a trend changes to a flat, but in practice it is an extremely serious task. What if you develop such an algorithm, which could eliminate an indicator's flaws and enhance its strengths? What if such an algori
Every indicator has its advantages and disadvantages. Trending ones show good signals during a trend, but lag during a flat. Flat ones thrive in the flat, but die off as soon as a trend comes. All this would not be a problem, if it was easy to predict when a flat changes to a trend and when a trend changes to a flat, but in practice it is an extremely serious task. What if you develop such an algorithm, which could eliminate an indicator's flaws and enhance its strengths? What if such an algorit
Do you want to see the future lines of the ZigZag indicator? This indicator will help you do that because the indicator model is based on two indicators: Historical Memory and ZigZag. So it can forecast the ZigZag lines. Very useful as an assistant, acts as a key point to forecast the future price movement. The forecast is made using the method of searching the most similar part in the history (pattern) to the current one.  The indicator is drawn as a line that shows the result of change of the
Every indicator has its advantages and disadvantages. Trending ones show good signals during a trend, but lag during a flat. Flat ones thrive in the flat, but die off as soon as a trend comes. All this would not be a problem, if it was easy to predict when a flat changes to a trend and when a trend changes to a flat, but in practice it is an extremely serious task. What if you develop such an algorithm, which could eliminate an indicator's flaws and enhance its strengths? What if such an algorit
This indicator identifies the global trend and has a powerful algorithm for filtering out any type of noise that can interfere with trend direction identification. A special filter shows areas of sideways trend, consolidation or flat, which allows you to avoid any uncertainties in the market movement vision and gives a clear understanding of the global trend movement. This indicator has no analogues and gives it unique advantages in the analysis of price movements and determination of the dire
Do you want to know how an economic event will impact price? What will happen to price after the news? How has an economic news affected price in the past? This indicator can help you with that. Do you like technical analysis? Do you enjoy studying the history to predict the future? But what do you think could be more important than technical analysis, what could improve technical analysis? Of course, it's fundamental analysis! After all, economic events directly impact the market, and therefo
Do you want to know how an economic event will impact price? What will happen to price after the news? How has an economic news affected price in the past? This indicator can help you with that. Do you like technical analysis? Do you enjoy studying the tick history to predict the future? But what do you think could be more important than technical analysis, what could improve technical analysis? Of course, it's fundamental analysis! After all, economic events directly impact the market, and th
Filtro:
AdilsonGodin
84
AdilsonGodin 2022.12.10 19:03 
 

ficou showw de bola parabéns..

Valentin Butorin
4141
Valentin Butorin 2020.10.01 17:29 
 

O usuário não deixou nenhum comentário para sua avaliação

[Excluído] 2019.01.14 08:08 
 

O usuário não deixou nenhum comentário para sua avaliação

Gennadiy Voltornist
11909
Gennadiy Voltornist 2018.01.13 20:28 
 

O usuário não deixou nenhum comentário para sua avaliação

Daniel Andrejczuk
5597
Daniel Andrejczuk 2017.11.09 14:30 
 

O usuário não deixou nenhum comentário para sua avaliação

Nork
6190
Nork 2017.07.21 17:32 
 

O usuário não deixou nenhum comentário para sua avaliação

Rodrigo da Silva Boa
7137
Rodrigo da Silva Boa 2016.03.12 21:44 
 

O usuário não deixou nenhum comentário para sua avaliação

[Excluído] 2014.05.16 07:43 
 

O usuário não deixou nenhum comentário para sua avaliação

Vadim Strelkov
7710
Vadim Strelkov 2014.03.24 12:25 
 

O usuário não deixou nenhum comentário para sua avaliação

Responder ao comentário