UT Bot Trend Signal ATR Trailing Stop Multi Filter

UT Bot Trend Signal ATR Trailing Stop Multi Filter

UT Bot KU v1.00 - Technical Overview and Operational Manual

1. General Overview
UT Bot KU v1.00 is a technical analysis custom indicator designed for the MetaTrader 4 platform. The software combines an Average True Range (ATR) dynamic trailing stop algorithm with real-time candlestick color coding, directional entry arrows, automated risk-to-reward target level projections, and a modular 15-filter confirmation suite. The primary objective of this indicator is to assist traders in identifying trend direction, filtering market noise during consolidation phases, and visualizing structured Stop Loss (SL) and Take Profit (TP) zones directly on the price chart. This tool functions strictly as a visual analytical and notification aid and does not execute automated trades. Every component of the indicator is engineered for transparent technical reading, allowing traders to evaluate volatility-adjusted price boundaries alongside optional multi-indicator confluence without cluttering the workspace.

2. Operating Principle and Signal Logic
The core calculation engine evaluates price volatility using the Average True Range (ATR) multiplied by a user-defined sensitivity factor to establish a dynamic trailing stop threshold. As price advances or declines, the trailing baseline ratchets in the direction of the prevailing trend and holds steady during minor counter-trend pullbacks until a decisive closing price breach occurs.
- Trend State and Candlestick Coloring: When the closing price remains above the calculated ATR trailing stop line, the market state is classified as bullish, rendering candlestick bodies and wicks in aqua alongside a rising trailing line. When the closing price falls below the trailing stop line, the state shifts to bearish, coloring candlesticks in red with a descending trailing line. During initial historical bar warm-up prior to directional establishment, the trailing line displays in blue.
- Buy Signal Generation: A preliminary bullish signal occurs when the closing price crosses from below to above the ATR trailing stop line after having previously tracked beneath it. If any optional confirmation filters are enabled in the input settings, all active filter conditions must evaluate as valid simultaneously on the signal bar before the upward Buy arrow is plotted below the candle low.
- Sell Signal Generation: A preliminary bearish signal occurs when the closing price crosses from above to below the ATR trailing stop line after having previously tracked above it. All enabled filter modules must simultaneously confirm bearish alignment before the downward Sell arrow is plotted above the candle high.
- Exit and Reversal Guidance: Traders may manage open positions using the plotted 1R, 2R, and 3R ATR target lines, trailing stops along the dynamic trailing line, or exiting upon the appearance of an opposing directional signal. Partial profit-taking strategies can utilize TP1 and TP2 while leaving remaining exposure to trail toward TP3 or an opposite crossover.
- Repainting Behavior and Bar Calculation: Signal stability is controlled by the WaitForCandleClose parameter. When set to true (default), signals are evaluated and confirmed exclusively on closed historical bars (Bar 1). Confirmed arrows on closed bars remain fixed and do not recalculate, shift, or disappear. When set to false, signals are evaluated dynamically on the active forming bar (Bar 0) and may fluctuate until the current candle closes. Note that if the optional Fibonacci Retracement filter is enabled, its internal swing detection relies on ZigZag parameters which require subsequent price bars to confirm swing extremes.

3. Key Technical Features
- Dynamic ATR Trailing Stop Engine: Continuously adapts support and resistance trailing thresholds to current instrument volatility using configurable ATR periods and multipliers, responding rapidly to volatility expansions while maintaining steady trailing levels during directional runs.
- Dual-Buffer Candlestick Visualization: Overlays bullish and bearish colors directly onto chart wicks and bodies using histogram buffer pairs for immediate visual trend recognition without requiring separate sub-windows.
- Automated ATR Risk-to-Reward Target Projection: Automatically draws horizontal entry, Stop Loss, TP1 (1:1 RR), TP2 (2:1 RR), and TP3 (3:1 RR) lines with price labels for the most recent valid signal, updating automatically when a newer confirmed signal occurs.
- Modular 15-Filter Confirmation Framework: Includes fifteen independent technical filters (RSI Cross, ADX Trend, Single MA, Ichimoku Senkou Span B, RSI 75 Trend, Double MA, Awesome Oscillator, Parabolic SAR, Heiken Ashi, CCI Trend, CCI Overbought/Oversold, RVI Trend and Signal, MACD Histogram and Zero Line, Support/Resistance Zones, Fibonacci Retracement, and Supertrend) that can be combined in any configuration to match trend-following, momentum-breakout, or pullback trading methodologies.
- Multi-Channel Alert System: Supports MetaTrader terminal pop-up alerts, custom WAV audio alerts, and mobile push notifications containing symbol, timeframe, direction, and calculated Entry, SL, TP1, TP2, and TP3 price levels.
- Non-Repainting Closed-Bar Mode: Ensures historical signal integrity and reliable chart review when operating in confirmed candle close mode.

4. Trading Recommendations, Workflow, and Operational Specifications
- Recommended Instruments: Suitable for major and minor Forex currency pairs (such as EURUSD, GBPUSD, USDJPY, AUDUSD, USDCAD, EURJPY), precious metals (XAUUSD, XAGUSD), stock indices (US30, NAS100, GER40), and liquid CFD instruments. Always evaluate broker spread characteristics and tick size before deploying on exotic pairs or low-liquidity sessions.
- Supported Timeframes: Compatible with all standard MT4 timeframes (M1 to MN1). M5 and M15 are suited for intraday momentum trading during active London and New York sessions, while H1 and H4 provide broader trend structures with fewer consolidation signals.
- Practical Setup Workflow: Start by attaching the indicator with default core settings (keyvalue = 1.0, atrperiod = 1) to observe raw volatility shifts on your chosen instrument. Adjust keyvalue upward (for example to 1.5 or 2.0) on noisy instruments to reduce whipsaws, then selectively enable one or two complementary filters—such as a higher-period Moving Average or ADX filter—to align entries with broader market structure.
- Account and Execution Environment: Compatible with both Hedging and Netting account types across Standard, Raw, and ECN broker feeds. Because this is a visual analytical indicator rather than an order-execution robot, low-latency VPS hosting is not mandatory unless continuous 24/5 mobile push notifications are required while your local workstation is offline.
- Computational Resource Management: By default, all 15 secondary filters are disabled to maintain minimal CPU and memory overhead. Enabling multiple complex filters simultaneously (such as Supertrend, Heiken Ashi, Support/Resistance, and ZigZag Fibonacci) increases per-tick calculation load during historical initialization. If running the indicator across numerous open charts simultaneously on modest hardware, keep unused filters disabled and limit the maximum bars in chart settings under MetaTrader Tools > Options > Charts.

5. Graphical User Interface (GUI) Elements
- Aqua Candlesticks and Aqua Trailing Line: Indicate bullish market structure where closing prices hold above the ATR trailing stop threshold.
- Red Candlesticks and Red Trailing Line: Indicate bearish market structure where closing prices hold below the ATR trailing stop threshold.
- Blue Trailing Line: Indicates a neutral initialization state prior to directional trend confirmation on the earliest historical bars.
- Aqua Upward Arrow (Code 233): Plotted below the candle low (offset by 15 points) to mark a confirmed Buy signal that has passed all enabled filter checks.
- Red Downward Arrow (Code 234): Plotted above the candle high (offset by 15 points) to mark a confirmed Sell signal that has passed all enabled filter checks.
- Target Projection Lines and Labels: Displays a solid gold Entry line, dashed red SL line, dashed lime green TP1 (1R) line, dashed medium sea green TP2 (2R) line, and dashed dodger blue TP3 (3R) line anchored from the latest signal bar to the right margin, accompanied by exact price labels formatted to the symbol digits.

6. Complete Input Parameters Documentation
Below is the complete reference of all configurable parameters available in the MetaTrader 4 Inputs tab:

Section 1: UT Bot Core Settings
- InpCoreGroup (Default: "=== 1. UT BOT CORE SETTINGS ==="): Visual section header separating core algorithm parameters in the inputs window.
- keyvalue (Default: 1.0): Sensitivity multiplier applied to the ATR value to determine trailing stop distance. Higher values widen the stop distance and reduce signal frequency; lower values increase sensitivity to short-term price swings.
- atrperiod (Default: 1): Number of bars used to calculate the Average True Range for the core trailing stop engine.

Section 2: Signal Execution Settings
- InpExecGroup (Default: "=== 2. SIGNAL EXECUTION SETTINGS ==="): Visual section header for signal timing controls.
- WaitForCandleClose (Default: true): Determines signal confirmation timing. When true, signals trigger only after the candle closes (non-repainting). When false, signals evaluate dynamically on the current open bar.

Section 3: Alert and Notifications
- InpAlertGroup (Default: "=== 3. ALERT & NOTIFICATIONS ==="): Visual section header for notification settings.
- Use_Alert_Popup (Default: true): Enables or disables the standard MetaTrader desktop pop-up alert window upon signal confirmation.
- Use_Alert_Sound (Default: true): Enables or disables audible WAV sound alerts when a signal occurs.
- Use_Push_Notification (Default: true): Enables or disables sending formatted signal messages to the MetaTrader mobile app via MetaQuotes ID.
- Use_Sound_Only (Default: false): When set to true, suppresses desktop pop-up windows while continuing to play audio alerts.
- Sound_File_Buy (Default: "alert.wav"): Filename of the WAV audio file located in the MetaTrader Sounds directory played for Buy signals.
- Sound_File_Sell (Default: "alert2.wav"): Filename of the WAV audio file located in the MetaTrader Sounds directory played for Sell signals.

Section 4: ATR and Target Levels (SL/TP)
- InpTargetGroup (Default: "=== 4. ATR & TARGET LEVELS (SL/TP) ==="): Visual section header for risk-to-reward projection settings.
- Show_SLTP_Lines (Default: true): Toggles the display of horizontal Entry, Stop Loss, and Take Profit lines and price labels on the chart.
- Target_ATR_Period (Default: 7): Lookback period in bars used to compute the ATR baseline for Stop Loss and Take Profit distances.
- Target_ATR_Multiplier (Default: 1.5): Multiplier applied to Target_ATR_Period to establish the 1R Stop Loss distance from the entry price.
- Right_Extension_Bars (Default: 1): Number of bars to extend target lines and text labels to the right of the current active bar (Bar 0).
- Label_Font_Size (Default: 8): Font size in points for the Entry, SL, TP1, TP2, and TP3 text labels.
- Color_Entry_Line (Default: clrGold): Color of the horizontal entry price line and label.
- Color_SL_Line (Default: clrRed): Color of the Stop Loss projection line and label.
- Color_TP1_Line (Default: clrLimeGreen): Color of the first Take Profit (1:1 risk-to-reward) line and label.
- Color_TP2_Line (Default: clrMediumSeaGreen): Color of the second Take Profit (2:1 risk-to-reward) line and label.
- Color_TP3_Line (Default: clrDodgerBlue): Color of the third Take Profit (3:1 risk-to-reward) line and label.
- Target_Line_Style (Default: STYLE_DASH): Line drawing style (solid, dash, dot) applied to SL and TP projection lines.
- Line_Width (Default: 1): Pixel thickness of the projected Entry, SL, and TP horizontal lines.

Section 5: Filter 1 - RSI Cross Filter
- InpFilter1 (Default: "=== 1. RSI CROSS FILTER ==="): Visual header for the Relative Strength Index crossover filter.
- Use_RSI_Cross_Filter (Default: false): Enables filtering signals based on RSI crossing out of oversold or overbought zones.
- RSI_Length (Default: 14): Averaging period in bars for the RSI calculation.
- RSI_Price_Source (Default: PRICE_CLOSE): Applied price series used for RSI computation.
- RSI_Oversold (Default: 30.0): Lower threshold level that RSI must cross upward to validate a Buy signal.
- RSI_Overbought (Default: 70.0): Upper threshold level that RSI must cross downward to validate a Sell signal.

Section 6: Filter 2 - ADX Trend Strength Filter
- InpFilter2 (Default: "=== 2. ADX FILTER ==="): Visual header for the Average Directional Index filter.
- Use_ADX_Filter (Default: false): Enables filtering out signals during low-momentum or ranging markets using ADX.
- ADX_Period (Default: 10): Calculation period in bars for the ADX indicator.
- ADX_Min_Level (Default: 20.0): Minimum ADX main line value required to permit Buy or Sell signals.

Section 7: Filter 3 - Single Moving Average Filter
- InpFilter3 (Default: "=== 3. SINGLE MA FILTER ==="): Visual header for the single Moving Average trend filter.
- Use_MA_Filter (Default: false): Enables price-versus-Moving-Average directional filtering (Buy above MA, Sell below MA).
- MA_Period (Default: 50): Number of bars used for the Moving Average calculation.
- MA_Method (Default: MODE_SMA): Smoothing algorithm (Simple, Exponential, Smoothed, Linear Weighted).
- MA_Shift (Default: 0): Horizontal bar shift applied to the Moving Average.

Section 8: Filter 4 - Ichimoku Senkou Span B Filter
- InpFilter4 (Default: "=== 4. ICHIMOKU SENKOU SPAN B FILTER ==="): Visual header for the Ichimoku Kinko Hyo cloud baseline filter.
- Use_Ichimoku_Filter (Default: false): Enables filtering signals relative to the Ichimoku Senkou Span B line (Buy above Span B, Sell below Span B).
- Ichimoku_Tenkan (Default: 9): Tenkan-sen (Conversion Line) calculation period in bars.
- Ichimoku_Kijun (Default: 26): Kijun-sen (Base Line) calculation period in bars.
- Ichimoku_SenkouB (Default: 52): Senkou Span B (Leading Span B) calculation period in bars.

Section 9: Filter 5 - Long-Period RSI Trend Filter
- InpFilter5 (Default: "=== 5. RSI 75 FILTER ==="): Visual header for the macro RSI midline filter.
- Use_RSI75_Filter (Default: false): Enables macro momentum filtering where Buy requires RSI above 50.0 and Sell requires RSI below 50.0.
- RSI_Filter_Period (Default: 75): Lookback period in bars for the macro RSI trend filter.

Section 10: Filter 6 - Double Moving Average Crossover Filter
- InpFilter6 (Default: "=== 6. DOUBLE MA FILTER ==="): Visual header for the dual Moving Average alignment filter.
- Use_DoubleMA_Filter (Default: false): Enables trend alignment filtering requiring fast MA_A to be above slow MA_B for Buy, and below for Sell.
- MA_A_Period (Default: 30): Calculation period in bars for the fast Moving Average (MA A).
- MA_A_Method (Default: MODE_EMA): Smoothing method for MA A.
- MA_A_Applied (Default: PRICE_CLOSE): Applied price type for MA A.
- MA_A_Shift (Default: 0): Bar shift offset for MA A.
- MA_B_Period (Default: 140): Calculation period in bars for the slow Moving Average (MA B).
- MA_B_Method (Default: MODE_EMA): Smoothing method for MA B.
- MA_B_Applied (Default: PRICE_CLOSE): Applied price type for MA B.
- MA_B_Shift (Default: 0): Bar shift offset for MA B.

Section 11: Filter 7 - Awesome Oscillator Filter
- InpFilter7 (Default: "=== 7. AWESOME OSCILLATOR FILTER ==="): Visual header for Bill Williams Awesome Oscillator (AO) filters.
- Use_AO_Filter (Default: false): Master switch enabling Awesome Oscillator momentum validation.
- Use_AO_Volume_Filter (Default: false): Requires AO value to exceed minimum magnitude thresholds (AO_Buy_Min or AO_Sell_Max).
- AO_Buy_Min (Default: 4.0): Minimum positive AO histogram value required for Buy validation when volume filter is active.
- AO_Sell_Max (Default: -4.0): Maximum negative AO histogram value required for Sell validation when volume filter is active.
- Use_AO_Color_Filter (Default: false): Requires AO histogram slope to be rising (green) for Buy and falling (red) for Sell.
- Use_AO_Zero_Filter (Default: false): Requires AO histogram to be above 0.0 and rising for Buy, or below 0.0 and falling for Sell.

Section 12: Filter 8 - Parabolic SAR Filter
- InpFilter8 (Default: "=== 8. PARABOLIC SAR FILTER ==="): Visual header for the Parabolic Stop and Reverse filter.
- Use_SAR_Filter (Default: false): Enables trend confirmation requiring price to be above Parabolic SAR dots for Buy and below for Sell.
- SAR_Step (Default: 0.02): Acceleration factor step increment for Parabolic SAR.
- SAR_Maximum (Default: 0.2): Maximum acceleration factor limit for Parabolic SAR.

Section 13: Filter 9 - Heiken Ashi Candle Filter
- InpFilter9 (Default: "=== 9. HEIKEN ASHI FILTER ==="): Visual header for smoothed Heiken Ashi candle direction filtering.
- Use_HeikenAshi_Filter (Default: false): Enables filtering requiring a bullish Heiken Ashi candle (HA Close > HA Open) for Buy and bearish (HA Close < HA Open) for Sell.

Section 14: Filter 10 - CCI Trend Filter
- InpFilter10 (Default: "=== 10. CCI TREND FILTER ==="): Visual header for Commodity Channel Index zero-line filtering.
- Use_CCI_Filter (Default: false): Enables filtering requiring CCI to be above 0.0 for Buy and below 0.0 for Sell.
- CCI_Period (Default: 50): Lookback period in bars for the CCI trend calculation.
- CCI_Applied (Default: PRICE_CLOSE): Applied price source for the CCI trend filter.

Section 15: Filter 11 - CCI Overbought and Oversold Filter
- InpFilter11 (Default: "=== 11. CCI OB & OS FILTER ==="): Visual header for CCI extreme threshold filtering.
- Use_CCI_OBOS_Filter (Default: false): Enables momentum breakout filtering using upper and lower CCI levels.
- CCI_OBOS_Period (Default: 14): Calculation period in bars for the CCI OB/OS oscillator.
- CCI_OBOS_Applied (Default: PRICE_CLOSE): Applied price series for the CCI OB/OS filter.
- CCI_Overbought (Default: 100.0): Upper CCI level threshold used in signal validation.
- CCI_Oversold (Default: -100.0): Lower CCI level threshold used in signal validation.

Section 16: Filter 12 - Relative Vigor Index (RVI) Filters
- InpFilter12 (Default: "=== 12. RVI FILTERS ==="): Visual header for RVI zero-line and signal-line filters.
- Use_RVI_Filter (Default: false): Enables filtering requiring the main RVI line to be above 0.0 for Buy and below 0.0 for Sell.
- RVI_Period (Default: 75): Calculation period in bars for the main RVI trend filter.
- Use_RVI_Signal_Filter (Default: false): Enables filtering requiring the RVI main line to be above the RVI signal line for Buy and below for Sell.
- RVI_Signal_Period (Default: 20): Calculation period in bars for the RVI signal crossover filter.

Section 17: Filter 13 - MACD Histogram and Zero-Line Filters
- InpFilter13 (Default: "=== 13. MACD FILTERS ==="): Visual header for Moving Average Convergence Divergence filters.
- Use_MACD_Filter (Default: false): Enables filtering based on MACD histogram polarity (Main > Signal for Buy, Main < Signal for Sell).
- MACD_FastEMA (Default: 12): Fast Exponential Moving Average period in bars.
- MACD_SlowEMA (Default: 26): Slow Exponential Moving Average period in bars.
- MACD_SignalSMA (Default: 9): Signal line Simple Moving Average period in bars.
- MACD_Applied (Default: PRICE_CLOSE): Applied price source for MACD calculation.
- Use_MACD_Zero_Filter (Default: false): Enables filtering requiring the MACD main line to be above 0.0 for Buy and below 0.0 for Sell.

Section 18: Filter 14 - Support, Resistance, and Fibonacci Filters
- InpFilter14 (Default: "=== 14. SR & FIBONACCI FILTERS ==="): Visual header for price structure and swing retracement filters.
- Use_SR_Filter (Default: false): Enables proximity filtering requiring Buy signals to occur near recent support lows and Sell signals near recent resistance highs.
- SR_Period (Default: 50): Lookback window in bars used to identify local support and resistance extremes.
- SR_Zone_Points (Default: 80): Tolerance zone width measured in broker points around detected support or resistance levels.
- Use_Fib_Filter (Default: false): Enables filtering requiring price to interact with a Fibonacci retracement zone derived from recent ZigZag swings.
- Fib_Level_1 (Default: 0.382): First Fibonacci retracement ratio boundary (38.2%).
- Fib_Level_2 (Default: 0.618): Second Fibonacci retracement ratio boundary (61.8%).
- ZigZag_Depth (Default: 12): Minimum number of bars required between swing highs and lows for ZigZag detection.
- ZigZag_Deviation (Default: 5): Minimum price deviation in points required to form a new ZigZag swing point.
- ZigZag_Backstep (Default: 3): Minimum bar separation between consecutive local swing extremes.

Section 19: Filter 15 - Supertrend Filter
- InpFilter15 (Default: "=== 15. SUPERTREND FILTER ==="): Visual header for the Wilder ATR-based Supertrend direction filter.
- Use_Supertrend_Filter (Default: false): Enables trend direction filtering requiring Supertrend to be in an uptrend for Buy and a downtrend for Sell.
- ST_AtrPeriod (Default: 10): ATR lookback length in bars used in the Supertrend volatility band calculation.
- ST_Factor (Default: 3.0): Volatility multiplier applied to the ATR bands in the Supertrend calculation.

7. Risk Disclaimer
Trading foreign exchange, commodities, indices, and other financial instruments carries a high level of risk and may not be suitable for all investors. Past performance, historical signal behavior, or backtesting results do not guarantee future performance. This software is a technical analysis and charting tool intended solely to assist traders in evaluating market conditions; it does not constitute financial advice and does not guarantee trading profits. Always test the indicator thoroughly on a MetaTrader demo account to understand its operational behavior and parameter sensitivity before applying it to live market analysis.
Produtos recomendados
O indicador Crypto_Forex "Auto FIBO Pro" é uma ótima ferramenta auxiliar na negociação! - O indicador calcula e coloca automaticamente no gráfico os níveis de Fibonacci e as linhas de tendência locais (cor vermelha). - Os níveis de Fibonacci indicam áreas-chave onde o preço pode reverter. - Os níveis mais importantes são 23,6%, 38,2%, 50% e 61,8%. - Pode utilizá-lo para scalping de reversão ou para negociação de grelha de zona. - Existem muitas oportunidades para melhorar o seu sistema atual ut
Master Dot for MetaTrader 4 Detect Volatility Exhaustion Before the Market Returns to Balance Master Dot is a professional non-repainting indicator designed to detect moments when price moves beyond its statistically expected volatility range. These situations often occur during sharp market impulses, liquidity grabs or temporary emotional moves, when price departs from its normal trading conditions. Instead of following trends, Master Dot highlights volatility exhaustion — moments where the mar
EARLY REMINDER: The Starting price is 65 price will rise soon up to 365$ and then 750$ after first 10 copies of sales. Grab this offer now! Introduction Hello, traders! Welcome to the demonstration of the Forex Beast Indicator , a comprehensive tool designed to assist aspiring traders in navigating the complexities of the forex market. This indicator incorporates seven essential components to provide a well-rounded trading experience: Moving Averages Colored Zones Support and Resistance Levels
Trend Ray
Andriy Sydoruk
The indicator shows the potential trend direction by cyclical-wave dependence. Thus, all the rays of the intersection will be optimal rays, in the direction of which the price is expected to move, taking into account the indicator period. Rays can be used as a direction for potential market movement. But we must not forget that the approach must be comprehensive, the indicator signals require additional information to enter the market.
Happy Scalping Indicator
Leandro Bernardez Camero
Este indicador foi projetado para scalping agressivo e entradas rápidas em opções binárias , gerando sinais em toda vela , para que você saiba exatamente o que está acontecendo o tempo todo. Junte-se ao canal Happy Scalping: MQL5 Não repinta : o sinal da vela atual é gerado em TEMPO REAL , o que significa que pode mudar enquanto a vela ainda está em formação, dependendo se o preço sobe ou desce em relação ao fechamento da vela anterior. Mas uma vez que a vela fecha , a cor do sinal fica comple
Super Reversal Pattern
Parfait Mujinga Ndalika
Super Reversal Pattern Indicator Unlock the power of advanced pattern recognition with our Super Reversal Pattern Indicator. Designed for traders seeking precision and reliability, this indicator identifies one of the most effective reversal patterns in technical analysis, offering a significant edge in your trading strategy. Key Features: Non-Repainting Accuracy: Enjoy the confidence of non-repainting technology. Once a Super Reversal Pattern is detected, it remains static, providing consiste
Noize Absorption Index MT4
Ekaterina Saltykova
5 (1)
Noize Absorption Index - is the manual trading system that measures the difference of pressure between bears forces and bulls forces. Green line - is a noize free index that showing curent situation. Zero value of index shows totally choppy/flat market.Values above zero level shows how powerfull bullish wave is and values below zero measures bearish forces.Up arrow appears on bearish market when it's ready to reverse, dn arrow appears on weak bullish market, as a result of reverse expectation. S
VR Cub
Vladimir Pastushak
VR Cub é um indicador para obter pontos de entrada de alta qualidade. O indicador foi desenvolvido para facilitar cálculos matemáticos e simplificar a busca por pontos de entrada em uma posição. A estratégia de negociação para a qual o indicador foi escrito tem provado a sua eficácia há muitos anos. A simplicidade da estratégia de negociação é a sua grande vantagem, o que permite que até mesmo os comerciantes novatos negociem com sucesso com ela. VR Cub calcula os pontos de abertura de posição e
The Th3Eng PipFinite indicator is based on a very excellent analysis of the right trend direction with perfect custom algorithms. It show the true direction and the best point to start trading. With StopLoss point and Three Take Profit points. Also it show the right pivot of the price and small points to order to replace the dynamic support and resistance channel, Which surrounds the price. And Finally it draws a very helpful Box on the left side on the chart includes (take profits and Stop loss
Alpha Trend sign has been a very popular trading tool in our company for a long time. It can verify our trading system and clearly indicate trading signals, and the signals will not drift. Main functions: Based on the market display of active areas, indicators can be used to intuitively determine whether the current market trend belongs to a trend market or a volatile market. And enter the market according to the indicator arrows, with green arrows indicating buy and red arrows indicating se
Money Flow Profile MT5 HERE   Here   our more valuable tools SMC Trend Trading   ,  Easy SMC Trading  ,  Institutional SMC Architect Volume Analysis Tools  ,  Volume flow Profile  ,  Market volume profile  , FVG with Volume  , Liquidity Heatmap Profile  ,  Volume Spread Analysis This Master Edition is engineered for clarity and speed, featuring a unique Auto-Theme Sync system that instantly beautifies your chart layout upon loading. Key Features: True Money Flow Calculation: Goes beyond stand
Double HMA lines MTF
Pavel Zamoshnikov
5 (2)
This is a multi-timeframe version of the popular Hull Moving Average (HMA). The Double HMA MTF Light indicator combines two timeframes on a single chart. The HMA of the higher timeframe defines the trend, and the HMA of the current timeframe defines short-term price movements. The indicator is freely distributed and hasn't audio signals or messages. Its main function is the visualization of price movements. If you need advanced functionality of the HMA multi-timeframe indicator (information ab
FREE
Support and Resistance is a very important reference for trading.  This indicator provides customized support and resistance levels, automatic draw line and play music functions.  In addition to the custom RS, the default RS includes Pivot Point, Fibonacci, integer Price, MA, Bollinger Bands. Pivot Point is a resistance and support system. It has been widely used at froex,stocks, futures, treasury bonds and indexes. It is an effective support resistance analysis system. Fibonacci also known as t
Trend PA
Mikhail Nazarenko
5 (3)
The Trend PA indicator uses   Price Action   and its own filtering algorithm to determine the trend. This approach helps to accurately determine entry points and the current trend on any timeframe. The indicator uses its own algorithm for analyzing price changes and Price Action. Which gives you the advantage of recognizing, without delay, a new nascent trend with fewer false positives. Trend filtering conditions can be selected in the settings individually for your trading style. The indicator
Infinity Trend Pro
Yaroslav Varankin
1 (1)
This is a trend indicator without redrawing Developed instead of the binary options strategy (by the color of the Martingale candlestick) Also works well in forex trading When to open trades (binary options) A signal will appear in the place with a candle signaling the current candle It is recommended to open a deal for one candle of the current timeframe M1 and M5 When a blue dot appears, open a deal up When a red dot appears, open a trade down. How to open trades on Forex. When a signal is rec
Price Magnet — Price Density and Attraction Levels Indicator Price Magnet is a professional analytical tool designed to identify key support and resistance levels based on statistical Price Density. The indicator analyzes a specified historical period and detects price levels where the market spent the most time. These zones act as “magnets,” attracting price action or forming a structural base for potential reversals. Unlike traditional Volume Profile tools, Price Magnet focuses on price-time d
Moving Pivot Average    The pivot indicator compares the selected period with its counterpart from the previous period. The indicator uses very flexible algorithm for pivot value calculating. It allows you to allocate in days a certain time intervals (custom bars) and calculate the average pivot value based on High, Low and Close prices of these bars. How many custom bars will be taken into account is determined by the "Days" setting. The pivot line can be considered an average trend line and us
Indicador único que implementa uma abordagem profissional e quantitativa para significar negociação de reversão. Ele capitaliza o fato de que o preço desvia e retorna à média de maneira previsível e mensurável, o que permite regras claras de entrada e saída que superam amplamente as estratégias de negociação não quantitativas. [ Installation Guide | Update Guide | Troubleshooting | FAQ | All Products ] Sinais de negociação claros Incrivelmente fácil de negociar Cores e tamanhos personalizáveis
"Dynamic Scalping Oscillator" - um indicador avançado e personalizado para Crypto_Forex - uma ferramenta de negociação eficiente para MT4! - Nova geração de osciladores - veja as imagens para saber como usá-lo. - O Dynamic Scalping Oscillator possui zonas adaptáveis de sobrevenda/sobrecompra. - O oscilador é uma ferramenta auxiliar para encontrar pontos de entrada exatos em áreas dinâmicas de sobrevenda/sobrecompra. - Valores de sobrevenda: abaixo da linha verde, valores de sobrecompra: acima d
Binary Options Support Resistance Indicator This indicator is designed for binary options trading and effectively shows retracements from support and resistance levels. Signals appear on the current candle. A red arrow pointing downwards indicates a potential selling opportunity, while a blue arrow pointing upwards suggests buying opportunities. All that needs adjustment is the color of the signal arrows. It is recommended to use it on the M1-M5 timeframes as signals are frequent on these timef
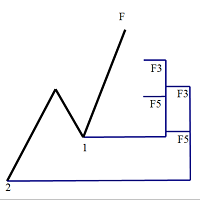
Fibonacci recontratar e extensão linha de desenho ferramenta Fibonacci recontratar e estender a ferramenta de desenho de linha para a plataforma MT4 é adequado para comerciantes que usam método de negociação de pontos e negociação de secções douradas Vantagens: Não há linha extra, não há linhagem muito longa, e é fácil observar e encontrar oportunidades de negociação Versão experimental: https://www.mql5.com/zh/market/product/35884 Principais funções: 1. Podem ser desenhados diretamente vári
Daily Candle Predictor é um indicador que prevê o preço de fechamento de uma vela. O indicador destina-se principalmente ao uso em gráficos D1. Este indicador é adequado tanto para negociação forex tradicional quanto para negociação de opções binárias. O indicador pode ser usado como um sistema de negociação autônomo ou pode atuar como um complemento ao seu sistema de negociação existente. Este indicador analisa a vela atual, calculando certos fatores de força dentro do próprio corpo da vela, be
Free automatic Fibonacci is an indicator that automatically plots a Fibonacci retracement based on the number of bars you select on the BarsToScan setting in the indicator. The Fibonacci is automatically updated in real time as new highest and lowest values appears amongst the selected bars. You can select which level values to be displayed in the indicator settings. You can also select the color of the levels thus enabling the trader to be able to attach the indicator several times with differe
FREE
Royal Dutch Skunk
Sayan Vandenhout
ROYAL DUTCH SKUNK USES THE TREND WAVE INDICATOR AND IT CAN IDENTIFY THE BEGINNING AND THE END OF A NEW WAVE TREND MOVEMENT. AS AN OSCILLATOR, THE INDICATOR IDENTIFIES THE OVERBOUGHT AND OVERSOLD ZONES. IT WORKS GREAT TO CATCH THE SHORT TERM PRICE REVERSALS AND USES A MARTINGALE STRATEGY TO CLOSE ALL TRADES IN PROFIT. USE DEFAULT SETTINGS ON H1 OR HIGHER TIME FRAME ON ANY PAIR FOR MORE ACCURATE TRADES WHY THIS EA : Smart entries calculated by 6 great strategies The EA can be run on even a $20000
This is an intraday indicator that uses conventional formulae for daily and weekly levels of pivot, resistance and support, but updates them dynamically bar by bar. It answers the question how pivot levels would behave if every bar were considered as the last bar of a day. At every point in time, it takes N latest bars into consideration, where N is either the number of bars in a day (round the clock, i.e. in 24h) or the number of bars in a week - for daily and weekly levels correspondingly. So,
Os indicadores [ZhiBiCCI] são adequados para todo o ciclo de uso e também são adequados para todas as variedades do mercado. [ZhiBiCCI] Linha sólida verde é uma inversão da divergência de alta. A linha pontilhada verde é uma divergência de alta clássica. [ZhiBiCCI] A linha sólida para o vermelho é uma divergência de baixa reversa. A linha pontilhada vermelha é uma divergência clássica de baixa. [ZhiBiCCI] pode ser definido nos parâmetros (Alerta, Enviar e-mail, Enviar notificação), definido c
Spread and Close MT4
Alexander Denisovich Jegorov
Spread & Candle Close Timer Indicator for MT4  Optimize your trading with this lightweight and efficient indicator, designed to display the real-time spread and candle close countdown directly on your MT4 chart. Features: Live Spread Monitoring – Instantly see market conditions. Candle Close Timer – Stay prepared for the next price movement. Simple & Non-Intrusive Design – No unnecessary settings, just clear and accurate data. Ideal for scalpers, day traders, and those who need real-time exec
CRT Candle Range Theory HTF MT4 - Ultimate CRT Indicator: Conceitos Avançados de ICT e Sistema de Negociação SnR Malaio Domine as pegadas dos criadores de mercado com o indicador mais avançado de Candle Range Theory. Desbloqueie o verdadeiro poder dos Smart Money Concepts (SMC) e opere com a precisão das instituições com o Ultimate CRT Indicator. Construído exclusivamente para traders sérios, este indicador automatiza a altamente eficaz Teoria CRT, um pilar central dos Conceitos ICT (Inner Circl
Com esta ferramenta de negociação, você pode analisar 15 mercados simultaneamente. Apresentando o novo indicador de negociação 2024: ️ Dashboard Multi Moeda Multi Time Frame Double RSI. Há pelo menos duas razões pelas quais criei esta ferramenta de negociação: Primeiro, estou cansado de observar apenas um mercado. Segundo, não quero perder o momento de entrada em outro mercado. É por isso que quero conhecer outras condições de mercado ao mesmo tempo. Por esta razão, preciso de um scanner
KT Horizontal Lines MT4
KEENBASE SOFTWARE SOLUTIONS
No MetaTrader, traçar várias   linhas horizontais   e acompanhar seus respectivos níveis de preço pode ser uma tarefa trabalhosa. Este indicador desenha automaticamente várias linhas horizontais em intervalos iguais para configurar alertas de preço, marcar níveis de suporte e resistência e outros usos manuais. Este indicador é ideal para traders iniciantes no Forex que estão em busca de oportunidades para obter lucros rápidos comprando e vendendo. As linhas horizontais ajudam a identificar possí
Os compradores deste produto também adquirem
Currency Strength Wizard é um indicador muito poderoso que fornece uma solução completa para uma negociação bem-sucedida. O indicador calcula o poder deste ou daquele par forex usando os dados de todas as moedas em vários intervalos de tempo. Esses dados são representados em uma forma de índice de moeda fácil de usar e linhas de energia de moeda que você pode usar para ver o poder desta ou daquela moeda. Tudo o que você precisa é anexar o indicador ao gráfico que deseja negociar e o indicador mo
Trend SniperX MT4
Sarvarbek Abduvoxobov
5 (6)
Trend Sniper X é um indicador de tendência multitemporal para MetaTrader 5 que ajuda os traders a identificar a direção da tendência e potenciais pontos de reversão com clareza e precisão. Para MT5: https://www.mql5.com/en/market/product/181101 Informação de preço: O preço atual é promocional e está sujeito a alterações à medida que novas atualizações e recursos forem lançados. Canal Code2Profit Domine o Mercado com Análise Multitemporal! Como Maximizar sua Taxa de Acerto com o Trend Sniper X: R

M1 Sniper
Oleg Rodin
4.97 (30)
O M1 SNIPER é um sistema indicador de negociação fácil de usar. É um indicador de seta projetado para o período M1. O indicador pode ser usado como um sistema independente para scalping no período M1 e pode ser usado como parte do seu sistema de negociação existente. Embora este sistema de negociação tenha sido projetado especificamente para negociação no M1, ele também pode ser usado em outros períodos. Originalmente, desenvolvi este método para negociar XAUUSD e BTCUSD. Mas considero-o útil ta
Smart Trend Trading System é um indicador para MetaTrader 4 que reúne informações de tendência, sinais de entrada e saída e níveis de preço em um único gráfico. Ele combina mais de 10 ferramentas de trading em um único sistema, incluindo detecção de tendência, zonas de reversão, Smart Cloud, lógica de trailing stop, suporte e resistência, coloração de candles, alertas e análise multi-timeframe. O sistema foi desenvolvido para ajudar você a operar diferentes condições de mercado: Mercados em tend
SIO Oscillator: oscilador auto-otimizável de desequilíbrio de semivariância Compre o indicador e receba GRÁTIS o Expert Advisor (EA) baseado nele. A maioria dos osciladores trata todo movimento de preço da mesma forma. O SIO separa a pressão de alta da pressão de baixa e mede o desequilíbrio entre elas, mostrando qual lado realmente controla o mercado: compradores ou vendedores. Quando o desequilíbrio atinge um extremo, o SIO gera um sinal claro com níveis de entrada, Stop Loss e Take Profit. O
Liquidity Scalper System: um sistema de trading baseado em liquidez no formato de indicador. A maioria dos indicadores mostra apenas uma seta, e depois o trader decide sozinho onde colocar o stop, onde está o alvo e se pode confiar no sinal. O Liquidity Scalper System cobre todo o ciclo da operação: encontra pools de liquidez, dá um sinal no seu rompimento, calcula imediatamente Entry, Stop Loss e três alvos, e mostra no painel as estatísticas e os resultados da validação em dados novos. O sist
Gann Made Easy
Oleg Rodin
4.84 (174)
Gann Made Easy é um sistema de negociação Forex profissional e fácil de usar, baseado nos melhores princípios de negociação usando a teoria do sr. W. D. Gann. O indicador fornece sinais precisos de COMPRA e VENDA, incluindo níveis de Stop Loss e Take Profit. Você pode negociar mesmo em movimento usando notificações PUSH. Entre em contato comigo após a compra para receber instruções de negociação e ótimos indicadores extras gratuitamente! Provavelmente você já ouviu muitas vezes sobre os métodos
Advanced Supply Demand
Bernhard Schweigert
4.91 (302)
Atualmente com 30% de desconto! A melhor solução para qualquer Trader Novato ou especialista! Este indicador é uma ferramenta de negociação exclusiva, de alta qualidade e acessível porque incorporamos uma série de recursos proprietários e uma nova fórmula. Com esta atualização, você poderá mostrar fusos horários duplos. Você não só será capaz de mostrar um TF mais alto, mas também mostrar ambos, o TF do gráfico, MAIS o TF mais alto: MOSTRANDO ZONAS ANINHADAS. Todos os traders de Oferta e Demanda
Este indicador é um indicador para análise automática de ondas que é perfeito para negociações práticas! Caso... Nota:   Não estou acostumado a usar nomes ocidentais para classificação de ondas. Devido à influência da convenção de nomenclatura de Tang Lun (Tang Zhong Shuo Zen), nomeei a onda básica como   uma caneta   e a banda de onda secundária como   um segmento   . ao mesmo tempo, o segmento tem a direção da tendência.   O segmento de tendência principal   é nomeado (esse método de nomencl
Actualmente 30% OFF ! A melhor solução para qualquer novato ou comerciante especializado! Este software de painel de instrumentos está a funcionar em 28 pares de moedas. É baseado em 2 dos nossos principais indicadores (Advanced Currency Strength 28 e Advanced Currency Impulse). Dá uma grande visão geral de todo o mercado Forex. Mostra valores avançados de força da moeda, velocidade de movimento da moeda e sinais para 28 pares de divisas em todos os (9) períodos de tempo. Imagine como a sua n
Non repaint MT4
Yan Zhen Du
5 (2)
This is a professional chart indicator designed for traders focused on stability and clear price action. It helps filter market noise and provides clear visual entry and exit zones for your trading decisions. Price Information: The current price is promotional and is subject to change as upcoming updates and new features are released. MQL5 public channel:  CLICK HERE for MT5:  Non-repainting MT5 version Core Features: Strictly Non-Repainting: The system is built with strict non-repaint logic. W
Scalper Vault
Oleg Rodin
4.9 (41)
O Scalper Vault é um sistema de negociação poderoso e completo, projetado para traders que buscam consistência em operações intraday. Este indicador de alta precisão funciona como um sistema de negociação autônomo, oferecendo análises de nível institucional tanto para o mercado Forex quanto para Opções Binárias. ENTRE EM CONTATO COMIGO APÓS A COMPRA PARA RECEBER DICAS DE NEGOCIAÇÃO E UM BÔNUS EXCLUSIVO! Ao eliminar suposições e análises manuais complexas, o Scalper Vault permite que você foque
Apresentamos o ON Trade Waves Patterns Harmonic Elliot Wolfe, um indicador avançado projetado para detectar diversos tipos de padrões no mercado, usando métodos manuais e automáticos. Aqui está como ele funciona: Padrões Harmônicos: Este indicador pode identificar padrões harmônicos que aparecem em seu gráfico. Esses padrões são essenciais para traders que praticam a teoria de negociação harmônica, conforme popularizada no livro de Scott Carney "Harmonic Trading vol 1 e 2". Seja desenhando-os m
RFI levels PRO
Roman Podpora
5 (2)
O indicador mostra com precisão os pontos de reversão e as zonas de retorno de preço onde o   Principais players . Você identifica onde novas tendências estão se formando e toma decisões com máxima precisão, mantendo o controle sobre cada negociação. VERSION MT5     -     Revela seu potencial máximo quando combinado com o indicador   TREND LINES PRO. O que o indicador mostra: Estruturas de reversão e níveis de reversão com ativação no início de uma nova tendência. Exibição dos níveis de   TAKE
Zoryk Gold mt4
Reda El Koutbane
5 (4)
O desconto termina em 24 horas — próximo preço $ 69 ZORYK — Sistema avançado de sinais e planejamento para XAUUSD no MetaTrader 4 Você conhece essa sensação. Você analisa o ouro, espera pela entrada e finalmente abre a operação. O preço começa a se mover contra você. Você fecha cedo demais, altera o Stop Loss ou hesita por alguns segundos. Logo depois, o mercado segue exatamente na direção que você esperava, mas sem você na operação. O problema nem sempre era a direção. O verdadeiro problem
ShapeRadar - indicador de padrões gráficos clássicos O ShapeRadar encontra automaticamente no gráfico os padrões clássicos da análise técnica: topos e fundos duplos e triplos, Ombro-Cabeça-Ombro e sua versão invertida, cunhas ascendentes e descendentes, retângulos, triângulos, bandeiras e flâmulas. Quando o preço fecha além do limite de uma figura, o indicador desenha o padrão, o ponto de entrada, o nível de stop loss e o alvo, e um painel informativo resume todos os padrões detectados. Versão p
O sistema PRO Renko é um sistema de negociação altamente preciso especialmente concebido para a negociação de gráficos RENKO. Trata-se de um sistema universal que pode ser aplicado a vários instrumentos de negociação. O sistema neutraliza eficazmente o chamado ruído de mercado, dando-lhe acesso a sinais de inversão precisos. O indicador é muito fácil de usar e tem apenas um parâmetro responsável pela geração de sinal. Você pode facilmente adaptar a ferramenta a qualquer instrumento de negocia
SR Liquidity
Oleg Rodin
5 (3)
O SR Liquidity é um indicador de trading projetado para revelar as zonas ocultas onde a liquidez do mercado se concentra e o preço reage com maior intensidade. Essas áreas específicas de liquidez funcionam como níveis poderosos de suporte e resistência, oferecendo um mapa claro de onde é mais provável que o mercado reverta. Em vez de traçar linhas comuns de Suporte e Resistência, o SR Liquidity analisa o comportamento real dos preços para detectar as zonas onde se acumulam pressões de compra e v
Auto Optimized SpeedAngle é um sistema de vetorização de momentum de nível institucional que elimina o sobreajuste ( curve-fitting ) por meio da otimização contínua de avanço ( Walk-Forward Optimization , WFO). Em vez de depender de entradas estáticas que se degradam quando os regimes de mercado mudam, o indicador recalibra dinamicamente seus parâmetros utilizando validação fora de amostra ( Out-of-Sample , OOS), garantindo que os sinais exibidos representem vantagens estatísticas genuínas e não
Professional Volume Profile An indicator for MetaTrader 4 that builds a horizontal Volume Profile directly on the price chart. It shows the levels where traders executed the most trades, helping to identify support/resistance zones and assess the balance of power in the market. What the Indicator Displays POC (Point of Control) — the level with the maximum trading volume (red line). VAH / VAL (Value Area High / Low) — the upper and lower boundaries of the value area, where 70% of the volume was
Italo Volume Indicator
Italo Santana Gomes
4.92 (79)
BUY INDICATOR AND GET EA FOR FREE AS A BONUS + SOME OTHER GIFTS! ITALO VOLUME INDICATOR  is the best volume indicator ever created, and why is that? The Indicator works on all time-frames and assets, indicator built after 7 years of experience on forex and many other markets. You know many volume indicators around the internet are not complete, does not help, and it's difficult to trade, but the Italo Volume Indicator is different , the Italo Volume Indicator shows the wave volume, when market
Estima o movimento de preço mais provável no curto prazo com base em cálculos matemáticos avançados. Características Estimativa do movimento imediato do preço no timeframe do gráfico e em todos os superiores; Cálculo da tendência real do mercado; Cálculo dos níveis de suporte e resistência mais importantes; Alertas de zonas de congestão, cruzamentos de níveis e mudanças de tendência; Leve nos recursos do sistema: as linhas e o painel só são atualizados quando um valor muda; Autoajustável: funci
Atomic Analyst
Issam Kassas
5 (14)
Atomic Analyst — MetaTrader 4 Para dúvidas sobre o produto, orientação de configuração ou suporte técnico, envie-me uma mensagem diretamente aqui no MQL5. O indicador transforma cálculos complexos do mercado em sinais visuais simples, candles coloridos, leituras de tendência, níveis de stop loss e várias zonas de take profit que os traders podem entender rapidamente e usar em condições reais de mercado. Principais usos de trading: Scalping e day trade: Desenvolvido para tomada de decisão rápida
Scalping Entry Points - é um sistema de negociação manual que pode se ajustar aos movimentos de preços e dar sinais para abrir negociações sem redesenhar. O indicador determina a direção da tendência pelo nível central de suporte e resistência. O indicador de ponto fornece sinais para entradas e saídas. Adequado para negociação intradiária manual, escalpelamento e opções binárias. Funciona em todos os prazos e instrumentos de negociação. O indicador dá vários tipos de alertas. Como usar o produ
All in One package includes the  Oscillator Predictor ,  MACD Predictor ,  Thrust Scanner  and  Advanced Fibonacci  indicators which are mandatory for applying  Dinapoli  trade plans.  Please visit below links for detailed explanations of indicators. Advanced Fibonacci Indicator =>  https://www.mql5.com/en/market/product/52834 Thrust Scanner Indicator => https://www.mql5.com/en/market/product/52830 Overbought /Oversold Predictor indicator => https://www.mql5.com/en/market/product/52621 Macd P
True Direction Oscillator
Muhammad Elbermawi
4.85 (364)
Ou (TDO) que é um índice que mede a taxa de variação do preço usando o princípio de " Pure Momentum ". Quando o preço de um título avança de 10 para 15, a taxa de variação do preço é 150%, mas quando diminui de 15 para 10, a taxa de variação do preço é apenas 33,3%. É por isso que os indicadores de análise técnica como "Taxa de variação do preço" (ROC) ou "Momentum" fornecem leituras mais altas para movimentos de preços ascendentes do que para os descendentes. O TDO corrige esse problema para aj
Quantum Imbalance Profiles   é um indicador das fases de equilíbrio e desequilíbrio. Ele mostra em quais preços o mercado negociou volume, qual lado dominou dentro dessa zona e por quais níveis o preço depois se expandiu com impulso. Um perfil de volume clássico responde a uma única pergunta: onde ocorreu a negociação. Ele não mostra qual lado dominou em cada preço, como terminou a consolidação nem em que direção o mercado saiu dela. Quantum Imbalance Profiles constrói o perfil no modo Volume Bi
Indicador para negociação manual e análise técnica para Forex. Consiste em um indicador de tendência com o nível de abertura do dia de negociação e um indicador de seta para determinar os pontos de entrada. O indicador não muda de cor; funciona quando a vela fecha. Contém vários tipos de alertas para setas de sinalização. Pode ser configurado para funcionar em qualquer gráfico, instrumento de negociação ou período de tempo. A estratégia de trabalho baseia-se na busca de movimentos de preços ao
Currency Strength Matrix
Raymond Gilmour
4.5 (26)
THE ONLY CURRENCY STRENGTH INDICATOR BUILT ON PRICE ACTION Most currency strength meters average an oscillator, or measure how far price has travelled. But these are not accurate measures of trend, Currency Strength Matrix measures trend strength, not just if a currency price has gone up or down. Currency Strength Matrix reads market structure . For each of the 28 major pairs it finds the confirmed cycle highs and lows, and decides whether that pair is in an uptrend, a downtrend, or neither. A
Dark Support Resistance  is an Indicator for intraday trading. This Indicator is programmed to identify  Support and Resistance Lines , providing a high level of accuracy and reliability. Key benefits Easily visible lines Only the most important levels will be displayed Automated adjustment for each timeframe and instrument Easy to use even for beginners Never repaints, never backpaints, Not Lag 100% compatible with Expert Advisor development All types of alerts available: Pop-up, Email, Push
Mais do autor
Parabolic SAR Multi-Filter System MT5: Algorithmic Trend Reversal Engine 1. PRODUCT OVERVIEW & OPERATIONAL ARCHITECTURE Parabolic SAR Multi-Filter System MT5 is a professional multi-component technical analysis indicator engineered for the MetaTrader 5 terminal. The indicator combines J. Welles Wilder's classic Parabolic Time/Price System with an advanced modular filtering architecture comprising 17 distinct secondary validation engines. The primary objective of this software is to eliminate f
Hull Trend Arrows MT5 with Multi-Filter Suite - Technical Documentation 1. Overview and Analytical Purpose Hull Trend Arrows MT5 with Multi-Filter Suite is an algorithmic technical indicator for MetaTrader 5. It integrates the low-lag calculation engine of the Hull Moving Average (HMA) with fourteen modular confirmation filters to identify directional momentum transitions, calculate inflection points, and display non-repainting entry signals on the chart. Standard moving averages introduce sign
FREE
Product Overview: Relative Vigor Index Multi-Filter Technical System The Relative Vigor Index (RVI) Multi-Filter Indicator is a comprehensive technical analysis engine developed for the MetaTrader 5 terminal. Designed to identify cyclical momentum shifts, trend continuations, and structural market turning points, this analytical system couples the classic Relative Vigor Index formula with an advanced multi-layered confirmation matrix consisting of 17 distinct technical filters. Rather than rely
FREE
HA Signal MultiFilter MT5 - Technical Operational Manual & Architecture Guide 1. SYSTEM OVERVIEW & ARCHITECTURAL FOUNDATION HA Signal MultiFilter MT5 is a specialized analytical indicator developed for MetaTrader 5 terminal to identify directional momentum expansions and structural trend continuations[cite: 2]. By synthesizing smoothed Heiken Ashi candlestick price discovery with a modular 15-layer secondary confirmation filter suite, the system extracts high-probability market shifts while fil
FREE
1. OVERVIEW Harmonic Dashboard is a specialized multi-symbol and multi-timeframe analytical indicator designed for MetaTrader 5 (MT5). The software systematically scans financial instruments across multiple timeframes to identify six classical harmonic chart patterns: Gartley, Bat, Butterfly, Crab, Cypher, and Shark. The application consolidates multi-asset scanner results, trend filter validation metrics, price level projections, and interactive chart navigation controls into a single graphic
Overview MACD Signal with Multi Filters is an advanced technical analysis indicator engineered for MetaTrader 5 (MT5). The software combines the classic Moving Average Convergence Divergence (MACD) oscillator architecture with a modular 14-filter confirmation engine (MultiFilterSuite). It is developed to assist manual traders, quantitative analysts, and algorithmic system developers in identifying momentum shifts, trend continuations, and structural turning points while filtering out sideways ma
Overview The MA Cross Scanner Pro is an advanced, highly optimized multi-symbol and multi-timeframe analytical dashboard engineered specifically for the MetaTrader 5 terminal. Designed for technical analysts, systemic traders, and quantitative researchers, this utility serves as a comprehensive market surveillance engine. Its primary objective is to continuously monitor a customized array of financial instruments across numerous timeframes simultaneously, detecting precise moving average crosso
CCI MultiFilter Overbought Oversold Signal Pro MT5 Technical Specification & Operational Manual  1. Overview and System Identity CCI MultiFilter Overbought Oversold Signal Pro MT5 is an institutional-grade technical analysis indicator engineered natively for MetaTrader 5. Developed for quantitative analysts, systematic manual traders, and multi-asset operators, the system provides an objective algorithmic framework to identify cyclical market extremes, momentum shifts, and structural trend cont
WPR Williams Percent Range All Pair Timeframe Scanner Dashboard Overview WPR Scanner Dashboard Pro is a multi-symbol, multi-timeframe market scanning indicator and visual chart overlay utility built for MetaTrader 4 (MT4). The tool monitors Williams Percent Range (WPR) momentum exhaustion and threshold breakouts across multiple currency pairs, metals, indices, and CFDs simultaneously from a single chart window. In addition to its core WPR detection engine, the indicator incorporates an optiona
WAE Waddah Attar Explosion Multi Pair TimeFrame Scanner 1. Overview - WAE Scanner Dashboard is a technical analysis indicator and multi-symbol, multi-timeframe market scanner built for MetaTrader 4 (MT4). - It automates multi-chart monitoring by scanning volatility-driven momentum breakouts based on the Waddah Attar Explosion (WAE) methodology across multiple currency pairs, crosses, indices, or metals simultaneously. - Candidate signals are processed through a modular 15-filter technical conf
UT Bot Trend Multi Pair Timeframe Scan Dashboard Overview UT Bot Scanner Dashboard is a multi-pair and multi-timeframe technical indicator and market scanner developed natively for MetaTrader 4 (MT4). It continuously monitors selected Forex pairs, precious metals, indices, or active Market Watch symbols across multiple timeframes simultaneously to detect dynamic Average True Range (ATR) volatility trailing stop crossovers. Instead of manually cycling through dozens of individual charts to monit
TDI Traders Dynamic Index RSI Scanner All Pair TF Overview TDI & RSI Dynamic Line Dashboard Scanner is a multi-symbol and multi-timeframe analytical indicator designed for MetaTrader 4. The tool monitors multiple currency pairs, commodities, or indices across selected chart timeframes simultaneously to detect crossover events derived from the Traders Dynamic Index (TDI) and dual Relative Strength Index (RSI) Dynamic Lines. Every detected signal is evaluated against an optional 15-module technica
Stochastic Scanner Dashboard for MetaTrader 4 Stochastic Overbought Oversold Scanner Dashboard All Pair Time frame Overview - Stochastic Scanner Dashboard is a multi-symbol and multi-timeframe technical analysis indicator and market scanner built for MetaTrader 4 (MT4). - The tool continuously monitors user-defined currency pairs, metals, or Market Watch symbols across multiple timeframes from one chart. - It detects momentum shifts using configurable Stochastic Oscillator strategies and valida
SSL Channel Trend Scanner Dashboard Multi Pair Multi TimeFrame Overview SSL Channel Multi-Filter Dashboard is a technical analysis indicator and multi-symbol, multi-timeframe market scanner built for MetaTrader 4. It continuously monitors multiple currency pairs, commodities, or other broker instruments across user-selected timeframes to detect directional channel crossovers confirmed by an optional 15-module technical filter suite. Validated signals are organized in an interactive on-chart dash
Relative Vigor Index RVI All Pair and Timeframe Scanner Dashboard Overview RVI Scanner Dashboard is a multi-pair and multi-timeframe technical indicator and interactive scanner panel for MetaTrader 4 (MT4). Built around the Relative Vigor Index (RVI) oscillator, it continuously monitors multiple currency pairs, commodities, or indices across selected timeframes from one chart window. The tool detects directional momentum crossovers, validates setups through an optional 15-module technical conf
RSI Parabolic Overbought Oversold Multi pair Timeframe Scanner 1. Overview - RSI Parabolic Scanner Dashboard is a multi-symbol, multi-timeframe technical analysis indicator and real-time market scanner engineered for MetaTrader 4 (MT4). - It continuously monitors user-defined currency pairs, metals, or visible Market Watch instruments across multiple chart timeframes to identify momentum reversals and overbought or oversold market conditions. - The indicator combines two selectable RSI-based si
RSI Divergence Multi Pair Timeframe Scan Dashboard Overview - Product Type: Multi-symbol, multi-timeframe technical analysis indicator and interactive market dashboard scanner for MetaTrader 4 (MT4). - Core Purpose: Continuously monitors configured currency pairs, precious metals, indices, or active Market Watch symbols across multiple chart timeframes simultaneously to identify Regular and Hidden Relative Strength Index (RSI) divergence setups in one unified terminal window. - Structured Trade
Overview - Product Identity: Pola MultiCandle Scanner Dashboard is a multi-pair and multi-timeframe technical analysis indicator and market scanner developed for MetaTrader 4 (MT4). - Core Purpose: Continuously monitors user-defined currency pairs, precious metals, or Market Watch instruments across multiple timeframes to detect structured multi-candle price action formations, validate setups through a modular 15-indicator confluence suite, calculate volatility-adjusted Stop Loss (SL) and dual
MACD Signal Trend Cross Scanner All Pair Dashboard Overview MACD Scanner Dashboard is a technical analysis utility and multi-symbol, multi-timeframe dashboard indicator designed for MetaTrader 4[cite: 1]. Its primary objective is to monitor MACD crossover events across multiple currency pairs and chart timeframes simultaneously from a single active chart window[cite: 1]. Instead of manually switching between dozens of charts, traders can observe real-time market momentum, directional bias, calc
MA Moving Average Cross Scanner All Pair Timeframe Dashboard Overview MA Cross Scanner is an analytical multi-symbol and multi-timeframe technical indicator equipped with an interactive on-chart dashboard panel for MetaTrader 4[cite: 1]. The tool is engineered to monitor Moving Average (MA) crossover events across multiple currency pairs and timeframes simultaneously, consolidating signal detection, modular trend/momentum filtering, and Average True Range (ATR) risk-reward level calculations in
Ichimoku Tenkan Kijun Cross Scanner All Pair TimeFrame Overview TK Cross Scanner Dashboard is a technical analysis indicator and multi-asset market scanner engineered for the MetaTrader 4 platform. The utility monitors multiple currency pairs, commodities, and timeframes simultaneously to detect Ichimoku Tenkan-sen and Kijun-sen crossovers (TK Cross). In addition to automated signal scanning, the software calculates dynamic Stop Loss (SL) and dual Take Profit (TP1 and TP2) reference levels usin
Ichimoku Senkou Span B Scanner All Pair Timeframe Overview Senkou Span B Scanner Dashboard MT4 is a technical analysis indicator and multi-asset market scanner designed for MetaTrader 4. The tool monitors multiple currency pairs, commodities, and timeframes simultaneously from a single chart window to detect price interactions with the Ichimoku Kinko Hyo Senkou Span B boundary. In addition to scanning for signal candidates, the indicator integrates a 15-module secondary confirmation suite, calc
Heiken Ashi Multi Currency Pair Time Frame Scan Dashboard Overview Heiken Ashi Multi Timeframe Scanner Dashboard is a technical analysis utility and multi-symbol, multi-timeframe market scanner developed for the MetaTrader 4 platform. The tool is designed to monitor multiple currency pairs, commodities, or indices simultaneously from a single chart window. Instead of manually switching between dozens of charts and timeframes to inspect Heiken Ashi candle formations, traders can view active dire
Pro Harmonic Pattern Scanner All Pair Time Frame Dashboard Harmonic Pattern Scanner Dashboard MT4 is an analytical multi-symbol and multi-timeframe technical indicator designed for MetaTrader 4. It automatically scans price action across selected currency pairs, metals, or Market Watch instruments to identify classic XABCD harmonic structures, calculate Fibonacci-based entry, Stop Loss, and Take Profit zones, and validate setups through an integrated modular trend and momentum filter suite. Op
Fractal Breakout Scanner Multi Pair Timeframe Dashboard Overview Fractal Breakout Scanner Dashboard is a technical analysis indicator and multi-symbol, multi-timeframe scanning utility designed for MetaTrader 4. The tool monitors multiple currency pairs, commodities, and indices simultaneously to detect price breakouts beyond confirmed Bill Williams Fractal swing highs and swing lows. Rather than requiring manual chart switching across dozens of instruments, the indicator aggregates real-time b
Institutional Candle Price Engulfing Scan All Pair Timeframe Engulfing Scanner Dashboard is a technical analysis utility and multi-symbol, multi-timeframe candlestick pattern scanner for MetaTrader 4. It detects Bullish Engulfing and Bearish Engulfing setups across multiple currency pairs and timeframes simultaneously, displaying active signals in an interactive on-chart table alongside ATR-based Stop Loss and Take Profit reference levels. 1. Overview and Technical Purpose - Product Category:
Pinbar Marubozu Rejection Candlestick Scanner All Pair Timeframe Overview Candle Pattern Scanner Dashboard is a technical analysis utility and multi-pair, multi-timeframe scanner indicator designed for MetaTrader 4. The indicator continuously monitors multiple currency pairs, commodities, or indices across selected timeframes to detect specific Japanese candlestick price action formations—namely Candle Rejection, Full-Body Marubozu, and Classic Pin Bar structures. When a valid candlestick forma
Chaikin Oscillator Scanner All Pair Timeframe Dashboard Overview Chaikin Oscillator Scanner Dashboard is a technical analysis utility and multi-symbol, multi-timeframe market scanner designed for MetaTrader 4 (MT4)[cite: 1]. The indicator monitors multiple currency pairs, commodities, or indices simultaneously across selected chart timeframes to identify Chaikin Oscillator zero-line crossover events[cite: 1]. Detected setups are presented in an interactive on-chart table complete with automated
CCI Signal Trend Overbought Oversold Scanner All Pair TimeFrame Dashboard CCI Multi Timeframe Scanner Dashboard is a technical analysis utility and multi-symbol market scanner developed for MetaTrader 4. The indicator monitors multiple currency pairs and timeframes simultaneously using Commodity Channel Index (CCI) calculations combined with an optional multi-indicator confirmation suite and Average True Range (ATR) volatility projections. 1. Operating Principle and Signal Validity - Core Cal
BB Bollinger Bands Breakout Scanner All Pair Time Frame Bollinger Bands Breakout Scanner Dashboard is a technical analysis utility and multi-symbol, multi-timeframe market scanner engineered for MetaTrader 4 (MT4). The software continuously monitors multiple currency pairs, commodities, or indices across user-defined timeframes to detect confirmed Bollinger Bands breakout setups. Every detected signal is evaluated through an optional modular confirmation suite and automatically paired with vola
Filtro:
Sem comentários
Responder ao comentário