Pro Harmonic Pattern Scanner All Pair TF Dashboard
- Indicadores
- Versão: 1.0
- Ativações: 5

Pro Harmonic Pattern Scanner All Pair Time Frame Dashboard
Harmonic Pattern Scanner Dashboard MT4 is an analytical multi-symbol and multi-timeframe technical indicator designed for MetaTrader 4. It automatically scans price action across selected currency pairs, metals, or Market Watch instruments to identify classic XABCD harmonic structures, calculate Fibonacci-based entry, Stop Loss, and Take Profit zones, and validate setups through an integrated modular trend and momentum filter suite.
Operating Principle and Signal Logic
* Pattern Detection Framework: The indicator identifies confirmed swing highs and swing lows based on a user-defined pivot bar window, forming five-point XABCD price structures. Geometric proportions between legs (XAB, ABC, BCD, XAD, XAC, and XCD) are evaluated against standard Fibonacci ratio intervals within an adjustable tolerance band.
* Supported Harmonic Structures: Scans six established harmonic patterns: Gartley, Bat, Butterfly, Crab, Cypher, and Shark. Each pattern can be individually enabled or disabled.
* Signal Validation and Repainting Behavior: Pivot points are confirmed only after a specified number of closed bars have elapsed on both sides of a swing extreme, preventing premature signals on an unclosed pivot candle. However, because harmonic structures rely on swing high and swing low pivot detection, newly forming market swings can establish a new Point D as price action evolves. Traders should treat detected patterns as dynamic technical zones rather than static guarantees.
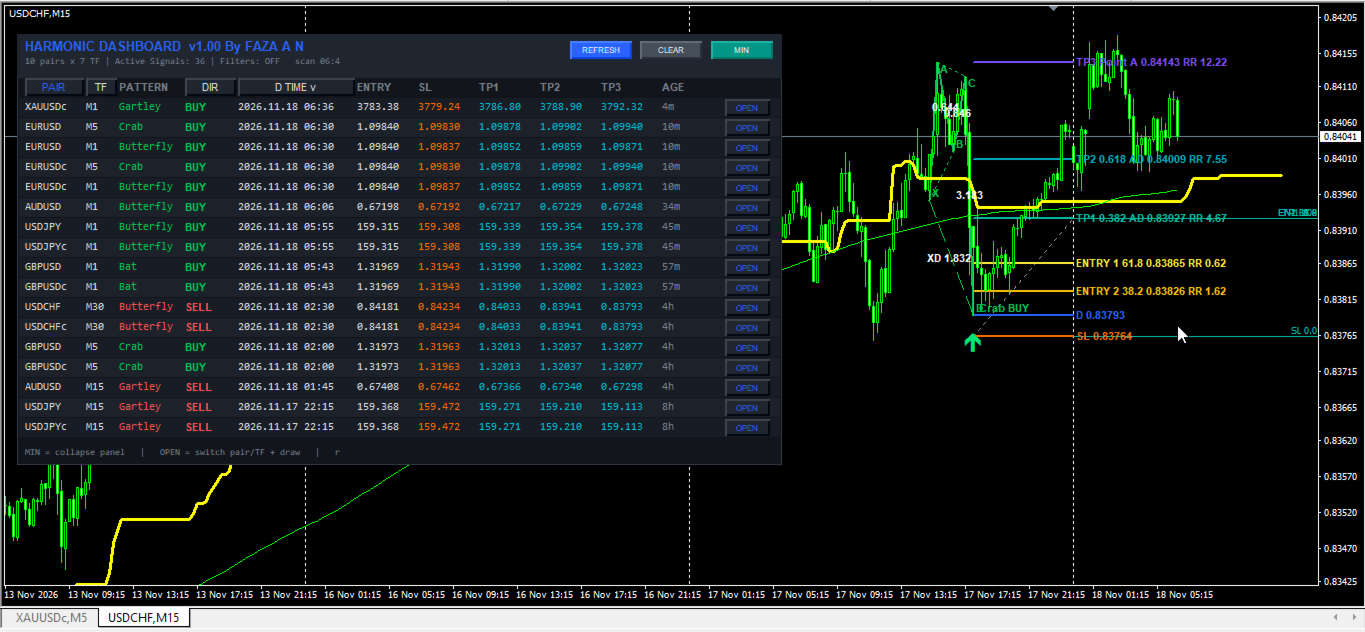
* Bullish (BUY) Setup Conditions: Triggered when a valid bullish XABCD structure completes at Point D (a confirmed swing low) within acceptable Fibonacci ratio tolerances, and all active technical filters confirm bullish alignment on the last closed bar (Bar 1).
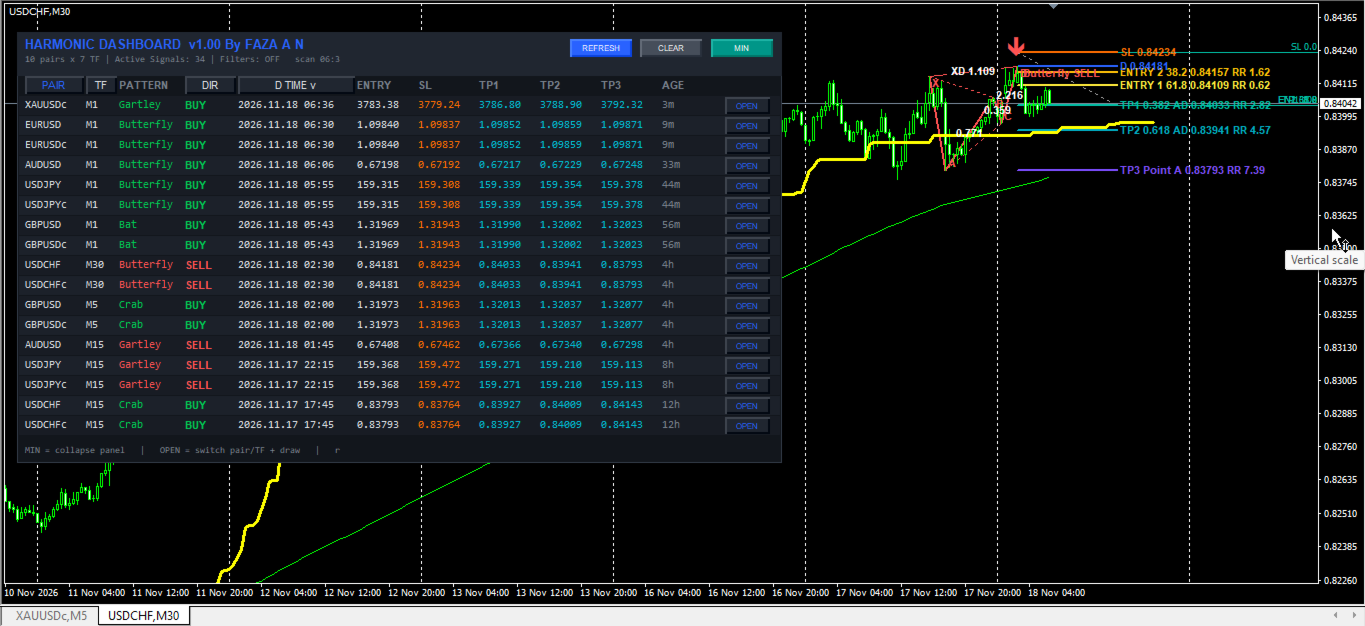
* Bearish (SELL) Setup Conditions: Triggered when a valid bearish XABCD structure completes at Point D (a confirmed swing high) within acceptable Fibonacci ratio tolerances, and all active technical filters confirm bearish alignment on the last closed bar (Bar 1).
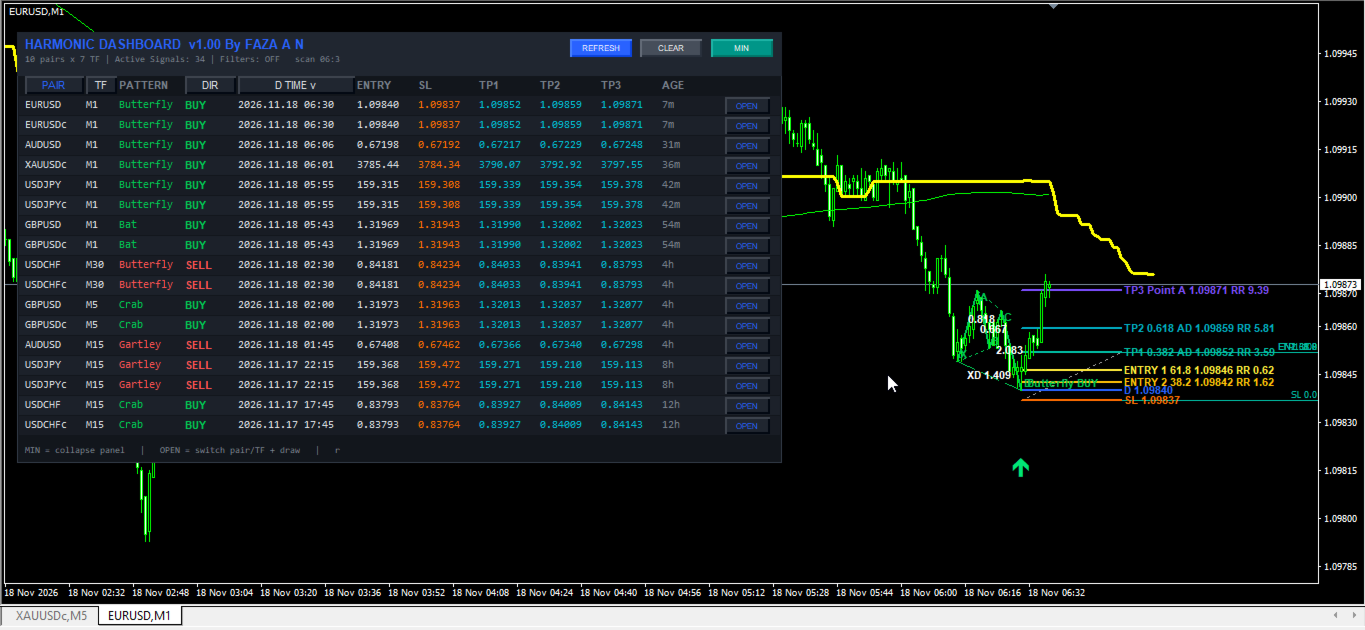
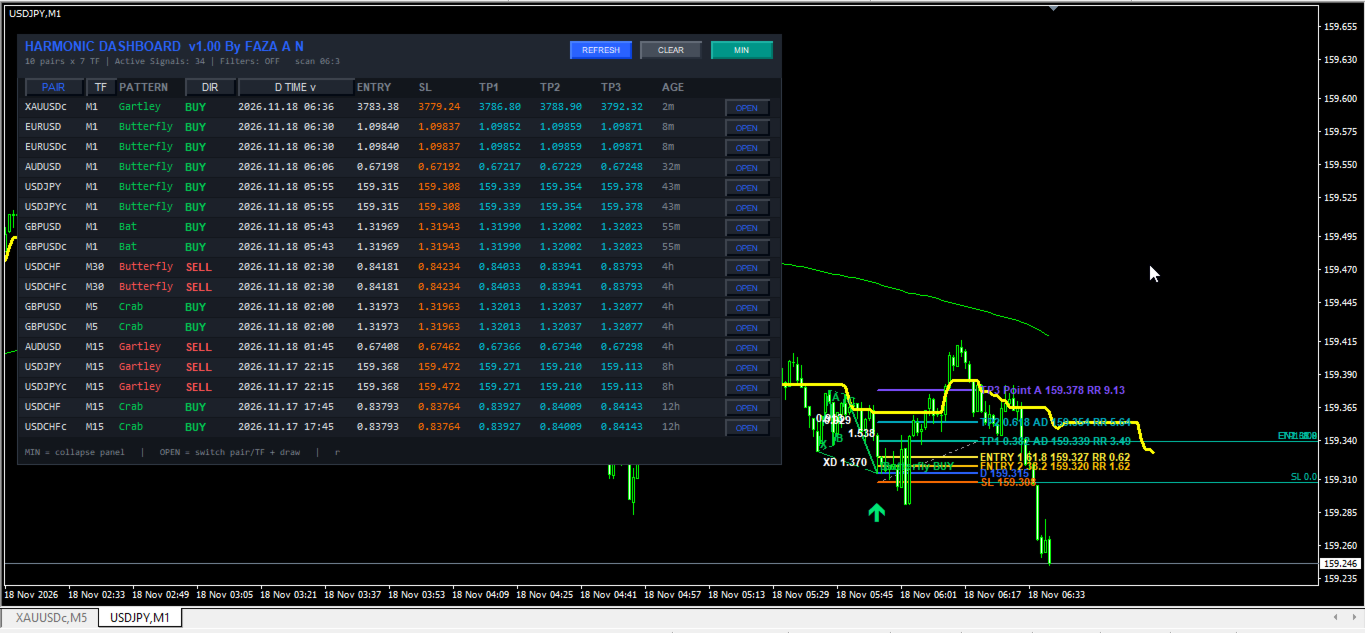
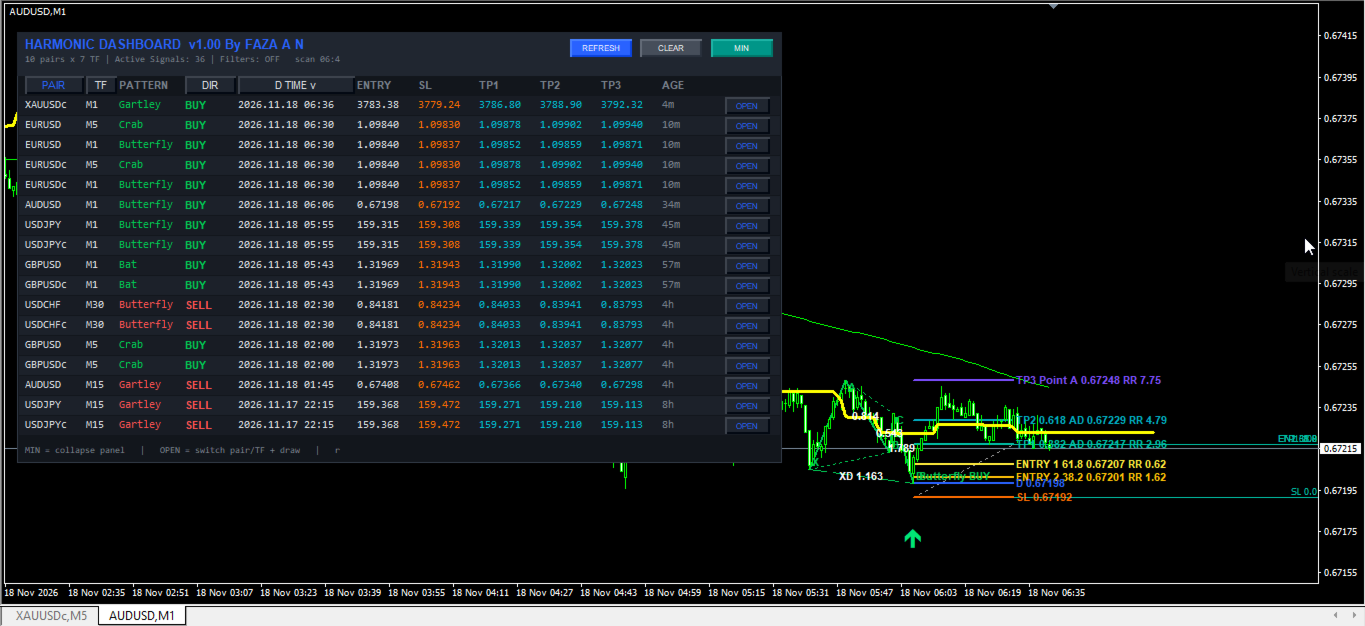
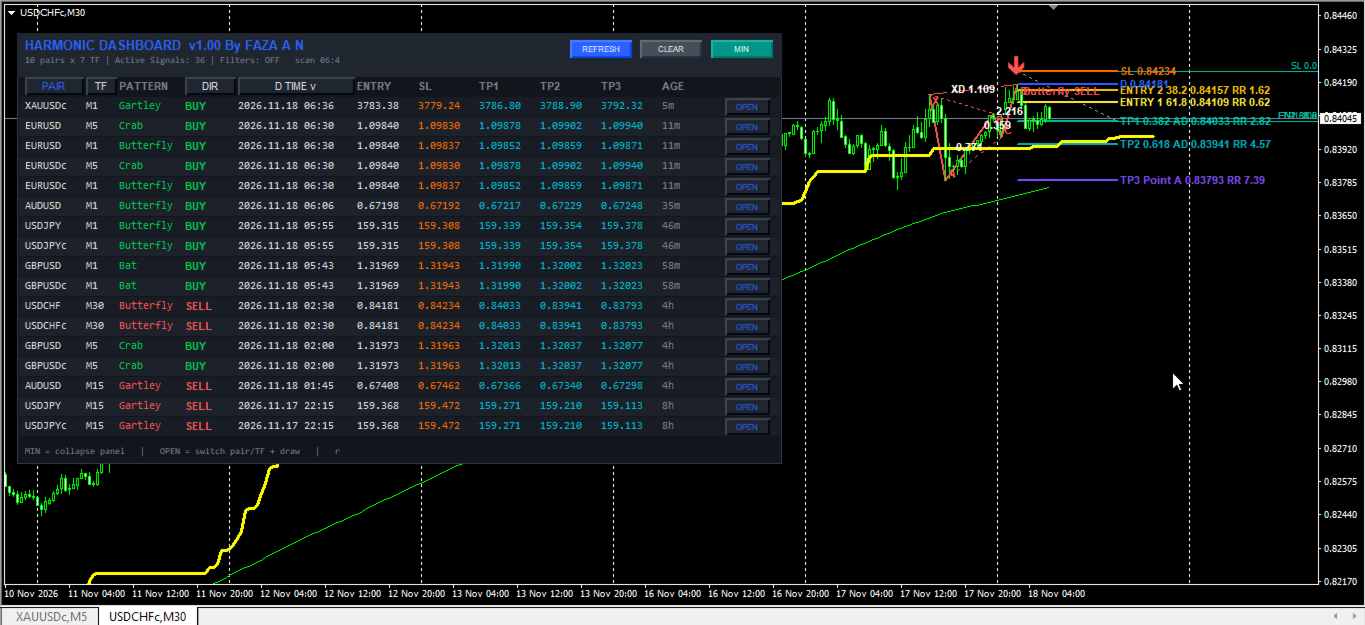
* Trade Level Projection: Upon pattern confirmation, the indicator projects Point D entry levels, optional secondary Fibonacci retracement entry zones (38.2% and 61.8% of the SL-to-TP1 span), a structural Stop Loss buffered by a percentage of the XA leg, and three progressive Take Profit targets (TP1 at 0.382 AD, TP2 at 0.618 AD, and TP3 at 1.000 AD).
Key Technical Features
* Multi-Pair and Multi-Timeframe Matrix: Scans up to the configured maximum number of symbols across multiple timeframes simultaneously at regular timer intervals.
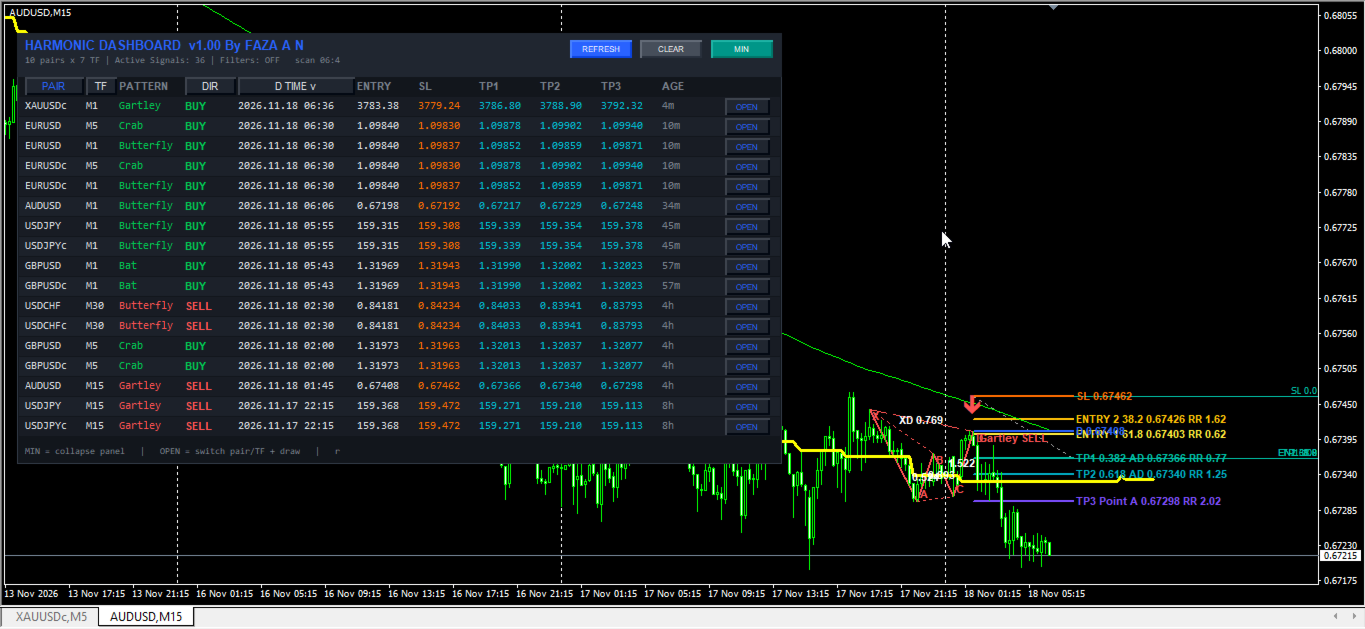
* Interactive On-Chart Dashboard: Displays active signals in a sortable, draggable, and collapsible table with columns for Pair, Timeframe, Pattern Name, Direction, Point D Timestamp, Entry, SL, TP1, TP2, TP3, Signal Age, and a one-click OPEN button.
* One-Click Chart Switching and Auto-Drawing: Clicking OPEN on any dashboard row switches the active chart to the corresponding symbol and timeframe and renders the XABCD geometry, ratio labels, directional arrow, Fibonacci retracement grid, and horizontal Entry/SL/TP projections with Risk-to-Reward ratios.
* Integrated 15-Module Technical Filter Suite: Includes optional confluence filters (RSI Cross, ADX Trend Strength, Single MA, Ichimoku Senkou Span B, RSI 75, Double MA Crossover, Awesome Oscillator, Parabolic SAR, Heiken Ashi, CCI Trend, CCI Overbought/Oversold, RVI Trend and Signal, MACD Histogram and Zero Line, Support/Resistance Zones, ZigZag Fibonacci Retracement, and ATR Supertrend) evaluated on closed candle data.
* Multi-Channel Alert System: Supports terminal pop-up alerts, audio alerts, and mobile push notifications via MetaQuotes ID, with an option to notify exclusively on newly formed Point D timestamps.
Dashboard Interface and Visual Elements
* Direction and Pattern Coloring: Bullish BUY setups and upward arrows are highlighted in green, while Bearish SELL setups and downward arrows are highlighted in red. Inactive or muted status text appears in grey.
* Interactive Controls: Drag the top header bar to reposition the panel anywhere on the chart. Click column headers (PAIR, TF, DIR, D TIME) to sort ascending or descending. Use REFRESH to force an immediate rescan, CLEAR to hide panel objects, and MIN/MAX to collapse or expand the table.
* Computational Efficiency Note: Because the scanner evaluates multiple symbols and timeframes concurrently, users on modest hardware should keep InpMaxSymbols and InpBarsCopy at moderate values and avoid attaching multiple dashboard instances across numerous open charts simultaneously.
Trading and Operational Recommendations
* Supported Instruments: Compatible with major and minor Forex pairs (such as EURUSD, GBPUSD, USDJPY, AUDUSD, USDCAD, USDCHF, NZDUSD, EURJPY, GBPJPY), precious metals (XAUUSD), indices, and crypto symbols available in Market Watch. Verify broker symbol suffixes when specifying custom lists.
* Recommended Timeframes: Suitable for intraday trading (M15, M30, H1) and swing trading (H4, D1). Lower timeframes (M1, M5) generate more frequent swing pivots and require stricter filter confluence.
* Broker Account Environment: Works on both Hedging and Netting accounts. Standard or ECN accounts with low spreads are recommended when trading lower timeframes or tight Stop Loss buffers.
Input Parameters Documentation
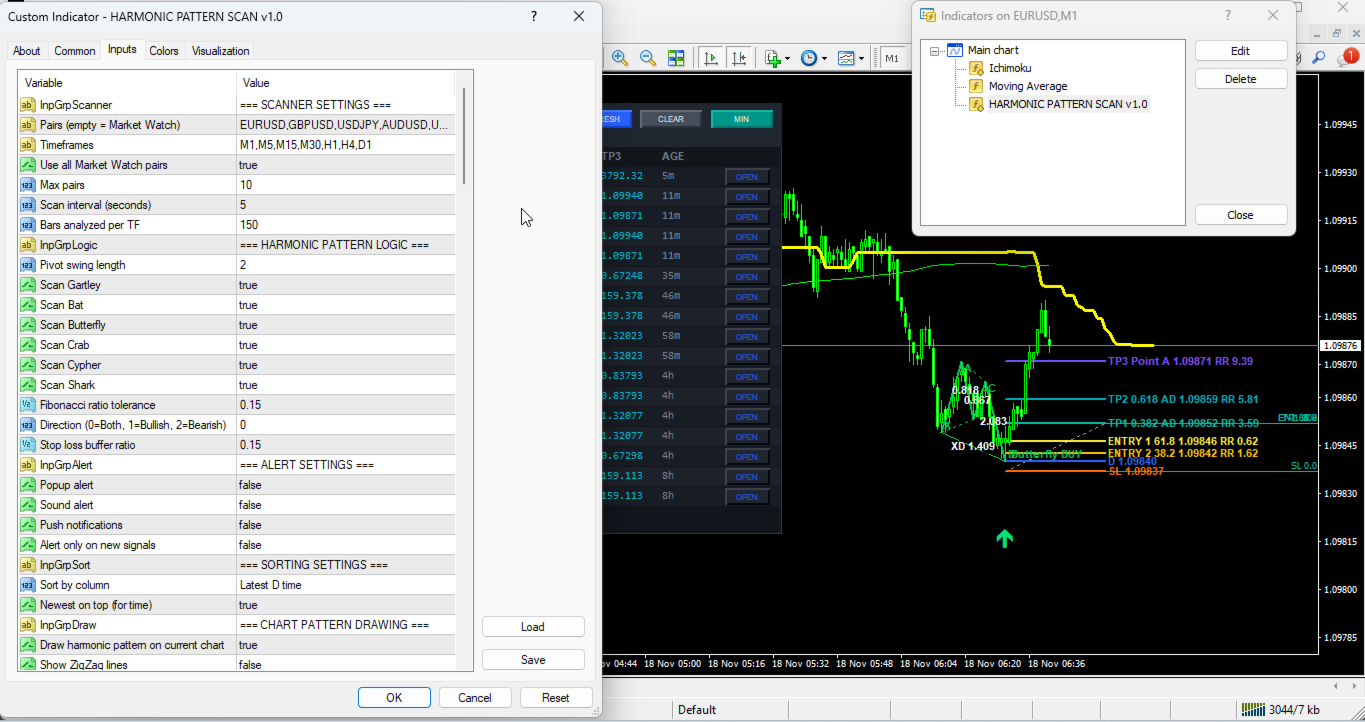
Scanner Settings
* InpGrpScanner (Default: "=== SCANNER SETTINGS ===") -> Visual section header for multi-pair scanner parameters.
* InpSymbols (Default: "EURUSD,GBPUSD,USDJPY,AUDUSD,USDCAD,USDCHF,NZDUSD,EURJPY,GBPJPY,XAUUSD") -> Comma-separated list of symbols to scan when Market Watch mode is disabled.
* InpTimeframes (Default: "M1,M5,M15,M30,H1,H4,D1") -> Comma-separated list of timeframes to scan across each symbol.
* InpUseWatch (Default: true) -> Enables automatic scanning of symbols currently visible in the MetaTrader Market Watch window.
* InpMaxSymbols (Default: 10) -> Maximum number of symbols processed during each scan cycle (count).
* InpScanSec (Default: 5) -> Interval between automatic background scans (seconds, minimum enforced at 3 seconds).
* InpBarsCopy (Default: 150) -> Number of historical bars retrieved per symbol and timeframe for swing and filter calculations (bars).
Harmonic Pattern Logic
* InpGrpLogic (Default: "=== HARMONIC PATTERN LOGIC ===") -> Visual section header for harmonic geometry settings.
* InpPivotLength (Default: 2) -> Number of bars required on each side to confirm a swing high or swing low pivot (bars).
* InpGartley (Default: true) -> Enables or disables detection of the Gartley pattern.
* InpBat (Default: true) -> Enables or disables detection of the Bat pattern.
* InpButterfly (Default: true) -> Enables or disables detection of the Butterfly pattern.
* InpCrab (Default: true) -> Enables or disables detection of the Crab pattern.
* InpCypher (Default: true) -> Enables or disables detection of the Cypher pattern.
* InpShark (Default: true) -> Enables or disables detection of the Shark pattern.
* InpTol (Default: 0.15) -> Allowable percentage deviation tolerance when matching Fibonacci leg ratios (ratio, 0.15 = 15%).
* InpDirection (Default: 0) -> Filters signal direction (0 = Both Bullish and Bearish, 1 = Bullish only, 2 = Bearish only).
* InpSlBuf (Default: 0.15) -> Stop Loss buffer distance calculated as a fraction of the XA leg price range (ratio).
Alert Settings
* InpGrpAlert (Default: "=== ALERT SETTINGS ===") -> Visual section header for notification settings.
* InpAlertPopup (Default: true) -> Enables or disables MetaTrader terminal pop-up alert windows.
* InpAlertSound (Default: true) -> Enables or disables audible sound playback ("alert.wav") upon signal detection.
* InpAlertPush (Default: false) -> Enables or disables push notifications sent to the MetaTrader mobile app.
* InpAlertOnlyNew (Default: false) -> Restricts alerts strictly to signals whose Point D timestamp is newer than the previously alerted timestamp on that slot.
Sorting Settings
* InpGrpSort (Default: "=== SORTING SETTINGS ===") -> Visual section header for dashboard sorting options.
* InpSortBy (Default: SORT_TIME) -> Default column used to sort dashboard rows (SORT_TIME, SORT_PAIR, SORT_TF, or SORT_DIR).
* InpSortNewest (Default: true) -> Places the most recent Point D signals at the top of the table when sorting by time.
Chart Pattern Drawing
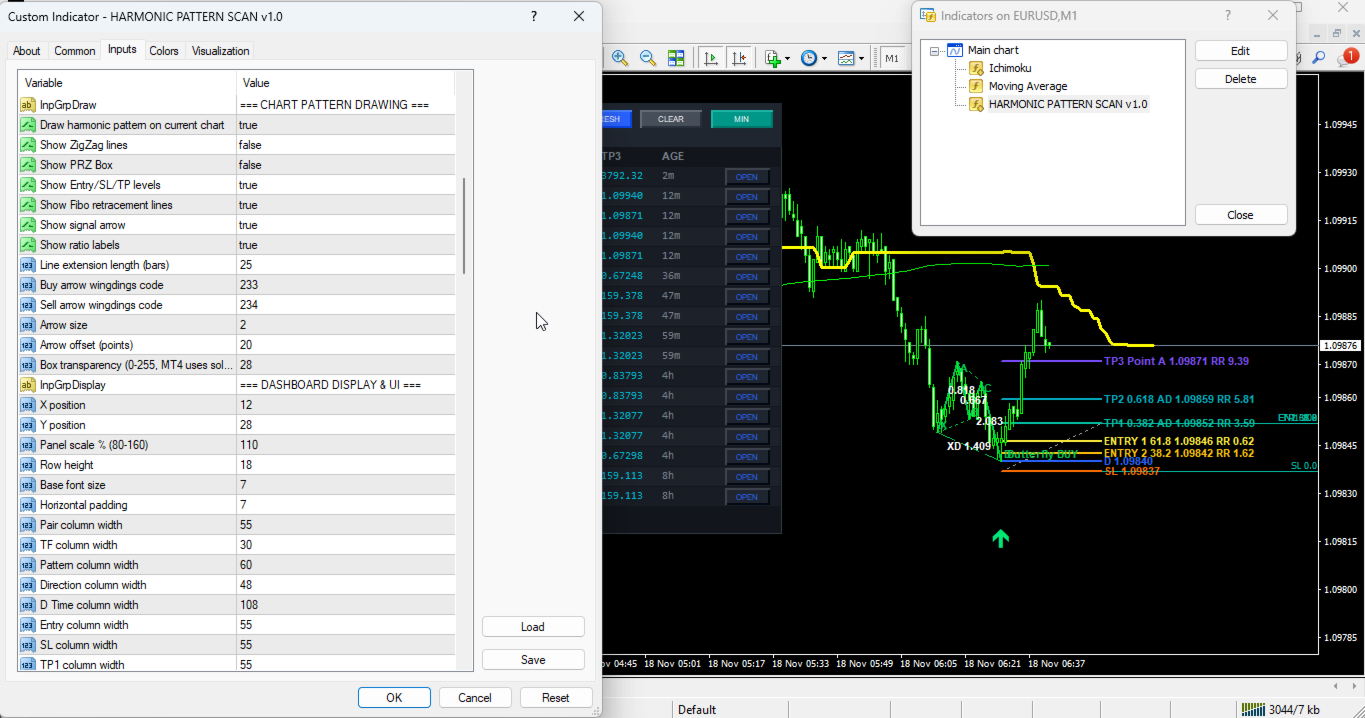
* InpGrpDraw (Default: "=== CHART PATTERN DRAWING ===") -> Visual section header for on-chart visual objects.
* InpDrawOnChart (Default: true) -> Enables or disables drawing the active harmonic pattern on the current chart.
* InpShowZigZag (Default: false) -> Toggles auxiliary ZigZag structural display options.
* InpShowBox (Default: false) -> Draws a bounding rectangle encompassing the XABCD swing range.
* InpShowLevels (Default: true) -> Draws horizontal Entry, Stop Loss, TP1, TP2, and TP3 lines with Risk-to-Reward labels.
* InpShowFibo (Default: true) -> Draws Fibonacci retracement levels between SL and TP1 along with secondary Entry 1 (61.8%) and Entry 2 (38.2%) lines.
* InpShowArrow (Default: true) -> Displays a directional Wingdings arrow at Point D.
* InpShowRatios (Default: true) -> Displays calculated Fibonacci ratio values along the pattern legs.
* InpExtendBars (Default: 25) -> Number of bars to the right of Point D that level lines extend (bars).
* InpArrowCodeBuy (Default: 233) -> Wingdings character code for bullish BUY arrows.
* InpArrowCodeSell (Default: 234) -> Wingdings character code for bearish SELL arrows.
* InpArrowSize (Default: 2) -> Width/size scale of signal arrows (1 to 5).
* InpArrowShiftPts (Default: 20) -> Vertical distance offset between Point D price and the signal arrow (points).
* InpBoxAlpha (Default: 28) -> Transparency value setting for pattern box rendering (0 to 255).
Dashboard Display and UI
* InpGrpDisplay (Default: "=== DASHBOARD DISPLAY & UI ===") -> Visual section header for panel dimensions and layout.
* InpX (Default: 12) -> Initial horizontal distance from the top-left chart corner (pixels).
* InpY (Default: 28) -> Initial vertical distance from the top-left chart corner (pixels).
* InpScale (Default: 110) -> Overall scaling percentage for panel dimensions and fonts (percent, clamped between 70 and 180).
* InpRowH (Default: 18) -> Base height of each table row (pixels).
* InpFont (Default: 7) -> Base font size for table text (points).
* InpPadX (Default: 7) -> Internal left and right horizontal padding inside the panel (pixels).
* InpWPair (Default: 55) -> Width of the PAIR column (pixels).
* InpWTF (Default: 30) -> Width of the TF column (pixels).
* InpWPola (Default: 60) -> Width of the PATTERN column (pixels).
* InpWArah (Default: 48) -> Width of the DIR column (pixels).
* InpWTime (Default: 108) -> Width of the D TIME column (pixels).
* InpWEntry (Default: 55) -> Width of the ENTRY column (pixels).
* InpWSL (Default: 55) -> Width of the SL column (pixels).
* InpWTP1 (Default: 55) -> Width of the TP1 column (pixels).
* InpWTP2 (Default: 55) -> Width of the TP2 column (pixels).
* InpWTP3 (Default: 55) -> Width of the TP3 column (pixels).
* InpWUmur (Default: 55) -> Width of the AGE column (pixels).
* InpWOpen (Default: 46) -> Width of the OPEN action button column (pixels).
* InpShowEmpty (Default: false) -> Displays scanned symbol/timeframe rows even when no valid signal is currently active.
* InpMaxRows (Default: 17) -> Maximum number of signal rows displayed simultaneously in the dashboard table (rows).
Color Palette
* InpGrpColors (Default: "=== COLOR PALETTE ===") -> Visual section header for color customization.
* InpColBg (Default: C'18,22,28') -> Main background color of the dashboard container.
* InpColHead (Default: C'32,38,48') -> Header bar and button background color.
* InpColRow (Default: C'24,28,36') -> Primary alternating table row background color.
* InpColRow2 (Default: C'28,33,42') -> Secondary alternating table row background color.
* InpColText (Default: C'220,225,230') -> Standard text color for table values.
* InpColBull (Default: C'0,200,83') -> Color for bullish patterns and BUY labels.
* InpColBear (Default: C'255,82,82') -> Color for bearish patterns and SELL labels.
* InpColMute (Default: C'120,128,140') -> Muted color for status text, hints, and inactive cells.
* InpColAccent (Default: C'41,98,255') -> Accent color for the dashboard title, active sort indicator, and OPEN button text.
* InpColTP (Default: C'0,188,212') -> Text color for TP1, TP2, and TP3 columns in the dashboard table.
* InpColArrowBuy (Default: C'0,230,118') -> Color of the on-chart bullish BUY arrow.
* InpColArrowSell (Default: C'255,82,82') -> Color of the on-chart bearish SELL arrow.
* InpColEntry (Default: C'41,98,255') -> Line and label color for the Point D entry level.
* InpColEN1 (Default: C'255,235,59') -> Line and label color for Fibonacci Entry 1 (61.8%).
* InpColEN2 (Default: C'255,193,7') -> Line and label color for Fibonacci Entry 2 (38.2%).
* InpColFibo (Default: C'158,158,158') -> Base color for the on-chart Fibonacci retracement grid.
* InpColSL (Default: C'255,109,0') -> Line and label color for the Stop Loss level.
* InpColTP1 (Default: C'0,191,165') -> Line and label color for Take Profit 1.
* InpColTP2 (Default: C'0,172,193') -> Line and label color for Take Profit 2.
* InpColTP3 (Default: C'124,77,255') -> Line and label color for Take Profit 3.
Filter Module 1: RSI Cross Filter
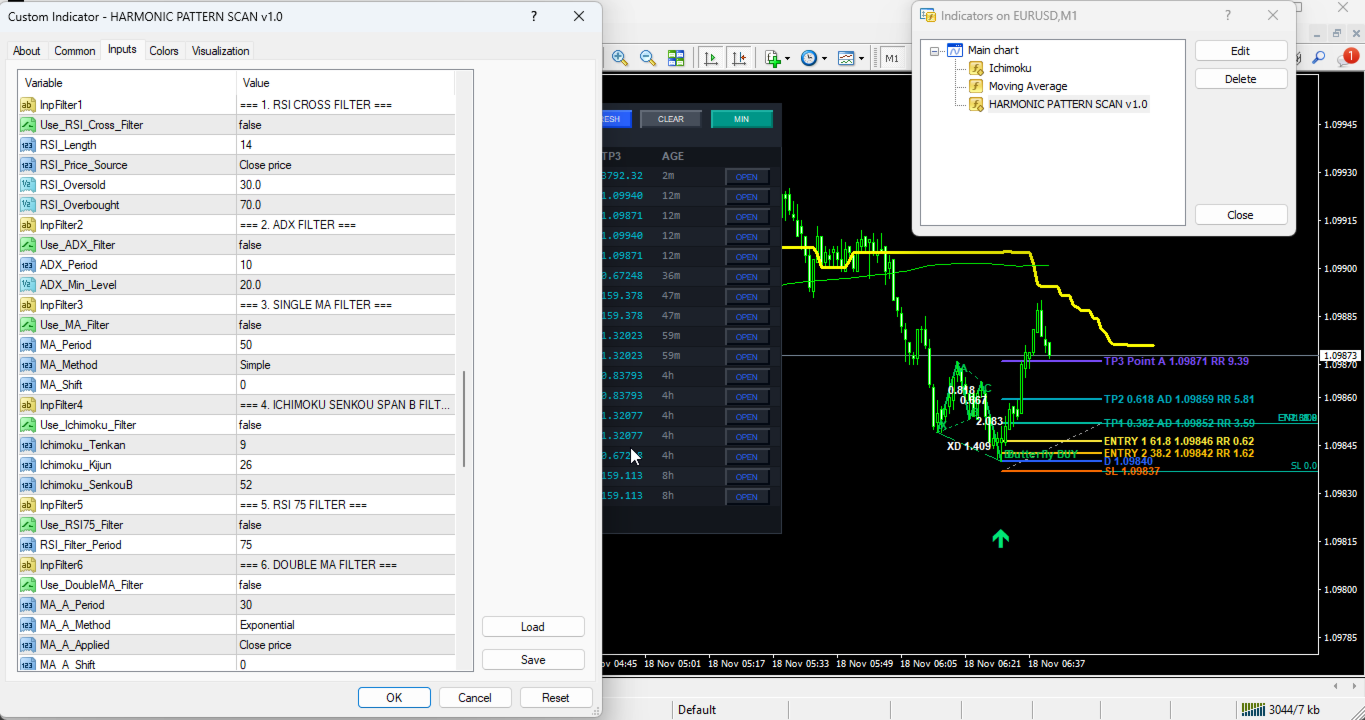
* InpFilter1 (Default: "=== 1. RSI CROSS FILTER ===") -> Visual section header for RSI Cross filter.
* Use_RSI_Cross_Filter (Default: false) -> Enables or disables RSI threshold crossover confirmation on Bar 1.
* RSI_Length (Default: 14) -> Averaging period for RSI calculation (bars).
* RSI_Price_Source (Default: PRICE_CLOSE) -> Applied price series used for RSI calculation.
* RSI_Oversold (Default: 30.0) -> Oversold threshold level that RSI must cross above for BUY signals.
* RSI_Overbought (Default: 70.0) -> Overbought threshold level that RSI must cross below for SELL signals.
Filter Module 2: ADX Trend Filter
* InpFilter2 (Default: "=== 2. ADX FILTER ===") -> Visual section header for ADX filter.
* Use_ADX_Filter (Default: false) -> Enables or disables minimum trend strength filtering using ADX.
* ADX_Period (Default: 10) -> Calculation period for the ADX indicator (bars).
* ADX_Min_Level (Default: 20.0) -> Minimum ADX main line value required to validate a signal.
Filter Module 3: Single Moving Average Filter
* InpFilter3 (Default: "=== 3. SINGLE MA FILTER ===") -> Visual section header for Single MA filter.
* Use_MA_Filter (Default: false) -> Enables or disables price-versus-Moving-Average trend alignment.
* MA_Period (Default: 50) -> Averaging period for the Moving Average (bars).
* MA_Method (Default: MODE_SMA) -> Smoothing method (SMA, EMA, SMMA, or LWMA).
* MA_Shift (Default: 0) -> Horizontal bar shift applied to the Moving Average (bars).
Filter Module 4: Ichimoku Senkou Span B Filter
* InpFilter4 (Default: "=== 4. ICHIMOKU SENKOU SPAN B FILTER ===") -> Visual section header for Ichimoku filter.
* Use_Ichimoku_Filter (Default: false) -> Enables or disables price filtering relative to the Ichimoku Senkou Span B line.
* Ichimoku_Tenkan (Default: 9) -> Tenkan-sen (Conversion Line) period (bars).
* Ichimoku_Kijun (Default: 26) -> Kijun-sen (Base Line) period (bars).
* Ichimoku_SenkouB (Default: 52) -> Senkou Span B (Leading Span B) period (bars).
Filter Module 5: RSI 75 Momentum Filter
* InpFilter5 (Default: "=== 5. RSI 75 FILTER ===") -> Visual section header for long-period RSI midline filter.
* Use_RSI75_Filter (Default: false) -> Enables or disables directional midline (50.0) filtering using a slow RSI.
* RSI_Filter_Period (Default: 75) -> Averaging period for the slow RSI filter (bars).
Filter Module 6: Double Moving Average Filter
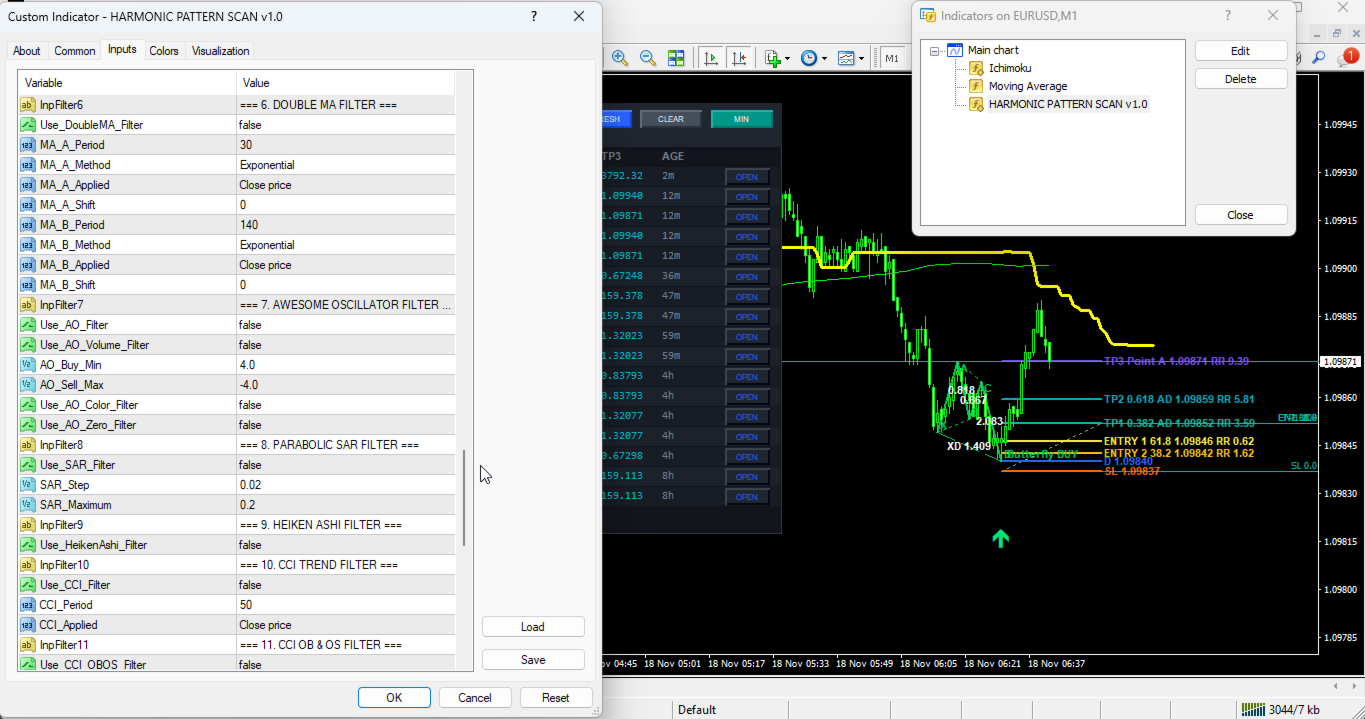
* InpFilter6 (Default: "=== 6. DOUBLE MA FILTER ===") -> Visual section header for Dual MA trend filter.
* Use_DoubleMA_Filter (Default: false) -> Enables or disables fast-versus-slow Moving Average trend alignment.
* MA_A_Period (Default: 30) -> Period for fast Moving Average A (bars).
* MA_A_Method (Default: MODE_EMA) -> Smoothing method for Moving Average A.
* MA_A_Applied (Default: PRICE_CLOSE) -> Applied price type for Moving Average A.
* MA_A_Shift (Default: 0) -> Horizontal bar shift for Moving Average A (bars).
* MA_B_Period (Default: 140) -> Period for slow Moving Average B (bars).
* MA_B_Method (Default: MODE_EMA) -> Smoothing method for Moving Average B.
* MA_B_Applied (Default: PRICE_CLOSE) -> Applied price type for Moving Average B.
* MA_B_Shift (Default: 0) -> Horizontal bar shift for Moving Average B (bars).
Filter Module 7: Awesome Oscillator Filter
* InpFilter7 (Default: "=== 7. AWESOME OSCILLATOR FILTER ===") -> Visual section header for Awesome Oscillator filter.
* Use_AO_Filter (Default: false) -> Enables or disables Awesome Oscillator momentum confirmation.
* Use_AO_Volume_Filter (Default: false) -> Requires AO value to exceed minimum magnitude thresholds.
* AO_Buy_Min (Default: 4.0) -> Minimum AO value required for BUY signals when volume filter is active.
* AO_Sell_Max (Default: -4.0) -> Maximum AO value allowed for SELL signals when volume filter is active.
* Use_AO_Color_Filter (Default: false) -> Requires AO histogram slope to rise for BUY or fall for SELL.
* Use_AO_Zero_Filter (Default: false) -> Requires AO to be above zero and rising for BUY, or below zero and falling for SELL.
Filter Module 8: Parabolic SAR Filter
* InpFilter8 (Default: "=== 8. PARABOLIC SAR FILTER ===") -> Visual section header for Parabolic SAR filter.
* Use_SAR_Filter (Default: false) -> Enables or disables Parabolic SAR trend direction filtering.
* SAR_Step (Default: 0.02) -> Acceleration factor step increment for Parabolic SAR.
* SAR_Maximum (Default: 0.2) -> Maximum acceleration factor cap for Parabolic SAR.
Filter Module 9: Heiken Ashi Candle Filter
* InpFilter9 (Default: "=== 9. HEIKEN ASHI FILTER ===") -> Visual section header for Heiken Ashi filter.
* Use_HeikenAshi_Filter (Default: false) -> Enables or disables smoothed Heiken Ashi candle polarity confirmation on Bar 1.
Filter Module 10: CCI Trend Filter
* InpFilter10 (Default: "=== 10. CCI TREND FILTER ===") -> Visual section header for CCI zero-line trend filter.
* Use_CCI_Filter (Default: false) -> Enables or disables CCI zero-line directional filtering.
* CCI_Period (Default: 50) -> Calculation period for the trend CCI (bars).
* CCI_Applied (Default: PRICE_CLOSE) -> Applied price series for the trend CCI.
Filter Module 11: CCI Overbought/Oversold Filter
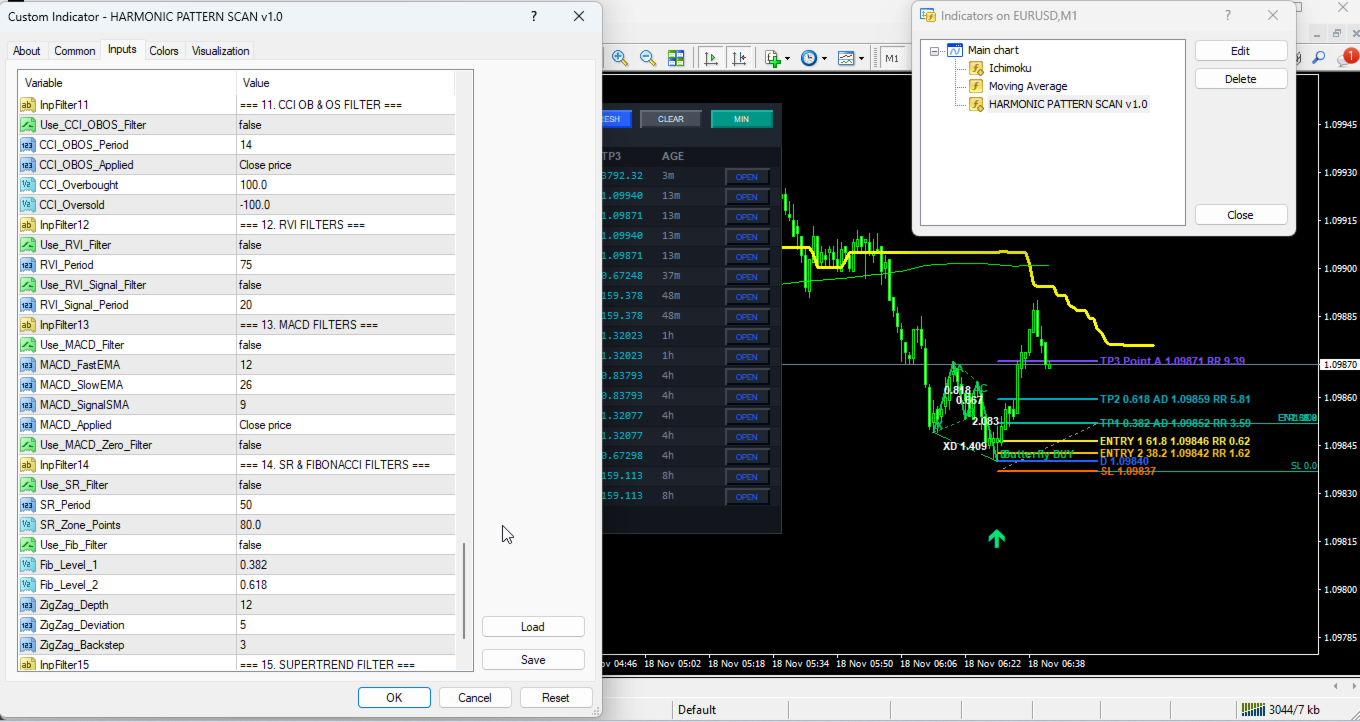
* InpFilter11 (Default: "=== 11. CCI OB & OS FILTER ===") -> Visual section header for CCI extreme zone filter.
* Use_CCI_OBOS_Filter (Default: false) -> Enables or disables CCI threshold filtering.
* CCI_OBOS_Period (Default: 14) -> Calculation period for the OB/OS CCI (bars).
* CCI_OBOS_Applied (Default: PRICE_CLOSE) -> Applied price series for the OB/OS CCI.
* CCI_Overbought (Default: 100.0) -> Upper CCI threshold level.
* CCI_Oversold (Default: -100.0) -> Lower CCI threshold level.
Filter Module 12: RVI Trend and Signal Filters
* InpFilter12 (Default: "=== 12. RVI FILTERS ===") -> Visual section header for Relative Vigor Index filters.
* Use_RVI_Filter (Default: false) -> Enables or disables RVI main line zero-level directional filtering.
* RVI_Period (Default: 75) -> Calculation period for the RVI trend filter (bars).
* Use_RVI_Signal_Filter (Default: false) -> Enables or disables RVI main-versus-signal line alignment.
* RVI_Signal_Period (Default: 20) -> Calculation period for the RVI signal crossover filter (bars).
Filter Module 13: MACD Histogram and Zero Filters
* InpFilter13 (Default: "=== 13. MACD FILTERS ===") -> Visual section header for MACD filters.
* Use_MACD_Filter (Default: false) -> Enables or disables MACD histogram polarity filtering (Main minus Signal).
* MACD_FastEMA (Default: 12) -> Fast EMA period for MACD (bars).
* MACD_SlowEMA (Default: 26) -> Slow EMA period for MACD (bars).
* MACD_SignalSMA (Default: 9) -> Signal line SMA period for MACD (bars).
* MACD_Applied (Default: PRICE_CLOSE) -> Applied price series for MACD calculation.
* Use_MACD_Zero_Filter (Default: false) -> Enables or disables MACD main line filtering relative to the zero line.
Filter Module 14: Support/Resistance and Fibonacci Filters
* InpFilter14 (Default: "=== 14. SR & FIBONACCI FILTERS ===") -> Visual section header for SR and Fibonacci filters.
* Use_SR_Filter (Default: false) -> Enables or disables proximity filtering near recent lookback Support or Resistance extremes.
* SR_Period (Default: 50) -> Lookback bar window used to identify local Support and Resistance highs/lows (bars).
* SR_Zone_Points (Default: 80) -> Proximity tolerance zone around Support/Resistance levels (points).
* Use_Fib_Filter (Default: false) -> Enables or disables ZigZag swing Fibonacci retracement zone confluence.
* Fib_Level_1 (Default: 0.382) -> First Fibonacci retracement boundary ratio.
* Fib_Level_2 (Default: 0.618) -> Second Fibonacci retracement boundary ratio.
* ZigZag_Depth (Default: 12) -> Minimum bar depth for ZigZag swing detection (bars).
* ZigZag_Deviation (Default: 5) -> Minimum price deviation for ZigZag swing detection (points).
* ZigZag_Backstep (Default: 3) -> Minimum bar separation between alternating ZigZag swings (bars).
Filter Module 15: Supertrend Filter
* InpFilter15 (Default: "=== 15. SUPERTREND FILTER ===") -> Visual section header for ATR Supertrend filter.
* Use_Supertrend_Filter (Default: false) -> Enables or disables Wilder ATR-based Supertrend directional filtering.
* ST_AtrPeriod (Default: 10) -> Average True Range period for Supertrend volatility bands (bars).
* ST_Factor (Default: 3.0) -> ATR multiplier determining Supertrend band width.
Risk Disclaimer
Trading foreign exchange, commodities, indices, and other financial instruments carries a high level of risk and may not be suitable for all investors. Past performance or historical pattern behavior does not guarantee future results. This indicator is strictly an analytical and visual scanning utility designed to assist traders with technical chart analysis; it does not execute automated trades or guarantee financial profit. Always test this product thoroughly on a demo account to understand its operational behavior before using it in live trading environments.