RSI Divergence Multi Pair Timeframe Scan Dashboard
- Indicadores
- Versão: 1.0
- Ativações: 5

RSI Divergence Multi Pair Timeframe Scan Dashboard
Overview
- Product Type: Multi-symbol, multi-timeframe technical analysis indicator and interactive market dashboard scanner for MetaTrader 4 (MT4).
- Core Purpose: Continuously monitors configured currency pairs, precious metals, indices, or active Market Watch symbols across multiple chart timeframes simultaneously to identify Regular and Hidden Relative Strength Index (RSI) divergence setups in one unified terminal window.
- Structured Trade Planning Aid: Calculates and displays a reference Entry price, a swing or Average True Range (ATR) Stop Loss (SL), and three Risk-to-Reward Take Profit targets (TP1 at 1:1, TP2 at 1:2, and TP3 at 1:3) for every validated divergence setup.
- Modular 15-Filter Confirmation Suite: Integrates 15 optional technical confirmation modules covering trend direction, trend strength, oscillator momentum, candlestick smoothing, Support/Resistance zones, Fibonacci retracement levels, and ATR volatility bands to refine candidate signals.
Operating Principle
- Stage 1 - Swing Pivot and RSI Divergence Detection: During each scheduled timer scan, the engine evaluates historical price bars within the configured lookback depth for every active symbol and timeframe pair. It locates confirmed swing highs and swing lows governed by left and right bar confirmation counts, comparing consecutive price swing extremes against RSI values to classify four divergence structures: Regular Bullish Divergence (price forms a lower low while RSI forms a higher low), Regular Bearish Divergence (price forms a higher high while RSI forms a lower high), Hidden Bullish Divergence (price forms a higher low while RSI forms a lower low), and Hidden Bearish Divergence (price forms a lower high while RSI forms a higher high).
- Stage 2 - Multi-Filter Confluence Validation: When one or more filters in the 15-filter suite are enabled, each candidate divergence setup is evaluated against every active filter rule on that symbol and timeframe. All enabled filters operate on an AND-logic basis, displaying setups and dispatching alerts only when all active criteria are satisfied simultaneously.
- Stage 3 - Reference Entry, SL, and TP Calculation: Anchors the reference Entry price to the close of the confirmed signal bar and sets the initial Stop Loss at the corresponding price swing low (bullish) or swing high (bearish). If that swing extremum does not lie on the protective side of the entry price, an ATR-based fallback SL distance is applied. Based on the entry-to-SL risk distance (1R), three Take Profit targets are projected: TP1 at 1.0R (1:1 RR), TP2 at 2.0R (1:2 RR), and TP3 at 3.0R (1:3 RR).
- Signal Validity and Repaint Behavior: Pivot confirmation requires a defined number of completed bars to the right of each swing point, and reference entry and target prices are anchored to closed bar data (Bar 1). Once a swing pivot and its confirmation bars close, historical divergence markings on completed bars do not repaint. However, during live multi-bar scanning across the active search window, if a newer valid swing pivot forms on a symbol and timeframe, the scanner updates that pair's active row in the dashboard and redraws the current chart overlay.
- Buy Signal Conditions: Generated when Regular Bullish or Hidden Bullish RSI divergence is confirmed on closed pivot bars (with its pattern toggle enabled) and passes all enabled confirmation filters.
- Sell Signal Conditions: Generated when Regular Bearish or Hidden Bearish RSI divergence is confirmed on closed pivot bars (with its pattern toggle enabled) and passes all enabled confirmation filters.
- Exit Reference Conditions: As an analytical technical indicator rather than an automated trading robot, this tool does not open, modify, or close orders automatically; it plots SL, TP1 (1:1 RR), TP2 (1:2 RR), and TP3 (1:3 RR) horizontal reference lines for manual trade management.
Key Features
- Multi-Pair and Multi-Timeframe Matrix Scanner: Monitors custom symbol lists or visible Market Watch pairs across M1, M5, M15, M30, H1, H4, and D1 simultaneously in one chart instance.
- Independent Regular and Hidden Divergence Toggles: Enable Regular divergence for reversal setups, Hidden divergence for trend-continuation pullbacks, or both together.
- Integrated 15-Filter Confirmation Suite: Combine RSI divergence with up to 15 built-in confirmation modules without attaching separate indicators to the chart.
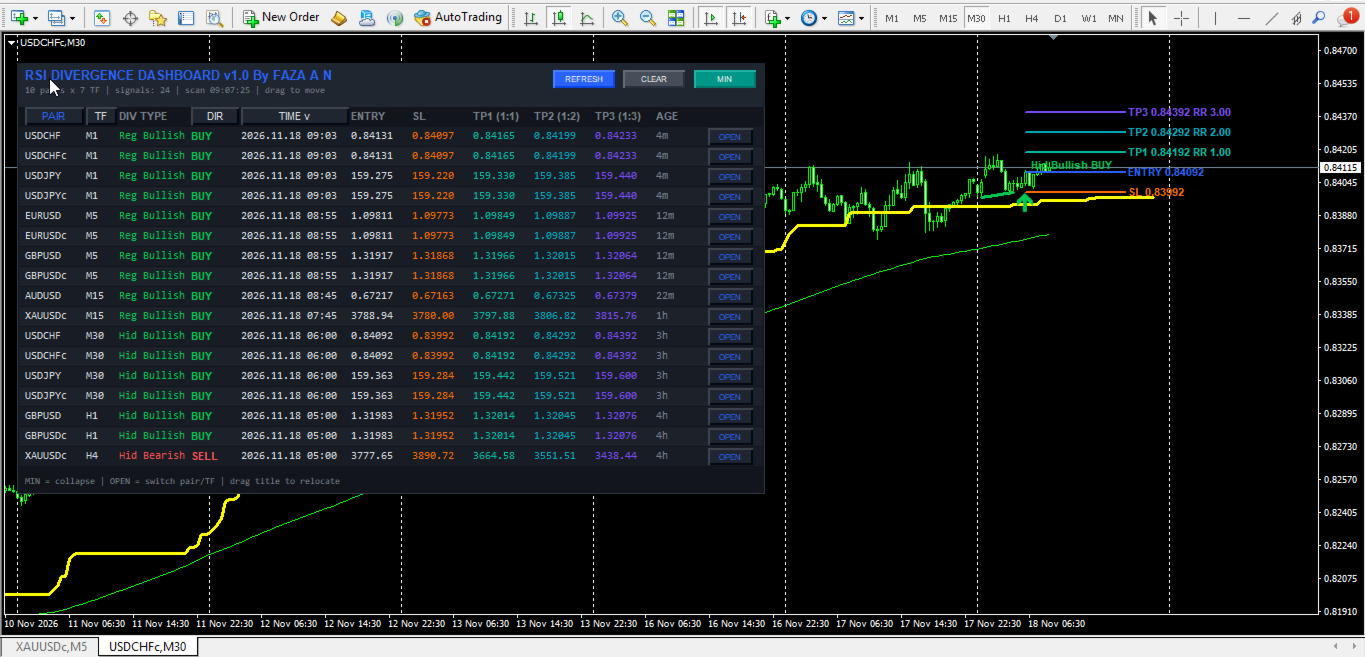
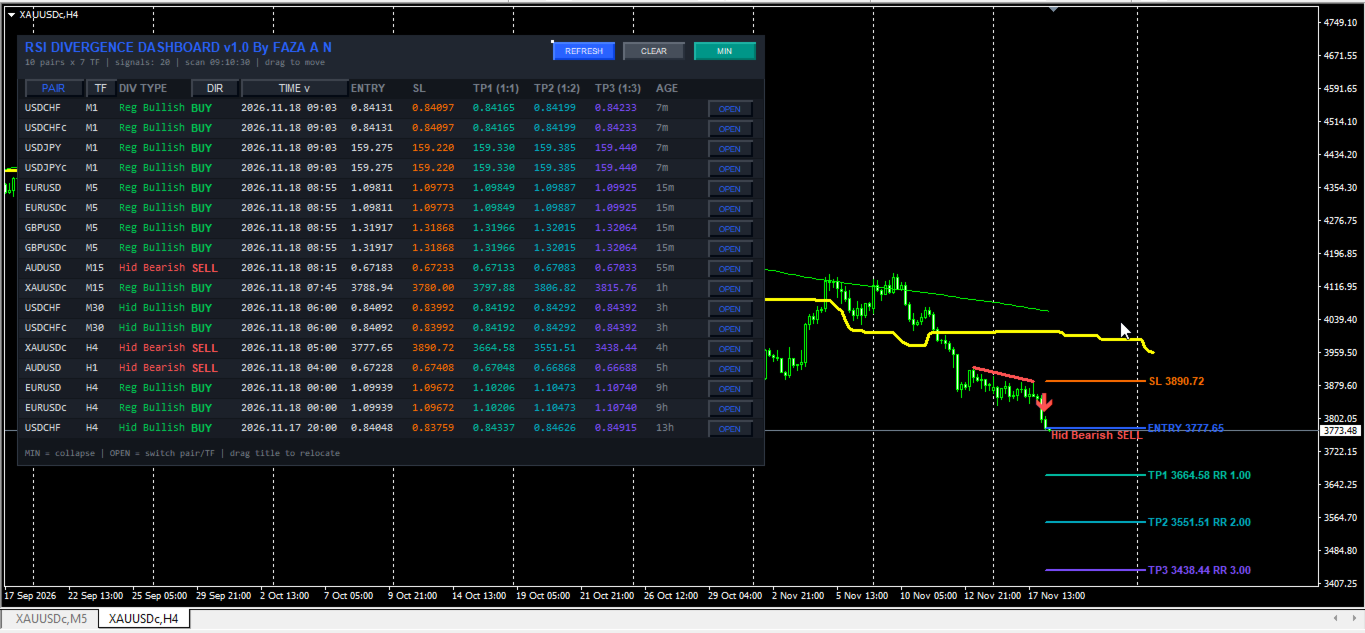
- Interactive 12-Column Sortable Dashboard: Displays PAIR, TF, DIV TYPE, DIR, TIME, ENTRY, SL, TP1 (1:1), TP2 (1:2), TP3 (1:3), AGE, and an OPEN button, with one-click column header sorting by Time, Pair, Timeframe, or Direction.
- Draggable, Scalable, and Collapsible UI: Drag the header bar to reposition the panel, scale dimensions from 70% to 180%, or collapse into a compact status bar via MIN/MAX with coordinates preserved across chart timeframe switches.
- Automated On-Chart Visual Overlays: Draws price divergence trendlines, directional Wingdings signal arrows, pattern labels, and extended horizontal lines with price and Risk-to-Reward tags for Entry, SL, TP1, TP2, and TP3.
- Multi-Channel Alert System: Supports MT4 pop-up alerts, audible sound alerts (alert.wav), and mobile push notifications via MetaQuotes ID with duplicate-bar suppression.
15-Filter Confirmation Suite Overview
- Filter 1 - RSI Cross Filter: Confirms momentum shifts by requiring a secondary RSI oscillator to cross upward above the oversold level for BUY setups or downward below the overbought level for SELL setups.
- Filter 2 - ADX Trend Strength Filter: Measures directional trend intensity via the Average Directional Index (ADX) main line, accepting signals only when ADX meets or exceeds the minimum threshold.
- Filter 3 - Single Moving Average Filter: Aligns setups with baseline trend direction by requiring price to trade above a configurable Moving Average (SMA, EMA, SMMA, or LWMA) for BUY signals and below it for SELL signals.
- Filter 4 - Ichimoku Senkou Span B Filter: Evaluates long-term trend bias by requiring price to hold above the Ichimoku Senkou Span B line for bullish setups and below it for bearish setups.
- Filter 5 - RSI 75 Midline Filter: Uses a long-period RSI (default 75 bars) relative to the 50.0 neutral midline to confirm sustained bullish (>50) or bearish (<50) momentum regimes.
- Filter 6 - Double Moving Average Filter: Checks trend alignment between a fast Moving Average (MA A) and a slow Moving Average (MA B), requiring MA A > MA B for BUY signals and MA A < MA B for SELL signals.
- Filter 7 - Awesome Oscillator (AO) Filter: Provides three momentum sub-checks using Bill Williams' Awesome Oscillator: minimum AO magnitude thresholds, histogram slope direction (rising for BUY, falling for SELL), and zero-line polarity alignment.
- Filter 8 - Parabolic SAR Filter: Confirms directional price positioning relative to Parabolic Stop and Reverse dots (price above SAR for BUY, below SAR for SELL).
- Filter 9 - Heiken Ashi Filter: Evaluates smoothed Heiken Ashi candle body polarity, confirming bullish closes (HA Close > HA Open) for BUY and bearish closes (HA Close < HA Open) for SELL.
- Filter 10 - CCI Trend Filter: Uses a long-period Commodity Channel Index (default 50 bars) relative to the zero axis (CCI > 0 for BUY, CCI < 0 for SELL) to filter directional bias.
- Filter 11 - CCI Overbought and Oversold Filter: Evaluates short-period CCI momentum extremes relative to upper (+100) and lower (-100) threshold levels.
- Filter 12 - RVI Trend and Signal Filters: Supports Relative Vigor Index main line positioning relative to zero and RVI main versus signal line alignment.
- Filter 13 - MACD Histogram and Zero-Line Filters: Validates momentum using MACD histogram polarity (Main minus Signal line) and optional MACD main line positioning relative to the zero axis.
- Filter 14 - Support/Resistance and ZigZag Fibonacci Filters: Checks whether price is interacting with recent Support/Resistance zones within a point tolerance buffer or trading inside a ZigZag-anchored Fibonacci retracement zone (default 38.2% to 61.8%).
- Filter 15 - Supertrend Filter: Calculates an ATR-based Supertrend volatility trailing band to align divergence signals with the prevailing Supertrend bullish or bearish regime.
Dashboard GUI Controls, Performance, and Setup Recommendations
- Header Controls and Chart Switching: The dashboard header shows live scan telemetry (pairs count, timeframes count, active signals, and scan timestamp) plus three buttons: REFRESH (reloads symbols/filters and runs an immediate scan), CLEAR (removes dashboard objects), and MIN/MAX (collapses/expands the table). Clicking OPEN on any row switches the active chart to that symbol and timeframe and plots its divergence overlay.
- Color Coding Reference: Green (default RGB 0,200,83) marks bullish divergence types, BUY tags, upward arrows, and bullish trendlines. Red (default RGB 255,82,82) marks bearish divergence types, SELL tags, downward arrows, and bearish trendlines. Blue (default RGB 41,98,255) marks the title, active sort header, OPEN buttons, and dotted Entry line. Orange marks Stop Loss, while Teal, Cyan, and Purple mark TP1 (1:1), TP2 (1:2), and TP3 (1:3) targets. Muted gray displays status and signal age.
- CPU and Memory Efficiency: Multi-pair, multi-timeframe scanning processes historical bars and filter buffers on each timer cycle. Control load via InpMaxSymbols (default: 10), InpBarsCopy (default: 900 bars), and InpScanSec (default: 5 seconds). On PCs or VPS setups with limited CPU/RAM, run a single scanner instance on one dedicated chart and keep unused filters disabled.
- Supported Instruments and Timeframes: Suitable for major/minor Forex pairs (EURUSD, GBPUSD, USDJPY, AUDUSD, USDCAD, USDCHF, NZDUSD, EURJPY, GBPJPY), metals (XAUUSD), indices, and Market Watch instruments across M1–D1 (M15/M30/H1 for intraday; H4/D1 for swing analysis).
- Broker and Account Compatibility: Compatible with both Hedging and Netting MT4 accounts. Low-spread ECN accounts are recommended for lower timeframes (M1–M15), and a standard VPS is helpful for continuous 24/5 alert delivery.
Input Parameters Documentation
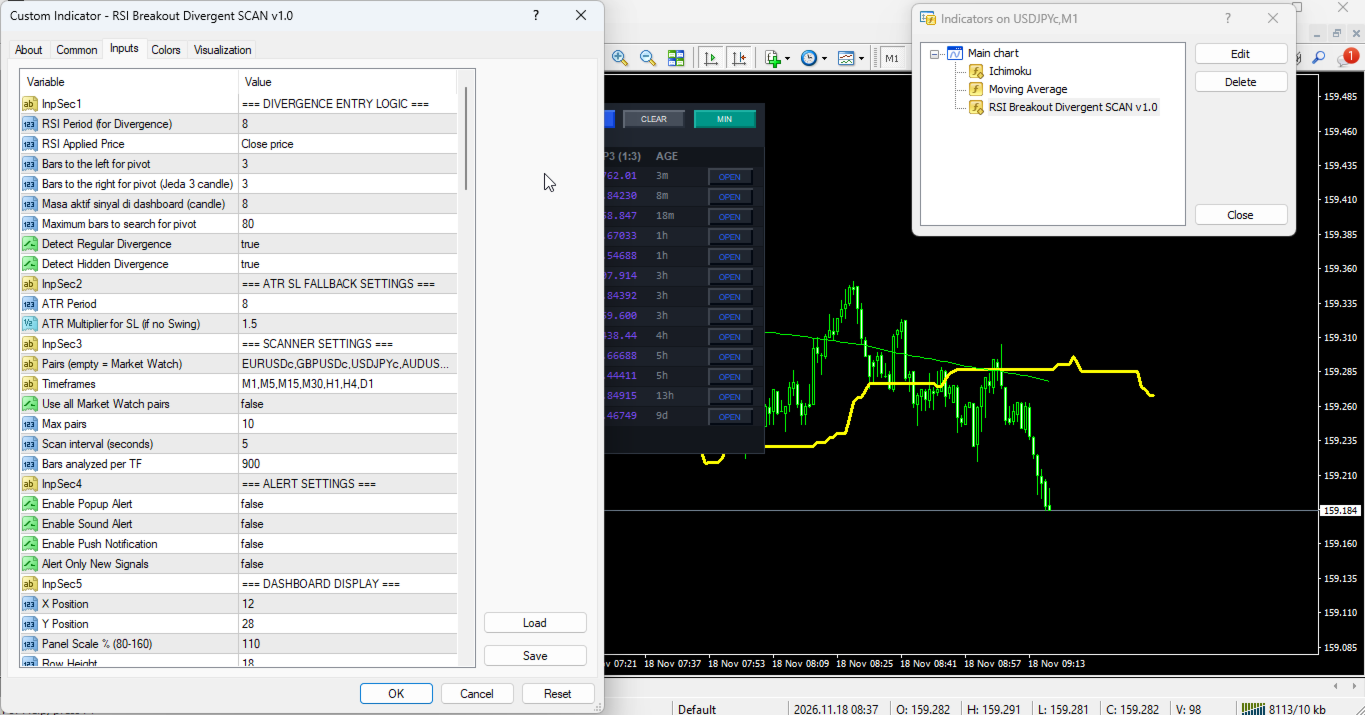
1. Divergence Entry Logic
- InpSec1 (Default: "=== DIVERGENCE ENTRY LOGIC ===") -> Section header in MT4 Inputs for divergence parameters.
- RSI_Period (Default: 8) -> Lookback period in bars for RSI divergence calculation.
- RSI_Price (Default: PRICE_CLOSE) -> Applied candle price type for RSI calculation.
- Swing_Left (Default: 3) -> Bars left of a candle required to confirm a swing pivot.
- Swing_Right (Default: 3) -> Bars right of a candle required to confirm a swing pivot.
- Lookback (Default: 80) -> Maximum backward search range in bars for a prior swing pivot.
- Show_Regular (Default: true) -> Enables Regular Bullish and Bearish divergence detection.
- Show_Hidden (Default: true) -> Enables Hidden Bullish and Bearish divergence detection.
2. ATR SL Fallback Settings
- InpSec2 (Default: "=== ATR SL FALLBACK SETTINGS ===") -> Section header for ATR SL fallback settings.
- InpATRPeriod (Default: 8) -> Lookback period in bars for ATR volatility calculation.
- InpATRMult (Default: 1.5) -> ATR multiplier in price units for fallback SL distance when swing SL is invalid.
3. Scanner Settings
- InpSec3 (Default: "=== SCANNER SETTINGS ===") -> Section header for scanner configuration.
- InpSymbols (Default: "EURUSD,GBPUSD,USDJPY,AUDUSD,USDCAD,USDCHF,NZDUSD,EURJPY,GBPJPY,XAUUSD") -> Comma-separated symbols scanned when InpUseWatch is false.
- InpTimeframes (Default: "M1,M5,M15,M30,H1,H4,D1") -> Comma-separated timeframes scanned per active symbol.
- InpUseWatch (Default: true) -> Uses visible MT4 Market Watch symbols instead of InpSymbols when true.
- InpMaxSymbols (Default: 10) -> Maximum symbols loaded into the scanner matrix.
- InpScanSec (Default: 5) -> Scan timer interval in seconds (minimum 3 seconds enforced).
- InpBarsCopy (Default: 900) -> Maximum historical bars analyzed per symbol and timeframe per scan.
4. Alert Settings
- InpSec4 (Default: "=== ALERT SETTINGS ===") -> Section header for signal alert options.
- InpAlertPopup (Default: true) -> Enables MT4 pop-up alert windows on signal detection.
- InpAlertSound (Default: true) -> Enables audible alert playback (alert.wav).
- InpAlertPush (Default: false) -> Enables mobile push notifications via MetaQuotes ID.
- InpAlertOnlyNew (Default: false) -> Flag option for restricting alerts to new signal bars.
5. Dashboard Display
- InpSec5 (Default: "=== DASHBOARD DISPLAY ===") -> Section header for dashboard layout and sorting.
- InpX (Default: 12) -> Initial horizontal X offset in pixels from left chart edge.
- InpY (Default: 28) -> Initial vertical Y offset in pixels from upper chart edge.
- InpScale (Default: 110) -> UI scaling percentage (clamped between 70% and 180%).
- InpRowH (Default: 18) -> Base row height in pixels for dashboard signal rows.
- InpFont (Default: 7) -> Base font size in points for dashboard text.
- InpPadX (Default: 7) -> Horizontal inner padding in pixels on panel sides.
- InpWPair (Default: 55) -> Base width in pixels for PAIR column.
- InpWTF (Default: 30) -> Base width in pixels for TF column.
- InpWPola (Default: 65) -> Base width in pixels for DIV TYPE column.
- InpWArah (Default: 45) -> Base width in pixels for DIR column.
- InpWTime (Default: 100) -> Base width in pixels for TIME column.
- InpWEntry (Default: 55) -> Base width in pixels for ENTRY column.
- InpWSL (Default: 55) -> Base width in pixels for SL column.
- InpWTP1 (Default: 55) -> Base width in pixels for TP1 (1:1) column.
- InpWTP2 (Default: 55) -> Base width in pixels for TP2 (1:2) column.
- InpWTP3 (Default: 55) -> Base width in pixels for TP3 (1:3) column.
- InpWUmur (Default: 45) -> Base width in pixels for AGE column.
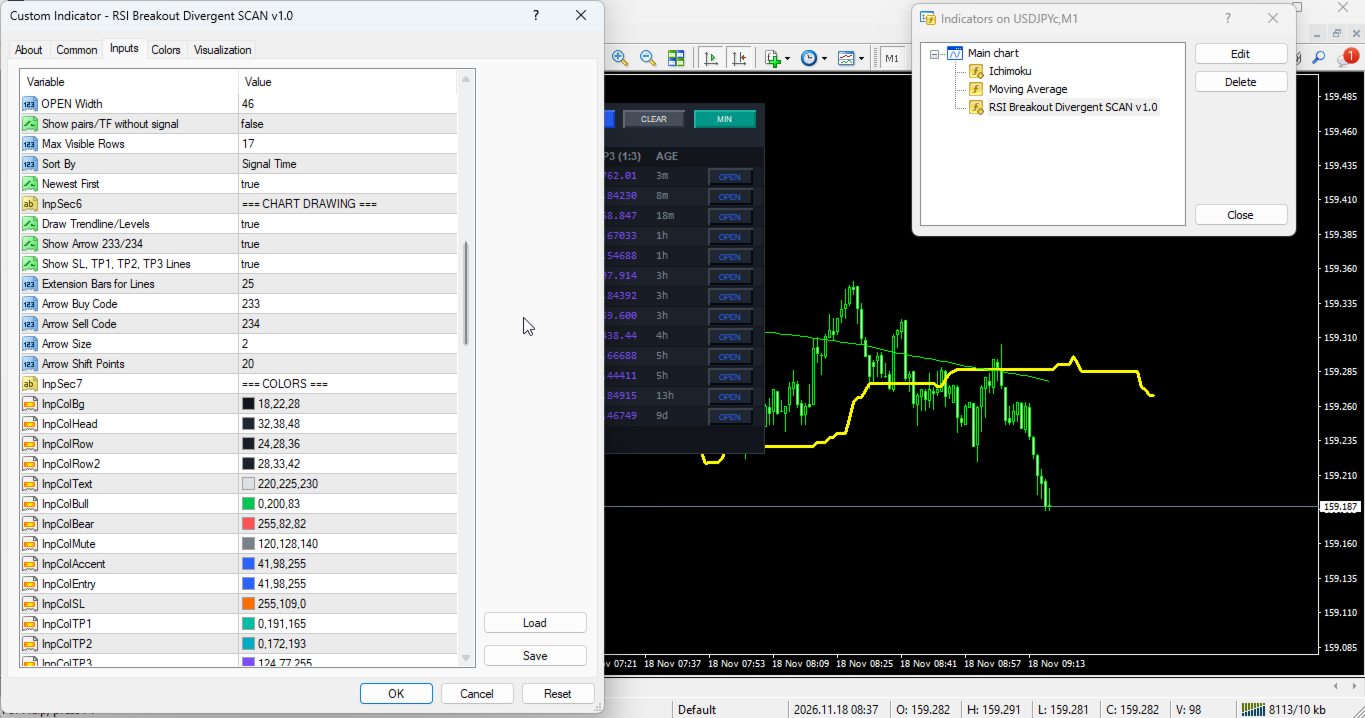
- InpWOpen (Default: 46) -> Base width in pixels for OPEN button column.
- InpShowEmpty (Default: false) -> Shows symbol/timeframe rows even without an active signal.
- InpMaxRows (Default: 17) -> Maximum visible signal rows in dashboard table.
- InpSortBy (Default: SORT_TIME) -> Default sort criterion (SORT_TIME, SORT_PAIR, SORT_TF, or SORT_DIR).
- InpSortNewest (Default: true) -> Sorts descending (newest first by time) when true.
6. Chart Drawing
- InpSec6 (Default: "=== CHART DRAWING ===") -> Section header for chart overlay inputs.
- InpDrawOnChart (Default: true) -> Enables drawing divergence lines and levels on active chart.
- InpShowArrow (Default: true) -> Enables Wingdings signal arrows on chart.
- InpShowLevels (Default: true) -> Enables Entry, SL, TP1, TP2, and TP3 lines and price labels.
- InpExtendBars (Default: 25) -> Bars to the right that Entry, SL, and TP lines extend.
- InpArrowCodeBuy (Default: 233) -> Wingdings arrow code for bullish BUY signals.
- InpArrowCodeSell (Default: 234) -> Wingdings arrow code for bearish SELL signals.
- InpArrowSize (Default: 2) -> Arrow width size in visual units.
- InpArrowShiftPts (Default: 20) -> Vertical offset in broker points between candle and arrow.
7. Colors
- InpSec7 (Default: "=== COLORS ===") -> Section header for UI and chart color settings.
- InpColBg (Default: C'18,22,28') -> Main dashboard background color.
- InpColHead (Default: C'32,38,48') -> Dashboard header and sort button background color.
- InpColRow (Default: C'24,28,36') -> Even table row background color.
- InpColRow2 (Default: C'28,33,42') -> Odd table row background color.
- InpColText (Default: C'220,225,230') -> Primary text color for pair, TF, time, and entry.
- InpColBull (Default: C'0,200,83') -> Color for bullish text, BUY labels, arrows, and lines.
- InpColBear (Default: C'255,82,82') -> Color for bearish text, SELL labels, arrows, and lines.
- InpColMute (Default: C'120,128,140') -> Muted gray color for status, age, and inactive cells.
- InpColAccent (Default: C'41,98,255') -> Accent color for title, active sort header, and OPEN buttons.
- InpColEntry (Default: C'41,98,255') -> Color for dotted Entry line and label.
- InpColSL (Default: C'255,109,0') -> Color for SL text and dashed SL chart line.
- InpColTP1 (Default: C'0,191,165') -> Color for TP1 (1:1 RR) text and target line.
- InpColTP2 (Default: C'0,172,193') -> Color for TP2 (1:2 RR) text and target line.
- InpColTP3 (Default: C'124,77,255') -> Color for TP3 (1:3 RR) text and target line.
8. Filter 1: RSI Cross Filter
- InpFilter1 (Default: "=== 1. RSI CROSS FILTER ===") -> Section header for Filter 1.
- Use_RSI_Cross_Filter (Default: false) -> Enables RSI oversold/overbought cross confirmation.
- RSI_Length (Default: 14) -> Lookback period in bars for RSI Cross Filter.
- RSI_Price_Source (Default: PRICE_CLOSE) -> Applied price type for RSI Cross and RSI 75 filters.
- RSI_Oversold (Default: 30.0) -> Oversold level (0-100) RSI crosses above for bullish setups.
- RSI_Overbought (Default: 70.0) -> Overbought level (0-100) RSI crosses below for bearish setups.
9. Filter 2: ADX Filter
- InpFilter2 (Default: "=== 2. ADX FILTER ===") -> Section header for Filter 2.
- Use_ADX_Filter (Default: false) -> Enables ADX trend strength filtering.
- ADX_Period (Default: 10) -> Calculation period in bars for ADX.
- ADX_Min_Level (Default: 20.0) -> Minimum ADX main value required for trend strength.
10. Filter 3: Single MA Filter
- InpFilter3 (Default: "=== 3. SINGLE MA FILTER ===") -> Section header for Filter 3.
- Use_MA_Filter (Default: false) -> Enables price-versus-MA trend direction filtering.
- MA_Period (Default: 50) -> Averaging period in bars for Single MA Filter.
- MA_Method (Default: MODE_SMA) -> Smoothing method (SMA, EMA, SMMA, LWMA) for Single MA.
- MA_Shift (Default: 0) -> Horizontal shift in bars applied to Single MA.
11. Filter 4: Ichimoku Senkou Span B Filter
- InpFilter4 (Default: "=== 4. ICHIMOKU SENKOU SPAN B FILTER ===") -> Section header for Filter 4.
- Use_Ichimoku_Filter (Default: false) -> Enables price filtering relative to Ichimoku Senkou Span B.
- Ichimoku_Tenkan (Default: 9) -> Tenkan-sen period in bars.
- Ichimoku_Kijun (Default: 26) -> Kijun-sen period in bars.
- Ichimoku_SenkouB (Default: 52) -> Senkou Span B period in bars.
12. Filter 5: RSI 75 Filter
- InpFilter5 (Default: "=== 5. RSI 75 FILTER ===") -> Section header for Filter 5.
- Use_RSI75_Filter (Default: false) -> Enables long-period RSI 50-midline momentum filtering.
- RSI_Filter_Period (Default: 75) -> Lookback period in bars for midline RSI filter.
13. Filter 6: Double MA Filter
- InpFilter6 (Default: "=== 6. DOUBLE MA FILTER ===") -> Section header for Filter 6.
- Use_DoubleMA_Filter (Default: false) -> Enables dual MA alignment filtering (MA A vs MA B).
- MA_A_Period (Default: 30) -> Averaging period in bars for fast MA A.
- MA_A_Method (Default: MODE_EMA) -> Smoothing method for MA A.
- MA_A_Applied (Default: PRICE_CLOSE) -> Applied price source for MA A.
- MA_A_Shift (Default: 0) -> Horizontal shift in bars for MA A.
- MA_B_Period (Default: 140) -> Averaging period in bars for slow MA B.
- MA_B_Method (Default: MODE_EMA) -> Smoothing method for MA B.
- MA_B_Applied (Default: PRICE_CLOSE) -> Applied price source for MA B.
- MA_B_Shift (Default: 0) -> Horizontal shift in bars for MA B.
14. Filter 7: Awesome Oscillator Filter
- InpFilter7 (Default: "=== 7. AWESOME OSCILLATOR FILTER ===") -> Section header for Filter 7.
- Use_AO_Filter (Default: false) -> Main switch for Awesome Oscillator (AO) filtering.
- Use_AO_Volume_Filter (Default: false) -> Enables minimum AO magnitude threshold filtering.
- AO_Buy_Min (Default: 4.0) -> Minimum AO value required for bullish setups when volume filter is active.
- AO_Sell_Max (Default: -4.0) -> Maximum AO value permitted for bearish setups when volume filter is active.
- Use_AO_Color_Filter (Default: false) -> Requires AO histogram slope confirmation (rising for buy, falling for sell).
- Use_AO_Zero_Filter (Default: false) -> Requires AO slope confirmation on bullish (>0) or bearish (<0) side of zero.
15. Filter 8: Parabolic SAR Filter
- InpFilter8 (Default: "=== 8. PARABOLIC SAR FILTER ===") -> Section header for Filter 8.
- Use_SAR_Filter (Default: false) -> Enables Parabolic SAR price-position trend filtering.
- SAR_Step (Default: 0.02) -> Acceleration factor step increment for Parabolic SAR.
- SAR_Maximum (Default: 0.2) -> Maximum acceleration factor limit for Parabolic SAR.
16. Filter 9: Heiken Ashi Filter
- InpFilter9 (Default: "=== 9. HEIKEN ASHI FILTER ===") -> Section header for Filter 9.
- Use_HeikenAshi_Filter (Default: false) -> Enables smoothed Heiken Ashi candle body polarity confirmation.
17. Filter 10: CCI Trend Filter
- InpFilter10 (Default: "=== 10. CCI TREND FILTER ===") -> Section header for Filter 10.
- Use_CCI_Filter (Default: false) -> Enables CCI zero-line trend filtering.
- CCI_Period (Default: 50) -> Lookback period in bars for CCI Trend Filter.
- CCI_Applied (Default: PRICE_CLOSE) -> Applied price source for CCI Trend Filter.
18. Filter 11: CCI OB & OS Filter
- InpFilter11 (Default: "=== 11. CCI OB & OS FILTER ===") -> Section header for Filter 11.
- Use_CCI_OBOS_Filter (Default: false) -> Enables CCI overbought/oversold threshold filtering.
- CCI_OBOS_Period (Default: 14) -> Lookback period in bars for CCI OB/OS Filter.
- CCI_OBOS_Applied (Default: PRICE_CLOSE) -> Applied price source for CCI OB/OS Filter.
- CCI_Overbought (Default: 100.0) -> Upper CCI level required for bullish breakout confirmation.
- CCI_Oversold (Default: -100.0) -> Lower CCI level required for bearish breakdown confirmation.
19. Filter 12: RVI Filters
- InpFilter12 (Default: "=== 12. RVI FILTERS ===") -> Section header for Filter 12.
- Use_RVI_Filter (Default: false) -> Enables RVI zero-line trend filtering.
- RVI_Period (Default: 75) -> Calculation period in bars for RVI zero-line trend filter.
- Use_RVI_Signal_Filter (Default: false) -> Enables RVI main versus signal line alignment filtering.
- RVI_Signal_Period (Default: 20) -> Calculation period in bars for RVI main/signal line comparison.
20. Filter 13: MACD Filters
- InpFilter13 (Default: "=== 13. MACD FILTERS ===") -> Section header for Filter 13.
- Use_MACD_Filter (Default: false) -> Enables MACD histogram polarity filtering (Main vs Signal line).
- MACD_FastEMA (Default: 12) -> Fast EMA period in bars for MACD.
- MACD_SlowEMA (Default: 26) -> Slow EMA period in bars for MACD.
- MACD_SignalSMA (Default: 9) -> Signal SMA period in bars for MACD.
- MACD_Applied (Default: PRICE_CLOSE) -> Applied price source for MACD.
- Use_MACD_Zero_Filter (Default: false) -> Enables MACD main line zero-level trend filtering.
21. Filter 14: SR & Fibonacci Filters
- InpFilter14 (Default: "=== 14. SR & FIBONACCI FILTERS ===") -> Section header for Filter 14.
- Use_SR_Filter (Default: false) -> Enables Support and Resistance proximity zone filtering.
- SR_Period (Default: 50) -> Lookback period in bars for Support lows and Resistance highs.
- SR_Zone_Points (Default: 80) -> Tolerance buffer in broker points around Support/Resistance levels.
- Use_Fib_Filter (Default: false) -> Enables ZigZag-based Fibonacci retracement zone filtering.
- Fib_Level_1 (Default: 0.382) -> First Fibonacci retracement ratio boundary (38.2%).
- Fib_Level_2 (Default: 0.618) -> Second Fibonacci retracement ratio boundary (61.8%).
- ZigZag_Depth (Default: 12) -> Minimum bar depth used to identify ZigZag swings.
- ZigZag_Deviation (Default: 5) -> Minimum deviation in broker points between ZigZag swings.
- ZigZag_Backstep (Default: 3) -> Minimum spacing in bars between ZigZag highs or lows.
22. Filter 15: Supertrend Filter
- InpFilter15 (Default: "=== 15. SUPERTREND FILTER ===") -> Section header for Filter 15.
- Use_Supertrend_Filter (Default: false) -> Enables ATR Supertrend directional trend confirmation.
- ST_AtrPeriod (Default: 10) -> Wilder ATR period in bars for Supertrend calculation.
- ST_Factor (Default: 3.0) -> ATR multiplier setting Supertrend band distance from median price.
Risk Disclaimer
- Risk Notice: Trading foreign exchange, commodities, indices, and other leveraged financial instruments carries substantial risk of capital loss and may not be suitable for all investors. Past performance and historical divergence signals are not indicative of future results. This product is an analytical technical indicator and market scanner built solely to support chart analysis; it does not execute orders automatically, provide investment advice, or promise financial returns. Always test the indicator thoroughly on a MetaTrader 4 demo account before applying it to live trading decisions.