Flat Flag Patterns MT5
- Indicadores
-
Keijinro Mizutani
 Hello, I’m kotoha, a system designer focused on research-driven, rule-based trading tools for the MT5 platform.
My work centers on market structure analysis, swing dynamics, and Fibonacci-based logic. - Versão: 0.101
- Ativações: 5
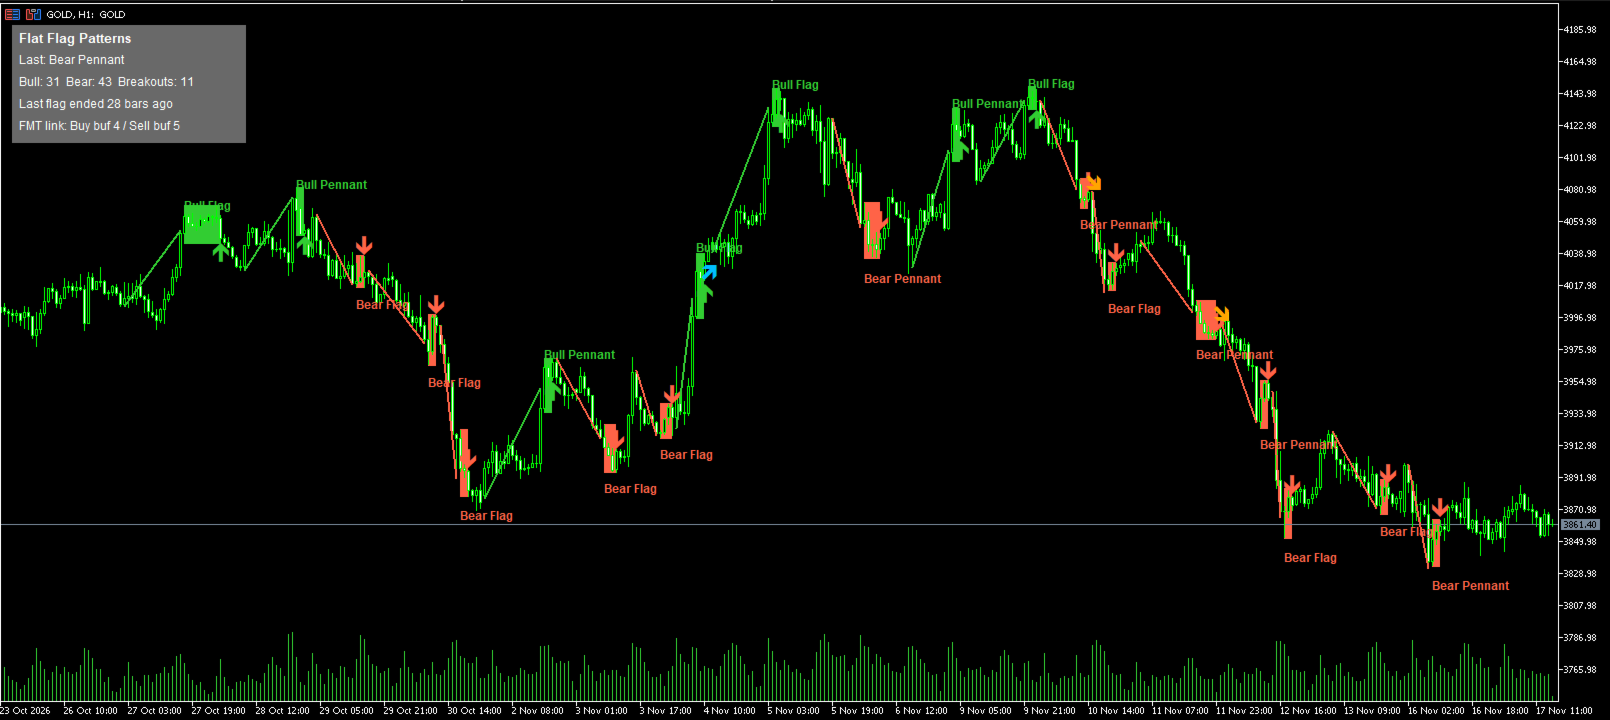
Flat Flag Patterns automatically detects and draws flag and pennant continuation patterns on your MT5 chart. It looks for a strong one-way move (the pole) followed by a small consolidation (the flag), and draws the pole line, the flag zone, a label and arrows directly on the chart.
Detection is normalised by volatility (ATR), so the same yardstick applies across symbols and timeframes. For the pole it also checks that the move was clean and one-directional — choppy two-way action does not count as a pole. For the flag it looks at the retracement depth against the pole and the width of the consolidation (the detailed combination of conditions is described in the included manual).
Patterns drawn:
- Bull Flag / Bear Flag: a consolidation after an up pole or a down pole
- Bull Pennant / Bear Pennant: when the range narrows into the later part of the consolidation, it is labelled as a pennant
- Breakout: a bar that closes outside the flag range is marked with a separate arrow
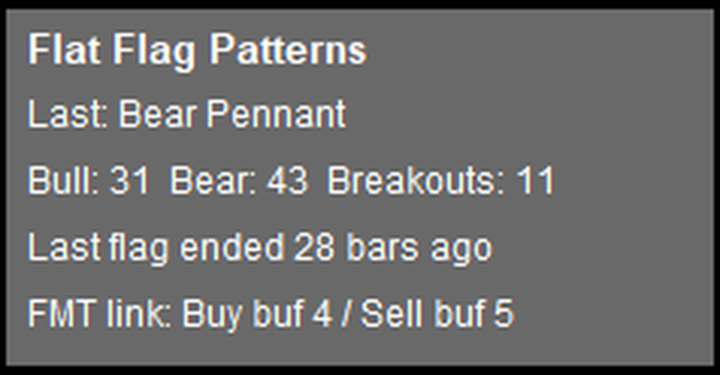
The panel (top-left by default) shows the latest pattern type, the counts of bull / bear patterns and breakouts within the scan range, and how many bars have passed since the latest flag. The panel can be dragged anywhere; its position is remembered per chart.
Buffers: 0 = Bull Flag, 1 = Bear Flag, 2 = Bull Breakout, 3 = Bear Breakout (display arrows). Buffers 4 = Buy and 5 = Sell are the linkage signals for Flat Manual Trader MT5 (FMT): a value of 1.0 is written only on the bar where a breakout is confirmed (edge type), and FMT can read the signal at shift 1. In linked use this indicator's parameters are fixed at their defaults, because the reading tool calls it without parameters.
Specifications: MetaTrader 5 (PC) only; works on any symbol and timeframe. Detection scans the most recent history bars (default 1,500) and draws up to the latest 30 patterns; both are adjustable. Detection results vary by symbol, timeframe and broker data. This indicator does not place orders.
Disclaimer: This product is a pattern-detection and display tool based on historical and current price data. It is not investment advice, not a prediction, and does not guarantee any future result or profit. Trading involves risk; decisions are your own responsibility.