Session Range and ADR Monitor
- Indicadores
- Versão: 1.20
- Atualizado: 11 novembro 2026

Session Range and ADR Monitor shows how far price has moved in each trading session and how that compares with what is normal for that session on the symbol you are watching.
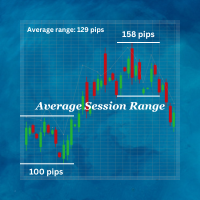
Many session indicators only shade the session hours. This indicator also measures each session. Every box is labelled with its range in points and a ratio to the average range of the same session over the previous 20 sessions. For example, "London 820 (64%)" means the London session has covered 820 points, which is 64% of its recent average. This helps you see at a glance whether a session is quiet or active compared with its own history, instead of comparing it with other sessions that behave differently.
What the indicator shows
- Session boxes for Asia, London and New York, each in its own colour, for the number of days you choose.
- A label on each box with the session range in points and its ratio to the session's recent average.
- A panel with the Average Daily Range (ADR) over a period you choose, today's range and the percentage of ADR used so far.
- The last range, average range, ratio and status (Active, Closed or Waiting) for each session.
- Optional dotted lines at the previous day's high and low.
Session times
Session times are entered in UTC. By default the indicator detects your broker's server offset from UTC automatically and converts the times. You can also set the offset manually, or enter times directly in broker server time. Sessions that cross midnight are supported. In the Strategy Tester the manual offset is used, because the tester does not provide the live UTC clock. The same offset is applied to all days shown, so if your broker changes offset for daylight saving time, older boxes may be shifted by one hour.
How it calculates
Session statistics are built from M5 data, so the boxes and figures are the same on every chart timeframe. ADR is the average high-to-low range of the last completed daily bars. Closed sessions do not change once they have finished. The current session box and its figures update while the session is running.
Data for Expert Advisors
The indicator has six buffers: Asia High, Asia Low, London High, London Low, New York High and New York Low. On timeframes up to H1 each buffer holds the running session high or low at each bar. A bar's value only uses bars up to and including that bar, so values on closed bars do not change. Outside a session the value is empty. The buffers can be read in the Data Window or with iCustom.
Inputs
Session times: time mode, manual offset, and start and end times for each session.
Statistics: number of sessions for the average range (default 20), number of days for ADR (default 14), number of days of boxes to draw (default 10).
Display: show or hide each session, box colours, show or hide range labels, label position, label font size, previous-day lines, panel, panel corner and position, colours and panel font size.
Label position
By default the labels are staggered so that sessions which overlap in time stay readable: the Asia label sits above the session high, the London label sits just inside the top of its box, and the New York label sits below the session low. You can instead place all labels above the session high or all below the session low, change the label font size, or hide the labels.
Notes
- Works on any symbol and timeframe that has M5 and daily history. Symbols that do not trade during a session will show "no data" for that session.
- If your broker has a short Sunday daily bar, it is included in the ADR average like any other daily bar.
- This indicator does not open, modify or close trades, and it does not give buy or sell signals. It is an analysis tool. Past ranges do not predict future ranges, and nothing in this indicator is financial advice.
Questions and suggestions are welcome in the comments section of this product.