Session Range and ADR Monitor

Session Range and ADR Monitor shows how far price has moved in each trading session and how that compares with what is normal for that session on the symbol you are watching.

Many session indicators only shade the session hours. This indicator also measures each session. Every box is labelled with its range in points and a ratio to the average range of the same session over the previous 20 sessions. For example, "London 820 (64%)" means the London session has covered 820 points, which is 64% of its recent average. This helps you see at a glance whether a session is quiet or active compared with its own history, instead of comparing it with other sessions that behave differently.

What the indicator shows

  • Session boxes for Asia, London and New York, each in its own colour, for the number of days you choose.
  • A label on each box with the session range in points and its ratio to the session's recent average.
  • A panel with the Average Daily Range (ADR) over a period you choose, today's range and the percentage of ADR used so far.
  • The last range, average range, ratio and status (Active, Closed or Waiting) for each session.
  • Optional dotted lines at the previous day's high and low.

Session times
Session times are entered in UTC. By default the indicator detects your broker's server offset from UTC automatically and converts the times. You can also set the offset manually, or enter times directly in broker server time. Sessions that cross midnight are supported. In the Strategy Tester the manual offset is used, because the tester does not provide the live UTC clock. The same offset is applied to all days shown, so if your broker changes offset for daylight saving time, older boxes may be shifted by one hour.

How it calculates
Session statistics are built from M5 data, so the boxes and figures are the same on every chart timeframe. ADR is the average high-to-low range of the last completed daily bars. Closed sessions do not change once they have finished. The current session box and its figures update while the session is running.

Data for Expert Advisors
The indicator has six buffers: Asia High, Asia Low, London High, London Low, New York High and New York Low. On timeframes up to H1 each buffer holds the running session high or low at each bar. A bar's value only uses bars up to and including that bar, so values on closed bars do not change. Outside a session the value is empty. The buffers can be read in the Data Window or with iCustom.

Inputs
Session times: time mode, manual offset, and start and end times for each session.
Statistics: number of sessions for the average range (default 20), number of days for ADR (default 14), number of days of boxes to draw (default 10).
Display: show or hide each session, box colours, show or hide range labels, label position, label font size, previous-day lines, panel, panel corner and position, colours and panel font size.

Label position
By default the labels are staggered so that sessions which overlap in time stay readable: the Asia label sits above the session high, the London label sits just inside the top of its box, and the New York label sits below the session low. You can instead place all labels above the session high or all below the session low, change the label font size, or hide the labels.

Notes

  • Works on any symbol and timeframe that has M5 and daily history. Symbols that do not trade during a session will show "no data" for that session.
  • If your broker has a short Sunday daily bar, it is included in the ADR average like any other daily bar.
  • This indicator does not open, modify or close trades, and it does not give buy or sell signals. It is an analysis tool. Past ranges do not predict future ranges, and nothing in this indicator is financial advice.

Questions and suggestions are welcome in the comments section of this product.

Prodotti consigliati
TerminalBridge Account Analytics is an on-chart account statistics indicator for MetaTrader 5. It organizes closed trading activity into day, week, month, quarter and year views. Account-wide records include all symbols by default. Main features - Live floating profit or loss - Recorded daily maximum floating loss - Floating-loss percentage, occurrence time and data status - Today, All, Last 1 Month, Last 3 Months and Custom history ranges - Built-in calendar for custom date selection - Filt
FREE
Market Ticker Free MT5
John Louis Fernando Diamante
5 (1)
A scrolling Market Ticker that displays price changes from all symbols in the Market Watch list. Provides an easy snapshot of symbol prices, and keeps scrolling automatically while you trade and analyse the chart. Options include: - MTF, eg choose to show price changes of the daily chart, or the hourly - use the live candle or the recently completed - font and background coloring
FREE
Market Session Shade MT5 Market Session Shade MT5 is a chart indicator for MetaTrader 5 that helps traders visually identify the Asia, London, and New York trading sessions. It displays each session as a shaded area on the chart, making it easier to see the time periods in which market activity takes place. The indicator calculates the high and low of each selected session and draws a shaded rectangle covering that session’s price range. Session names can be displayed directly on the chart. Ses
FREE
Account PnL Board is a MetaTrader 5 indicator that turns your deal history into a readable performance report drawn directly on the chart. Instead of a single balance figure you get one row per day, week, month or year with realised P&L, P&L percentage, lots traded, deal count and period-end balance, plus floating risk split into winners and losers, a deposit and withdrawal ledger and a full closed-trade log. It is a single indicator file. No dynamic libraries, no external services, no sub-win
FREE
Our offer also includes a free panel — Indicator Panel — which allows you to show or hide indicators created by BOToBRACIA ->  MT4  /   MT5 Our offer also includes a version for MetaTrader 4 ->  https://www.mql5.com/en/market/product/179248?source=Site+Market+Product+Page#description Indicator Panel   is a tool designed to manage the visibility of technical analysis objects generated by our indicators. Instead of enabling/disabling individual indicators or manually removing chart objects, a si
FREE
Percent Change Dashboard
Strifor (Mauritius) Ltd
5 (4)
Percent Change Dashboard Percent Change Dashboard è un indicatore informativo compatto per MetaTrader 5 che mostra in tempo reale la variazione percentuale del prezzo di uno strumento finanziario su diversi timeframe. ️ Caratteristiche principali Variazione oraria (%) Variazione giornaliera (%) Variazione settimanale (%) Variazione mensile (%) Vantaggi Comprensione immediata della forza e direzione del mercato Ideale per strategie trend-following e momentum Calcoli automatici
FREE
Visual correlation MT5
Andrey Tatarinov
5 (4)
Il comportamento di diverse coppie di valute è interconnesso. L'indicatore   Visual Correlation   consente di visualizzare diversi strumenti su 1 grafico mantenendo la scala. È possibile definire una correlazione positiva, negativa o nessuna correlazione. Alcuni strumenti iniziano a muoversi prima di altri. Tali momenti possono essere determinati sovrapponendo grafici. Per visualizzare uno strumento su un grafico, devi inserire il suo nome nel campo Simbolo. Version for MT4  https://www.mql5.
FREE
Logarithmic chart in new window You can use both chart as half or full window All features are active in both arithmetic and logarithmic charts Magnet in arithmetic  chart is standard metatrader magnet in logarithmic chart magnet have two modes: first mode only select high or low, if this mode is enabled, you can set how many candles will be search before and after to find the highest or lowest points second mode select the closest point of the candle to click, its choose between 4 points (High,
FREE
Volume Spike Levels identifies candles with unusually high volume relative to their recent average, preserves their High-Low ranges, and monitors subsequent price confirmation. It is designed for discretionary chart analysis on Forex, metals, indices, cryptocurrencies, and other instruments supported by MetaTrader 5. The indicator displays configurable range boxes or horizontal levels, BUY/SELL confirmations, and a separate price-inversion event when a previously confirmed volume range is overco
FREE
This indicator displays the spread with extra options Simple and easy to use and fully customisable: View as Pips or Pipettes Chart symbol can be hidden Text display can be changed Change colour and text styles Add or hide a decimal point Spacing options between inputs Default screen positions Screen position inputs Pro version includes: Drag and drop box on the screen Add an alert when the spread is too high Alert colours for text and text box changeable How to use 1. Simply use the default
FREE
What It Shows Candle Clock Desk puts four lines on the chart. The first is the time left until the current bar closes. The next three answer a question the clock alone cannot: is this bar unusually busy, or unusually quiet, right now. Bar closes in - the countdown, in minutes and seconds So far - volume this bar has accumulated since it opened Usual here - what this symbol had accumulated by this same minute, in the past Pace - the first divided by the second The Pace Line Pace of 1.00 means the
FREE
A0 Break Quality is a free educational indicator for traders who want to understand how price interacts with support and resistance instead of following an unexplained buy or sell arrow. The indicator evaluates confirmed swing levels using closed candles. It separates a simple touch from a wick sweep, a weak close, a body break, follow-through, a retest hold and a failed break. The chart panel explains the latest state in plain English and shows the currently tracked support and resistance. M
FREE
Advanced Trade Information Dashboard –  MT5 Everything I need to know about my account and open positions, right on the chart. I got tired of clicking between the terminal, the trade tab, and the calculator just to check my margin, pip value, or total profit in pips. So I built this dashboard to put it all in one place. What It Shows Total P&L   – Real profit/loss from the positions I care about (filter by symbol, magic number, or include swap/commission). Margin Level   – The one number th
FREE
Spread Monitor Pro
Simon Draxler
5 (1)
DRX SPREAD MONITOR è un'utility professionale progettata per visualizzare e analizzare gli spread dei broker in tempo reale. Aiuta i trader a identificare i costi nascosti causati dall'ampliamento dello spread durante eventi di notizie, rollover o sessioni a bassa liquidità. Questo strumento è essenziale per gli Scalper e i trader su Oro che devono garantire la qualità dell'esecuzione ed evitare di entrare a mercato quando i costi di trading sono statisticamente troppo alti. Caratteristiche Prin
FREE
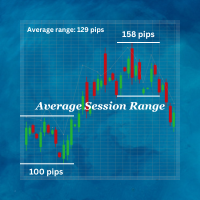
Average Session Range: Calculate and Average the Sessions High-Low Range of Specific Time Sessions Over Multiple Days. The Session Average Range is a sophisticated and precise tool designed to calculate the volatility of specific time sessions within the trading day. By meticulously analyzing the range between the high and low prices of a defined trading session over multiple days, this tool provides traders with a clear and actionable average range. **Note:** When the trading platform is closed
FREE
VPOB Smart Order Block Alert MT5 VPOB Smart Order Block Alert MT5 is an Order Block detection and alert system designed for MetaTrader 5. The system automatically analyzes price structure, detects Bullish and Bearish Order Blocks, evaluates Volume Profile information and POC, and provides a Quality Score to help traders identify important price zones. MAIN FEATURES • Automatic Bullish Order Block detection • Automatic Bearish Order Block detection • Volume Profile analysis • Point of Contro
FREE
Moving Spread
Jose Maria Molina Sanchez
Moving Spread – Monitor dei Costi di Mercato in Tempo Reale Monitora lo spread medio in tempo reale ed evita di operare durante periodi ad alto costo. Cosa fa questo indicatore Moving Spread misura lo spread medio (in punti) del mercato in tempo reale, mostrando come varia nel tempo. È uno strumento essenziale per i trader che vogliono capire quando il costo d'ingresso è troppo elevato, poiché può erodere i profitti anche prima che un'operazione abbia inizio. Perché è importante? Uno spre
FREE
Lts Sessions News
Gabriel Garcia Bogo
Know which market is open. Know when the next strong news hits. Never trade blind into a news spike again. LTS Sessions & News is the market-timing indicator from LTS — Legacy Trading System . It draws the Asia, London and New York sessions on your chart, shows three clocks (broker server, GMT and your local time) and reads the next high-impact news straight from the MT5 economic calendar, with countdowns and alerts. No external website, no DLL, no setup. EVERYTHING ON ONE CHART Asia session
FREE
Magic Number Stats shows how each Expert Advisor on your account is really doing. If you run several EAs on one account, the account history mixes all of their trades together. This indicator separates them by magic number and shows one row per EA, so you can see at a glance which EA is earning and which one is losing. For every magic number (manual trades are shown as "Manual") the table shows: Trades: number of closed positions Win%: share of positions that closed with a profit after commissio
FREE
Triple Body ZigZag MTF Triple Body ZigZag MTF is a multi-timeframe ZigZag indicator for MetaTrader 5. It displays up to three independently configurable ZigZag lines on a single price chart. Unlike a conventional ZigZag based on candle highs and lows, this indicator calculates swing points using candle bodies: Body High = max(Open, Close) Body Low = min(Open, Close) Main Features Up to three independent ZigZag lines displayed simultaneously. Individual timeframe selection for each ZigZag. Two al
FREE
AI Engulfing Pattern Trader
Fadi Hassan Khaled Ghanem
Trades bullish and bearish engulfing candles only where they matter: at recent swing lows and highs. How it works A bullish engulfing candle must fully cover the body of the previous bearish candle and have a minimum body size measured in ATR. The pattern has to form at the lowest low of the last N bars for buys (highest high for sells), and an RSI check on the previous bar avoids buying into strength or selling into weakness. The stop goes beyond the two candle pattern with an ATR buffer, the t
FREE
Candle Timer & Spread — indicatore MT5 gratuito Un indicatore MetaTrader 5 leggero e puramente visivo che mostra il tempo rimasto sulla candela corrente e segnala quando lo spread diventa anomalo. Non fa trading e non blocca nulla. Cosa mostra Countdown della candela (mm:ss) in basso a destra nel grafico. Il colore dei numeri segue lo spread rispetto allo spread tipico dello strumento: Verde — normale (≤ 1.35× il tipico) Giallo — medio (≤ 2×) Arancio — alto (≤ 3×) Rosso — esagerato (> 3×) Grigio
FREE
AZ session scalper
Yurii Shvechikov
5 (1)
AZ session scalper A small but useful session indicator, designed primarily for scalping. Enable the session you plan to trade, watch the reaction of the M5/M15 candlesticks to the level of the previous trading session, and enter. We always look at the reaction of the current session to the previous one. For example, if you trade the Americas, enable the European session, and watch how one session takes away liquidity from another. Important: adjust the time to your broker's time zone in the i
FREE
Chart Symbol Changer for MT5
Juvenille Emperor Limited
5 (11)
Chart Symbol Changer per MT5   è un indicatore/utilità che ti offre la possibilità di cambiare il simbolo del grafico corrente a cui è collegato con un clic di un pulsante del simbolo sul suo pannello.   Chart Symbol Changer per MT5   ti dà la possibilità di configurare i 32 pulsanti dei simboli secondo le tue preferenze personali, aggiungendo le coppie che vuoi tenere d'occhio e scambiare di più. In questo modo non perderai mai un'occasione, perché potrai avere una visione più rapida del merca
FREE
Are you tired of those old, boring TP and SL lines cluttering your charts? Free now, celebrating release of Live Chart Viewer utility  https://www.mql5.com/en/market/product/158488 Struggling to showcase your trades in a way that actually  grabs attention ? Worry no more!  Introducing the ultimate solution you’ve been waiting for... The TPSL Bounding Box PRO Indicator! PRO Version (With Risk to Rewards Ratio and more Modern Look Stats) With just a simple setup, you can transform you
FREE
Trend Alignment - tutti i timeframe a colpo d’occhio La tendenza è la stessa sul grafico mensile, su quello giornaliero e su quello a 5 minuti? Invece di cambiare timeframe uno alla volta, Trend Alignment mostra la valutazione tecnica di 9 timeframe in un piccolo pannello sul tuo grafico. Ogni riquadro è un timeframe, da MN1 a M1. Il colore e la freccia mostrano la valutazione: Acquisto forte, Acquisto, Neutro, Vendita o Vendita forte. Quando tutti i riquadri puntano nella stessa direzione,
FREE
DaySpread MinMax — indicatore di spread con Min/Max giornalieri Cosa mostra: Spread attuale (Cur) Spread minimo del giorno (Min.day) Spread massimo del giorno (Max.day) Come funziona: Ogni 1 secondo l’indicatore legge i prezzi Bid/Ask del simbolo corrente. Lo spread attuale viene calcolato come (Ask − Bid) / Point (in punti). Min.day/Max.day vengono aggiornati durante la giornata e si azzerano con l’inizio di un nuovo giorno di trading (D1). Le informazioni vengono mostrate sul grafico come pann
FREE
Strumento di Opening Range Breakout (ORB) per le tre sessioni principali — Asia, Londra e New York — con orari di apertura completamente modificabili. • Per ogni sessione: un box dei primi N minuti (la durata la scegliete voi), bordi di massimo/minimo estesi 24 ore in avanti e una linea mediana. • Aggiornamento in tempo reale: il box cresce in diretta mentre il range di apertura si sta formando. • Etichetta di sessione come «AS ORB M5», così sapete sempre quale range state guardando. • Avvisi al
FREE
Il Matrix Arrow Indicator Multi Timeframe Panel MT5 è un componente aggiuntivo gratuito e una grande risorsa per il tuo Matrix Arrow Indicator MT5 . Mostra l'attuale segnale Matrix Arrow Indicator MT5 per 5 timeframe personalizzati dall'utente e per 16 simboli/strumenti modificabili in totale. L'utente ha la possibilità di abilitare/disabilitare uno qualsiasi dei 10 indicatori standard di cui è composto il Matrix Arrow Indicator MT5 . Anche tutti i 10 attributi degli indicatori standard sono re
FREE
Pin Bars MT5
Yury Emeliyanov
Main purpose:   "Pin Bars"   is designed to automatically detect pin bars on financial market charts. A pin bar is a candle with a characteristic body and a long tail, which can signal a trend reversal or correction. How it works:   The indicator analyzes each candle on the chart, determining the size of the body, tail and nose of the candle. When a pin bar corresponding to predefined parameters is detected, the indicator marks it on the chart with an up or down arrow, depending on the directi
FREE
Gli utenti di questo prodotto hanno anche acquistato
Trend Sniper X
Sarvarbek Abduvoxobov
4.86 (44)
Trend Sniper X è un indicatore trend-following multi-timeframe per MetaTrader 5 che aiuta i trader a identificare la direzione del trend e i potenziali punti di inversione con chiarezza e precisione. per MT4: https://www.mql5.com/en/market/product/193245 Informazioni sul prezzo: Il prezzo attuale è promozionale ed è soggetto a modifiche con il rilascio di futuri aggiornamenti e nuove funzionalità. Offerta Bonus: Per ricevere GRATIS l'Auto-Trade Assistant EA per questo indicatore, invia un messa
Un nuovo Re in città - Indicatore + Gestione ordini (TP1 + TP2 + TP3) + Invio opzionale di segnali Telegram INCLUSO (GRATIS) (SISTEMA COMPLETO DI TRADING e SEGNALI) Il nostro miglior EA per l’Oro: Gold Slayer Questo indicatore include una strategia avanzata, un sistema di trading con gestione ordini personalizzabile e un sistema mean reversion che combina estensioni di envelope, supportato da molteplici filtri intelligenti di conferma come RSI per individuare ingressi di inversione ad alta proba
Smart Trend Trading System — MetaTrader 5 Dopo l'acquisto, inviami un messaggio su MQL5 per ricevere GRATUITAMENTE Smart Universal Expert Advisor, insieme al corso online, al manuale PDF e all'accesso al gruppo privato. STTS riunisce la direzione del trend, i segnali di entrata e uscita, le zone di inversione e i livelli di prezzo importanti direttamente sul grafico. Segui il sistema manualmente oppure collega un EA compatibile separato per eseguire le operazioni automaticamente con le impostazi
Zoryk Gold
Reda El Koutbane
4.78 (18)
ZORYK — Sistema avanzato di segnali XAUUSD per MetaTrader 5 Conosci sicuramente questa sensazione. Passi molto tempo ad analizzare l’oro. Aspetti il punto d’ingresso corretto. Finalmente apri l’operazione e il prezzo inizia immediatamente a muoversi contro di te. Chiudi troppo presto, sposti lo Stop Loss o esiti per alcuni secondi. Successivamente il mercato raggiunge esattamente l’obiettivo che avevi previsto inizialmente, ma senza di te nella posizione. Il problema non era sempre la direzione.
M5 Sniper
MeanFX
5 (4)
Porta il tuo vantaggio nel trading sotto i riflettori! M5 Sniper è un nuovo indicatore di MeanFX. Combina segnali di trading precisi con livelli TP/SL adattivi , creando così le migliori operazioni statistiche possibili! Il prezzo aumenta ogni 5 acquisti, il prossimo prezzo è di 69$ Scrivimi dopo l'acquisto per ricevere consigli/guida e un EA bonus Cosa lo rende diverso? Performance statistica comprovata su Gold XAUUSD ( funziona su quasi ogni asset , concentrandosi sulla padronanza di un singol
Entry Points Pro vi mostra dove entrare, dove mettere lo stop e con quale lotto operare — prima di piazzare l'ordine. PREZZO Ora 199 USD: 10 copie a questo prezzo, poi 249 USD. Il prezzo finale è di 349 USD. Guadagno facendo trading sui mercati e lo dimostro, quindi non ho bisogno di vendere questo indicatore a tutti. È uno strumento per trader che ragionano con la propria testa, non un pulsante magico. La freccia compare alla chiusura della candela e non si ridisegna. Due impostazioni: il vost
Ultra Indicator
Ihor Otkydach
5 (1)
ULTRA è un indicatore tecnico che funziona secondo un approccio “tutto in uno”: analizza autonomamente il mercato, genera segnali di trading, visualizza i livelli per l’impostazione degli ordini stop-loss e suggerisce quando chiudere le operazioni per realizzare profitti o ridurre al minimo le perdite. In altre parole, non importa se non sai come analizzare il mercato, determinare i livelli — dove impostare lo stop-loss — o se hai difficoltà con la gestione del capitale. ULTRA farà tutto questo
Gann Made Easy è un sistema di trading Forex professionale e facile da usare che si basa sui migliori principi del trading utilizzando la teoria di mr. WD Gann. L'indicatore fornisce segnali ACQUISTA e VENDI accurati, inclusi i livelli di Stop Loss e Take Profit. Puoi fare trading anche in movimento utilizzando le notifiche PUSH. CONTATTAMI DOPO L'ACQUISTO PER RICEVERE GRATUITAMENTE LE ISTRUZIONI DI TRADING E OTTIMI INDICATORI EXTRA! Probabilmente hai già sentito parlare molte volte dei metodi d
SuperScalp Pro
Van Minh Nguyen
4.54 (37)
SuperScalp Pro - Professional Multi-Layer Confluence Scalping System SuperScalp Pro è un indicatore di scalping avanzato che potenzia il Supertrend classico con diversi filtri intelligenti di conferma. Aiuta a individuare opportunità di trading Buy/Sell con una maggiore probabilità di successo, riducendo significativamente i falsi segnali. Le frecce Buy e Sell vengono visualizzate chiaramente direttamente sul grafico, insieme ai livelli di Stop Loss e Take Profit basati sull’ATR, calcolati autom
GoldenX Entry MT5
VividMind Digital Solutions
5 (17)
GoldenX Entry è un indicatore per MT5 con un algoritmo adattivo Smart Entry Trend, un sistema di scoring dei segnali, un rilevatore del regime di mercato e un filtro di volatilità. Ogni segnale include un livello di ingresso calcolato, tre livelli di Take-Profit (TP1, TP2, TP3) e un livello di Stop-Loss. È costruito su più livelli analitici progettati per adattarsi a diverse condizioni di mercato, combinando un sistema analitico multilivello con un ottimizzatore integrato e un sistema di traccia
Gold Trend Coach MT5
Cristhian Alexander Gaibor Cuasquer
4.27 (11)
Segnali di acquisto e vendita senza repaint sull'oro (XAUUSD) per MetaTrader 5. Ogni segnale arriva con stop loss e tre take profit. Un filtro Smart Money Concepts con BOS e CHoCH, così operi a favore della struttura, non contro. Un Mentor live sul pannello che ti guida passo dopo passo dall'ingresso fino al TP3. E alert direttamente sul tuo telefono e sul tuo canale Telegram. Questo è Gold Trend Coach. Mai più da solo davanti al grafico. KIT ACQUIRENTE GRATIS con il tuo acquisto: 1. Telegram A
SMC Intraday Formula
VividMind Digital Solutions
5 (26)
Cominciamo con la verità. Nessun indicatore da solo ti renderà profittevole. Se qualcuno ti dice il contrario, ti sta vendendo un sogno. Qualsiasi indicatore che mostra frecce perfette di acquisto/vendita può essere reso impeccabile — basta ingrandire la giusta sezione della storia e catturare solo i trade vincenti. Noi non lo facciamo.  SMC Intraday Formula è uno strumento. Legge la struttura del mercato per te, identifica le zone a più alta probabilità e ti mostra esattamente come appare la t
Boba Analysis Suite
Trade Ready Solutions LLC
5 (2)
Boba Analysis Suite Boba Analysis Suite è un indicatore di analisi per MetaTrader 5. Riunisce la struttura del mercato, le zone di prezzo rilevanti e il contesto generale del mercato in un’unica visualizzazione del grafico. Sviluppato sulla base dell’esperienza pratica come trader e formatore di trading, supporta un processo di analisi strutturato: valutare la direzione del mercato, individuare livelli importanti e analizzare congiuntamente più intervalli temporali. Analisi nel contesto del merc
Gold Entry Sniper
Tahir Mehmood
5 (23)
Gold Entry Sniper – Dashboard ATR Multi-Timeframe per Scalping e Swing Trading sull’Oro Gold Entry Sniper è un indicatore avanzato per MetaTrader 5 che offre segnali di acquisto/vendita precisi per XAUUSD e altri strumenti, basato sulla logica ATR Trailing Stop e l' analisi multi-timeframe . Caratteristiche e Vantaggi Analisi Multi-Timeframe – Visualizza trend su M1, M5, M15 in un'unica dashboard. Trailing Stop Basato su ATR – Stop dinamici che si adattano alla volatilità. Dashboard Professional
Prossimo aggiornamento — Versione 2.52 in arrivo! [NOVITÀ] Preparati a 4 nuove funzionalità principali progettate per migliorare la tua analisi di mercato e il tuo flusso di lavoro nel trading Portiamo l’analisi di mercato a un livello superiore con 4 nuove funzionalità progettate per soddisfare le tue esigenze di trading. Ecco le novità: 1. TRADE OVERVIEW DASHBOARD 2. CONFLUENCE AT ZONE 3. STRONG & WEAK HIGH/LOW 4. OTE 1. TRADE OVERVIEW DASHBOARD Una dashboard che ti aiuta a comprendere più fa
FX Power MT5 NG
Daniel Stein
5 (33)
FX Power: Analizza la Forza delle Valute per Decisioni di Trading Più Intelligenti Panoramica FX Power è lo strumento essenziale per comprendere la reale forza delle principali valute e dell'oro in qualsiasi condizione di mercato. Identificando le valute forti da comprare e quelle deboli da vendere, FX Power semplifica le decisioni di trading e rivela opportunità ad alta probabilità. Che tu segua le tendenze o anticipi inversioni utilizzando valori estremi di Delta, questo strumento si adatta
M1 Sniper MT5
Oleg Rodin
5 (7)
M1 SNIPER   è un sistema di indicatori di trading facile da usare. Si tratta di un indicatore a freccia progettato per l'intervallo temporale M1. L'indicatore può essere utilizzato come sistema autonomo per lo scalping sull'intervallo temporale M1 e come parte del tuo sistema di trading esistente. Sebbene questo sistema di trading sia stato progettato specificamente per il trading sull'intervallo temporale M1, può comunque essere utilizzato anche con altri intervalli temporali. Inizialmente ho p
FiboSniper Pro
Van Minh Nguyen
5 (4)
FiboSniper Pro – Multi-Filter Fibonacci System with Auto SL/TP and Control Panel FiboSniper Pro è un indicatore tecnico che combina Fibonacci Envelopes dinamici con diversi filtri di conferma per generare segnali Buy e Sell selezionati. I livelli di Fibonacci vengono calcolati sulla base di Moving Average e ATR e successivamente filtrati tramite ADX, EMA, RSI, ATR, Volume, Time e struttura delle candele. L’indicatore visualizza direttamente sul grafico i livelli automatici di Stop Loss e Take Pr
Auto Optimized SpeedAngle è un sistema di vettorizzazione del momento di livello istituzionale che elimina l'overfitting ( curve-fitting ) attraverso l'ottimizzazione continua Walk-Forward (WFO). Invece di affidarsi a input statici che si degradano quando i regimi di mercato cambiano, l'indicatore recalibra dinamicamente i suoi parametri utilizzando la validazione Out-of-Sample (OOS), assicurando che i segnali visualizzati rappresentino reali vantaggi statistici anziché anomalie storiche. Quadro
SQN Max indicator for MT5 by ITC
Renaud Herve Francois Candel
Sqn Max Indicator Sqn Max is an exclusive indicator to trade the market with high effectiveness. The indicator is based on price action, volatility and trend. This indicator is as simple as possible but not too simple. The indicator can generate alerts to ease the trading process. You don't have to stay all day in front of your screen. The indicator can be used with any class of assets and with any time frame. It is possible to achieve better results trading our list of selected assets. We achi
Smc Pro ToolKit
Talal N Z Aljarusha
5 (14)
SMC PRO TOOLKIT — SMART MONEY ANALYSIS & STRUCTURED TRADE PLANNING SMC Pro ToolKit is a professional Smart Money Concepts analysis workspace for MetaTrader 5. It combines market structure, multi-timeframe analysis, institutional price zones, setup evaluation, confirmation tools, volume context, alerts, and risk planning inside one organized chart environment. One workspace. Multiple layers of confirmation. One structured trading plan. OPEN COMPLETE USER GUIDE MULTI-CONDITION SETUP ENGINE At
SIO Oscillator: oscillatore auto-ottimizzante dello squilibrio di semivarianza Acquista l’indicatore e ricevi GRATIS l’Expert Advisor (EA) basato su di esso. La maggior parte degli oscillatori tratta ogni movimento di prezzo allo stesso modo. SIO separa la pressione rialzista da quella ribassista e misura lo squilibrio tra le due, mostrando quale parte controlla davvero il mercato: compratori o venditori. Quando lo squilibrio raggiunge un estremo, SIO genera un segnale chiaro con livelli di ingr
Power Candles MT5
Daniel Stein
4.58 (12)
Power Candles V3 - Indicatore di forza ad ottimizzazione automatica Power Candles V3 trasforma la forza delle valute e degli strumenti in un piano di trading attuabile su ogni grafico a cui è collegato. Invece di limitarsi a colorare le candele, esegue un'auto-ottimizzazione in tempo reale in background e ti fornisce i migliori valori di Stop Loss, Take Profit e soglia di segnale per il simbolo che hai davanti. Basta un clic per adottarlo nel trading live: i raggi di ingresso, Stop Loss e Take P
Atomic Analyst MT5
Issam Kassas
4.51 (65)
Atomic Analyst — MetaTrader 5 Dopo l'acquisto, inviami un messaggio su MQL5 per ricevere GRATUITAMENTE Smart Universal Expert Advisor, insieme al corso online, al manuale PDF e all'accesso al gruppo privato. Atomic Analyst riunisce l’azione del prezzo, la direzione del trend, i segnali di entrata e uscita, lo Stop Loss e diversi livelli di Take Profit direttamente sul grafico. INDIVIDUA IL SEGNALE. COMPRENDI IL CONTESTO OPERATIVO. Atomic Analyst organizza la sua analisi in informazioni visive ch
Unix Scalper
Issam Kassas
4 (4)
Unix Scalper — MetaTrader 5 Dopo l'acquisto, inviami un messaggio su MQL5 per ricevere GRATUITAMENTE Smart Universal Expert Advisor, insieme al corso online, al manuale PDF e all'accesso al gruppo privato. Individua il setup. Esamina il piano. Scegli come operare. UNIX Scalper riunisce analisi di mercato, indicazioni BUY/SELL/WAIT e livelli Entry, Stop Loss, TP1 e TP2 in un unico pannello organizzato. VISUALIZZA IL SEGNALE E IL PIANO • Indicazioni chiare: BUY, SELL o WAIT. • Livelli definiti: E
Tokyo mt5 Indicator
Vasiliy Strukov
5 (15)
Il Tokyo Indicator offre una chiara panoramica visiva della direzione del trend, dei potenziali segnali di trading e delle condizioni di mercato. La sua linea di trend a gradini, codificata a colori, distingue le fasi rialziste (in blu) da quelle ribassiste (in magenta). Frecce direzionali dedicate evidenziano potenziali opportunità di acquisto e vendita al variare del trend visualizzato. Una dashboard integrata riunisce in un'unica visualizzazione pratica il segnale corrente, il bias di mercato
Astral Structure
Ottaviano De Cicco
Astral Structure Valuta il setup. Osserva il piano iniziale. Offerta di lancio - $99. $149 dopo il lancio. Un setup di struttura pone più domande insieme: il quadro più ampio concorda, dove si trova il riferimento di stop e come sono definiti i target? Astral Structure riunisce queste domande in un unico spazio per i trader discrezionali che basano le proprie decisioni sulla struttura del mercato. Concentrati sul setup rilevante. Esamina insieme l'ultimo setup idoneo, la sua direzione e la sua q
Crystal Heikin Ashi Signals
Muhammad Jawad Shabir
5 (5)
Crystal Heikin Ashi Signals—Professional Trend & Signal Detection Indicator Advanced Heikin Ashi Visualization with Intelligent Signal System for Manual & Automated Trading Final Price: $149 ---------> Price goes up $10 after every 10 sales . Limited slots available — act fast . Overview User Guide PDF Crystal Heikin Ashi Signals is a professional-grade MetaTrader 5 indicator that combines pure Heikin Ashi candle visualization with an advanced momentum-shift detection system. Designed for both m
Trend Catcher ind mt5
Ramil Minniakhmetov
5 (18)
INDICATORE TREND CATCHER L'indicatore Trend Catcher analizza i movimenti dei prezzi di mercato, utilizzando una combinazione di indicatori di analisi del trend proprietari dell'autore e personalizzati. Identifica la vera direzione del mercato filtrando il rumore a breve termine e concentrandosi sulla forza del momentum sottostante, sull'espansione della volatilità e sul comportamento della struttura dei prezzi. Utilizza inoltre una combinazione di indicatori personalizzati di smoothing e filtr
Indicatore multi-valuta di forza e momentum MT5 Dynamic Forex28 Navigator è l'evoluzione dei nostri indicatori popolari da lunga data, che riunisce la potenza di cinque in uno: Advanced Currency Strength28 Indicator (700 recensioni) Advanced Currency IMPULSE with ALERT (530 recensioni) Currency Strength EXOTICS GOLD Impulse with Alert CS28 Combo Signals (bonus attuale) Non serve acquistare quattro indicatori e impilarli sui grafici. Tutto è riunito in un solo indicatore potente: la forza delle 2
Altri dall’autore
Fibonacci Ribbon and Levels brings the usual Fibonacci tools together on one chart and draws them automatically. EMA ribbon - Up to seven EMAs whose periods are Fibonacci numbers, starting from a chosen index (5-8-13-21-34-55-89 by default). - Choice of applied price. Automatic Fibonacci levels - The latest swing is the highest high and lowest low within a lookback (120 closed candles by default). The leg direction comes from which extreme came first. - Retracement levels 0, 23.6, 38.2, 50, 61.8
FREE
Candlestick Patterns Context labels well-known candle patterns. It also lets you hide the small or out-of-context ones that make most pattern tools noisy. Patterns (each can be switched on or off) - Bullish and bearish engulfing - Hammer and shooting star - Bullish and bearish harami - Piercing line and dark cloud cover - Morning star and evening star - Three white soldiers and three black crows (off by default) - Doji (off by default; labelled with no direction) Filters - Minimum size: the sign
FREE
VWAP Bands and Volume Profile combines two common volume tools in one indicator: an anchored VWAP with deviation bands, and a volume profile with its main levels. What it shows VWAP anchored to a session start time of your choice, the day, the week or the month. Up to three volume-weighted standard-deviation bands (default 1 and 2, with 3 optional), each with its own multiplier. A volume profile of the current VWAP period or of the bars visible on your chart, drawn as horizontal rows. Point of C
FREE
Chart Time Assistant puts three small time helpers in one light indicator. Candle countdown - Time left in the current candle. The format adapts to the timeframe: mm:ss below one hour, h:mm:ss up to a day, and days plus hh:mm on D1, W1 and MN1. - Uses the trade server time, so the countdown keeps moving in quiet markets when no ticks arrive. - Shown in a chosen chart corner, or next to the current price. - Turns a warning colour in the last 10% of the candle. - Optionally shows the current sprea
FREE
SMC Structure and Imbalance Map draws the main Smart Money Concepts elements on your chart from fixed, visible rules, so you can read structure quickly and check exactly why each mark is there. What it shows Swing highs and lows labelled HH, HL, LH and LL. Break of Structure (BOS, dashed line) and Change of Character (CHoCH, solid line) when a candle closes beyond the last swing. Order blocks: for each break, the opposite-colour candle at the origin of the move that broke structure. Fair value g
Killzones and Liquidity Sweeps shows the time windows and price levels that ICT-style traders watch, and marks when price trades through one of those levels and closes back on the other side. What it shows Killzone boxes for Asia (20:00-00:00), London (02:00-05:00), New York AM (07:00-10:00) and optionally London Close (10:00-12:00). Times are in New York local time and can be changed. Previous day high and low (PDH, PDL), previous week high and low (PWH, PWL), and the high and low of the Asia k
Support and Resistance Zones with Touch Count finds price areas where the market has turned more than once and shows how many times each one has been touched. What it shows Zones built from confirmed swing highs and lows. Each new swing either starts a zone or is merged into an existing one nearby. A touch count on each zone (for example "R 4x"): the number of swings that formed inside it. The nearest zones above price (resistance) and below price (support), up to the number you choose, plus any
Session and ADR Scanner shows, for a list of symbols, how far each one has moved today and in each session compared with what is normal for that symbol. What it shows One row per symbol, from Market Watch or your own list (default: the seven forex majors and XAUUSD). ADR: the average daily range over the days you choose (default 14), in pips, points or price. Used: today's range as a percentage of ADR. Daily change in percent. Tokyo, London and New York columns: the latest session range as a per
SMC Entry Models and Liquidity shows where common smart-money setups appear on the chart. It also shows the liquidity they usually target. Our SMC Structure Map shows the whole structure map. This tool shows only the moments a setup completes. Entry models - MSS (market structure shift): the first close beyond the last confirmed swing against the current trend. - Liquidity sweep + break: a wick through a swing high or low that closes back, followed by a structure break in the other direction wit
A structure break on its own is often followed by a pullback. An EMA crossover on its own fires often in ranges. This indicator marks only the candles where both line up within a window you set. Signal sources (choose one or all) - BOS: a close beyond the last confirmed swing in the direction of the current structure. - CHoCH: the first close beyond a swing against the current structure. - Equal highs / lows: two swing highs (or lows) within a tolerance of ATR, with no trading through the level
Session Opening Range measures the first part of each session and follows what price does with it for the rest of the session. What it shows - A box over the opening range of up to three sessions, with high, low and optional midline extended for the session. - The first breakout candle: close or wick beyond the range, with an optional buffer. - T1 and T2 target lines at 1x and 2x the range size (adjustable), and markers when they are reached. - A failed-breakout marker when price closes back thr
Many FVG tools mark every three-candle gap, including the tiny ones that appear in quiet markets. This indicator starts from the candle that caused the gap. A gap is only kept when the middle candle was a real displacement candle: a large body compared with its range, and a range several times ATR. What it shows - Displacement candles outlined, with the ATR multiple printed ("2.1x"). - Bullish and bearish fair value gaps anchored on those candles: a box, an edge line on each side and a dotted 50
A doji in the middle of nowhere means little. This indicator mainly asks where the candle is, then what price did next. Candle types - Doji (body up to 5% of the range), long-legged doji, and spinning top (optional). - Dragonfly and gravestone dojis (optional). In range mode, a dragonfly counts only at the range low and a gravestone only at the range high. - Minimum candle size as a multiple of ATR, so tiny candles in quiet hours are ignored. Location filter (can be switched off) - The range is
Filtro:
Nessuna recensione
Rispondi alla recensione