CalmFx SR Zones MT5

  • Indicadores
  • Callum Gunn
    Callum Gunn
    CalmFx - calm, clear trading tools for MetaTrader 5.
    I build and support the CalmFx toolkit: on-chart panels, multi-symbol scanners and indicators designed to work side by side on the same charts, on any symbol and any screen size, from a laptop to a 40-inch TV.
    CalmFx on the Market:
  • Versão: 1.0
  • Ativações: 10

Support and resistance zones drawn from where price has actually turned. CalmFx SR Zones finds swing highs and lows, merges the ones that sit close together into zones, and counts how many times each zone has been touched. Only zones with enough touches are drawn.

How the zones are built

  • Swing points are found with a strength you choose (bars on each side).
  • Swing points within a fraction of ATR are merged into one zone, so the zone width suits the market: the same inputs work on a currency pair, gold or an index.
  • Zones are chosen strongest first, with a minimum gap between them, so the chart stays readable.
  • Zones above price read as resistance and below as support. The colours swap when price moves through.

Options

  • Find zones on a higher timeframe and see them on a lower one.
  • Number of zones, minimum touches, zone width, gap and lookback are all inputs.
  • Labels with the zone price and touch count, and a tooltip on each zone.
  • Alert when price enters a zone, with a cooldown per zone. Pop-up, sound, push notification and email.
  • The zones already holding price when the indicator loads are treated as the starting point, so adding it to a chart does not alert straight away.

Notes

  • The indicator does not open, change or close trades.
  • Zones show where price has reacted before, not where it will react next.

Part of the CalmFx toolkit

Produtos recomendados
Overview Harmonic Patterns MT5 is a technical analysis indicator designed for the MetaTrader 5 platform. It identifies and displays harmonic price patterns, such as Butterfly, Cypher, Crab, Bat, Shark, and Gartley, in both bullish and bearish directions. The indicator calculates key price levels, including entry, stop loss, and three take-profit levels, to assist traders in analyzing market movements. Visual elements and customizable alerts enhance usability on the chart. Features Detects six ha
RSI Divergence Risk Target Signals RSI Divergence Risk Target Signals is a MetaTrader 5 indicator that detects confirmed bullish and bearish RSI divergence and combines the signals with optional trend filters, ATR-based Stop Loss levels, three Take Profit targets, alerts and an internal trade statistics dashboard. The indicator compares confirmed RSI pivot structure with corresponding price highs and lows. It is designed to help traders identify momentum divergence while providing a structure
Harmonic Pattern Hunter
Shingidzano Lesetedi
5 (1)
Harmonic Pattern Hunter Harmonic Pattern Hunter is a technical indicator for MetaTrader 5 that automatically identifies and draws high-probability harmonic patterns directly on the chart. It is designed to assist traders who use harmonic analysis as part of their trading methodology. How It Works The indicator scans historical and live price data for completed XABCD harmonic structures using Fibonacci ratio validation. When a valid pattern is detected, it draws the full pattern geometry, marks t
TapeResilience — Volume Flow and Price Impact Analysis Volume Analysis | Order Flow | Price Impact | Market Response TapeResilience is a market activity analysis indicator for MetaTrader 5, designed to help traders study the relationship between trading volume, directional pressure, price impact, and subsequent market reactions. Instead of relying on traditional Buy/Sell signals alone, TapeResilience evaluates unusual market activity and observes how prices respond after significant directional
Este é sem dúvida o indicador de reconhecimento automático de formação de preço harmônico mais completo que você pode encontrar para a MetaTrader Platform. Ele detecta 19 padrões diferentes, leva as projeções de Fibonacci tão a sério quanto você, exibe a Zona de Reversão Potencial (PRZ) e encontra níveis adequados de stop loss e take-profit. [ Guia de instalação | Guia de atualização | Solução de problemas | FAQ | Todos os produtos ] Detecta 19 formações harmônicas de preços diferentes Traça
THV Harmonic Pattern MT5 – Automatic Pattern Detection & Trading Levels Overview THV Harmonic Pattern MT5 is a technical analysis indicator designed to automatically identify potential Harmonic Chart Patterns and display their structures directly on your MetaTrader 5 chart. Using swing high and swing low detection combined with Fibonacci ratio analysis, the indicator identifies potential harmonic formations such as Gartley, Bat, Butterfly, Crab, and AB=CD patterns. It also incorporates an RSI
TRI Visualizer
Yoshimi Mon 三 Ura
TRI Visualizer MT5 – Thermodynamic Market Analysis Overview The TRI (Thermal Range Indicator) Visualizer Enhanced is a rare market analysis indicator that goes beyond conventional technical analysis, applying principles of thermodynamics from physics. It interprets market price fluctuations as “thermodynamic energy,” enabling the highly accurate detection of subtle market changes that are often overlooked. Innovative Mechanisms 1. Dual Calculation Engines Classic TRI Mode Formula: |Close
Professional Opening Range Breakout (ORB) indicator designed for precision session trading with automatic time handling, breakout alerts, and advanced target levels. This indicator automatically identifies the Opening Range for any configurable session, plots the High, Low, and Midpoint levels, and extends them across the trading day. Built-in breakout detection and alerts, range measurements, and extension targets provide traders with clear structure and actionable levels. Ideal for traders usi
Monster Harmonics Indicator is a harmonic pattern indicator. It recognizes Gartley, Bat, Crab, Butterfly, Cypher, White Swan, Black Swan, Shark and AB=CD patterns. Projected patterns that are not yet completed are recognized, too. Monster even shows the PRZ (Potential Reversal Zone). Users can add their own user defined patterns to Monster. Besides the current pattern, Monster also shows all patterns in the symbols history. Monster will provide alerts for developing patterns. Introduced by H.M.
Introducing the Power Trade Plus indicator designed by a small group of traders with a few years of experience trading the market profitably.  The Power Trade Plus is derived from the Power Trade indicator,  the indicator strive in powerful sniper entries and take profit levels,  with an algorithm that's can determine the markets volatility and Provides entries based on the current market volatility. This indicator is much more effective in stock ,currencies and indices.
Wolfe Waves são padrões de negociação naturais presentes em todos os mercados financeiros e representam uma luta por um preço de equilíbrio. Esses padrões podem se desenvolver em prazos de curto e longo prazo e são um dos padrões de reversão preditiva mais confiáveis existentes, normalmente precedendo movimentos de preços fortes e longos. [ Guia de instalação | Guia de atualização | Solução de problemas | FAQ | Todos os produtos ] Sinais de negociação claros Surpreendentemente fácil de negociar
Candlestick Pattern Scanner Pro — Indicator Description A comprehensive, customizable candlestick pattern recognition tool for MetaTrader 5, featuring ATR-based signal positioning, dynamic TP/SL levels, and multi-timeframe alert capabilities. Key Features ATR-Based Signal Management ATR Period & Multiplier : Dynamically calculates arrow signal distance based on market volatility. Dynamic TP/SL Levels : Set Take-Profit (TP1/TP2) and Stop-Loss levels using customizable ATR multipliers for
Candle hunter
Ruslan Khasanov
5 (1)
Indicador para análise gráfica. Marca os principais padrões de velas japonesas no gráfico. No momento, o seguinte conjunto de padrões está disponível para o trader:  - Bearish/Bullish Abandoned Baby;  - Bearish Advance Block;  - Bearish Deliberation;  - Bearish/Bullish Belt Hold;  - Bearish/Bullish Engulfing;  - Bearish Shooting Star;  - Bearish Evening Star;  - Bearish Evening Doji Star;  - Bearish/Bullish Doji Star;    - Bearish/Bullish Tri-Star;  - Bearish Hanging Man;  - Bearish/Bullish Har
Rhino Chart Drawing Tools para MetaTrader 5 Rhino Chart Drawing Tools oferece um fluxo de trabalho de desenho semelhante ao TradingView para o MetaTrader 5. Inclui 54 ferramentas de desenho, uma barra de ferramentas personalizável, favoritos, estilos rápidos, configurações de objetos, modelos e um gerenciador de objetos. Ferramentas de desenho Linhas Linha de tendência, raio, linha estendida, linha horizontal, linha vertical, raio horizontal, linha cruzada, ângulo de tendência, seta, caminho, po
"Impulses and Corrections 5" is created to help traders navigate the market situation. The indicator shows multi-time frame upward and downward "Impulses" of price movements. These impulses are the basis for determining the "Base" , which is composed of zones of corrections of price movements, as well as "Potential" zones for possible scenarios of price movement. Up and down impulses are determined based on a modified formula of Bill Williams' "Fractals" indicator. The last impulse is always "U
The   Fibonacci Confluence Toolkit   is a technical analysis tool designed to help traders identify potential price reversal zones by combining key market signals and patterns. It highlights areas of interest where significant price action or reactions are anticipated, automatically applies Fibonacci retracement levels to outline potential pullback zones, and detects engulfing candle patterns. Its unique strength lies in its reliance solely on price patterns, eliminating the need for user-define
SophieSMC One is a premium Smart Money Concepts indicator designed specifically for XAUUSD (Gold) traders who want a cleaner, more structured and institutional approach to the market. Built around real market structure concepts, SophieSMC One combines multiple Smart Money Concepts tools into one powerful and visually clean trading system for MetaTrader 5. FEATURES: • BOS & CHoCH market structure detection • Fair Value Gap (FVG) identification • Liquidity sweep visualization • Order Block recog
Multi Timeframe Smc Bias Finder Trading in alignment with higher timeframe structure is one of the most consistently profitable habits a trader can build. The difficulty has always been execution: switching between timeframes, manually reading structure, and keeping track of whether the Daily, 4-Hour and 1-Hour are all pointing in the same direction before committing to a position. Multi Timeframe Smc Bias Finder resolves that entirely. Three tools in one indicator: A live multi-timeframe bias d
Haven Fibonacci Volume Profiles — Seu Analista Automático de Faixas de Mercado Apresentando o Haven Fibonacci Volume Profiles — uma ferramenta poderosa que leva a análise de mercado para o próximo nível. Este indicador identifica automaticamente as principais faixas de preço, construídas em pontos de pivô significativos, e sobrepõe em cada uma delas um Perfil de Volume detalhado juntamente com os níveis de Fibonacci. Isso permite que os traders vejam instantaneamente onde a liquidez está concent
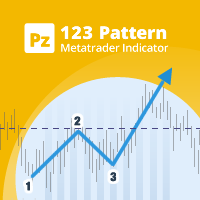
O 123 Pattern é um dos padrões de gráficos mais populares, poderosos e flexíveis. O padrão é composto por três pontos de preço: fundo, pico ou vale e retração de Fibonacci entre 38,2% e 71,8%. Um padrão é considerado válido quando as quebras de preços além do último pico ou vale, momento em que o indicador traça uma flecha, sobe um alerta, e o comércio pode ser colocado. [ Guia de instalação | Guia de atualização | Solução de problemas | FAQ | Todos os produtos ] Sinais de negociação claros C
Harmonic Pattern Structure Harmonic Pattern Structure é um indicador profissional para MetaTrader 5 que detecta automaticamente padrões harmônicos clássicos utilizando validação rigorosa de ratios de Fibonacci e estrutura XABCD. Projetado para traders que buscam precisão, clareza visual e padronização, o indicador identifica zonas de reversão com base em geometria de preço, ajudando na tomada de decisão de forma objetiva e consistente. PADRÕES HARMÔNICOS DETECTADOS Gartley (222) Butterfly
Cumulative Volume Delta MA-X MTF (com Momento de Gradiente) Este indicador realiza uma análise multi-timeframe do Delta de Volume Acumulado (CVD) para o MetaTrader 5. Ele calcula a diferença líquida entre a pressão de compra e venda analisando dados de volume real ou de ticks , fornecendo uma representação visual do sentimento do fluxo de ordens. Lógica e Recursos do Indicador O indicador utiliza uma abordagem matemática para a análise de volume: Origem dos Dados: Suporta tanto Volume Real (par
Gartley Projections D
Oleksandr Medviediev
3 (2)
The indicator identifies the harmonic patterns (XABCD) according to developments of H.M.Gartley ( "Profits in the Stock Market" , 1935г). It projects D-point as a point in the perspective projection (specify ProjectionD_Mode = true in the settings). Does not redraw. When a bar of the working timeframe closes, if the identified pattern point has not moved during Patterns_Fractal_Bars bars, an arrow appears on the chart (in the direction of the expected price movement). From this moment on, the ar
QM Scanner Pro
Shaban Mir Fazlolah Oreynab
QUASIMODO PATTERN SCANNER - Professional Edition                 Automatic Detection of High-Probability Setups        WHAT IS THE QUASIMODO (QM) PATTERN? The Quasimodo Pattern is one of the most reliable and powerful  reversal patterns in technical analysis. Used by professional  traders
What Is Trend Master Pro? Trend Master Pro   is a professional-grade trend trading indicator built for MetaTrader 5. It was designed with one goal in mind — to keep you on the right side of the market at all times by combining three powerful technical tools into a single, clean, easy-to-read display directly on your price chart. Instead of cluttering your screen with multiple separate indicators, Trend Master Pro fuses an   EMA Ribbon trend filter , a   ZigZag swing point engine , and a   breako
CRT Candle Range Theory HTF MT5 - Ultimate CRT Indicator: Conceitos Avançados de ICT e Sistema de Negociação SnR Malaio Domine as pegadas dos criadores de mercado com o indicador mais avançado de Candle Range Theory. Desbloqueie o verdadeiro poder dos Smart Money Concepts (SMC) e opere com a precisão das instituições com o Ultimate CRT Indicator. Construído exclusivamente para traders sérios, este indicador automatiza a altamente eficaz Teoria CRT, um pilar central dos Conceitos ICT (Inner Circl
UT Bot Simple
Bartlomiej Tadeusz Tomaja
**Features:** 1. **Innovative Trend Tracking:** The UT BOT Simple Indicator leverages the power of the Average True Range (ATR), a renowned volatility measure, to calculate precise trailing stop values, providing unparalleled insights into market trends. 2. **Customizable Settings:** Flexibility is paramount in any trading strategy. With this in mind, our indicator allows you to adjust the ATR periods and other key parameters to tailor the tool to your trading style and strategy. 3. **Real-t
Indicador Crypto_Forex "Padrão do Enforcado" para MT5, sem repintura, sem atraso. - O indicador "Padrão do Enforcado" é um indicador muito poderoso para negociação de Price Action. - O indicador detecta padrões de baixa do Enforcado no gráfico: sinal de seta vermelha no gráfico (veja as imagens). - Com alertas para PC, celular e e-mail. - O indicador "Padrão do Enforcado" é excelente para combinar com níveis de suporte/resistência. Click here to see high quality Trading Robots and Indicators!
Mine Farm
Maryna Kauzova
Mine Farm is one of the most classic and time-tested scalping strategies based on the breakdown of strong price levels. Mine Farm is the author's modification of the system for determining entry and exit points into the market... Mine Farm - is the combination of great potential with reliability and safety. Why Mine Farm?! - each order has a short dynamic Stop Loss - the advisor does not use any risky methods (averaging, martingale, grid, locking, etc.) - the advisor tries to get the most
Place Elliott Waves, automatic rule check and project targets – right in your MT5 chart Elliott Wave indicator for MetaTrader 5: place impulses and corrections. As soon as the points are set, the tool automatically checks whether the count complies with the Elliott Wave ruleset and calculates the Fibonacci targets. Elliott Wave Architect Pro MT5 brings the analysis into the same chart you trade from. The count is placed, the tool immediately checks the rule compliance and calculates the targets.
Os compradores deste produto também adquirem
Trend Sniper X
Sarvarbek Abduvoxobov
4.86 (44)
Trend Sniper X é um indicador de acompanhamento de tendência para múltiplos tempos gráficos no MetaTrader 5 que ajuda os traders a identificar a direção da tendência e potenciais pontos de reversão com clareza e precisão. para MT4: https://www.mql5.com/en/market/product/193245 Informações sobre o preço: O preço atual é promocional e está sujeito a alterações à medida que novas atualizações e funcionalidades forem lançadas. Oferta Bônus: Para obter o Auto-Trade Assistant EA GRATUITO para este in
Um novo Rei chegou à cidade - Indicador + Gestão de Ordens (TP1 + TP2 + TP3) + Enviador opcional de sinais para Telegram INCLUÍDO (GRÁTIS) (SISTEMA COMPLETO DE TRADING e SINAIS) Nosso melhor EA para Ouro: Gold Slayer Este indicador inclui uma estratégia avançada, um sistema de trading com gestão de ordens personalizável e um sistema de reversão à média que combina extensões de envelopes, apoiado por múltiplos filtros inteligentes de confirmação, como o RSI, para capturar entradas de reversão de
Smart Trend Trading System — MetaTrader 5 Após a compra, envie-me uma mensagem no MQL5 para receber Smart Universal Expert Advisor GRÁTIS, além do curso online, do manual em PDF e do acesso ao grupo privado. O STTS reúne a direção da tendência, sinais de entrada e saída, zonas de reversão e níveis de preço importantes diretamente no seu gráfico. Siga o sistema manualmente ou conecte um EA compatível separado para executar operações automaticamente com as configurações que você escolher. UM SISTE
O Entry Points Pro mostra onde entrar, onde colocar o stop e com qual lote operar — antes de você colocar a ordem. PREÇO Agora 149 USD, e esta é a última cópia por este preço. Depois o preço sobe para 199 USD, e o preço final é 349 USD. Eu ganho meu dinheiro operando nos mercados e mostro isso, por isso não preciso vender este indicador para todo mundo. É uma ferramenta para traders que pensam por conta própria, não um botão mágico. A seta aparece no fechamento da vela e não repinta. Duas confi
Tenha sua vantagem no trading à vista! M5 Sniper é um novo indicador da MeanFX. Ele combina sinais de trading precisos com níveis adaptativos de TP/SL — criando, como resultado, as melhores operações estatísticas possíveis! O preço aumenta a cada 5 compras, o próximo preço é de 69$ Envie-me uma mensagem após a compra para receber dicas/guia e um EA bônus O que o faz se destacar? Desempenho estatístico comprovado no Gold XAUUSD ( funciona em praticamente todos os ativos , com foco em dominar um ú
Ultra Indicator
Ihor Otkydach
5 (1)
O ULTRA é um indicador técnico que funciona numa base «tudo-em-um» — analisa o mercado de forma independente, gera sinais de negociação, apresenta níveis para definir ordens de stop-loss e sugere quando encerrar as negociações para garantir lucros ou minimizar perdas. Por outras palavras, não importa se não sabe analisar o mercado, determinar níveis — onde definir o seu stop-loss — ou se tem dificuldades com a gestão do capital. O ULTRA fará tudo isso por si! BÓNUS PARA O COMPRADOR: Após adquiri
SuperScalp Pro
Van Minh Nguyen
4.54 (37)
SuperScalp Pro - Professional Multi-Layer Confluence Scalping System O SuperScalp Pro é um indicador avançado de scalping que aprimora o Supertrend clássico com vários filtros inteligentes de confirmação. Ele ajuda a identificar oportunidades de Buy/Sell com maior probabilidade de sucesso, reduzindo significativamente os sinais falsos. Setas claras de Buy e Sell aparecem diretamente no gráfico, juntamente com os níveis de Stop Loss e Take Profit baseados em ATR, calculados automaticamente em tem
Gold Trend Coach MT5
Cristhian Alexander Gaibor Cuasquer
4.27 (11)
Gold Trend Coach é um indicador de tendência para o ouro (XAUUSD) no MetaTrader 5 com sinais de compra e venda, stop loss e três take profit confirmados no fechamento da vela (não repinta), um coach que te guia da entrada até o TP3, um painel multi-timeframe e alertas no celular e no Telegram. Feito para scalping em M1 e M5 e intraday em M15 nas sessões de Londres e Nova York. BÔNUS: EA de auto-trading GRÁTIS para o Gold Trend Coach. Me envie uma mensagem depois da compra e eu envio o EA que ope
Gann Made Easy   é um sistema de negociação Forex profissional e fácil de usar, baseado nos melhores princípios de negociação usando a teoria do sr. W. D. Gann. O indicador fornece sinais precisos de COMPRA e VENDA, incluindo níveis de Stop Loss e Take Profit. Você pode negociar mesmo em movimento usando notificações PUSH. Entre em contato comigo após a compra para receber instruções de negociação e ótimos indicadores extras gratuitamente! Provavelmente você já ouviu muitas vezes sobre os método
SMC Intraday Formula
VividMind Digital Solutions
5 (26)
Vamos ser honestos primeiro. Nenhum indicador sozinho vai te tornar lucrativo. Se alguém te disser o contrário, está te vendendo um sonho. Qualquer indicador que mostre setas perfeitas de compra/venda pode ser feito para parecer impecável — basta dar zoom na parte certa da história e tirar um print das operações vencedoras. Nós não fazemos isso.  SMC Intraday Formula é uma ferramenta. Ela lê a estrutura do mercado para você, identifica as zonas de maior probabilidade de preço e mostra exatament
Boba Analysis Suite
Trade Ready Solutions LLC
5 (2)
Boba Analysis Suite O Boba Analysis Suite é um indicador de análise para o MetaTrader 5. Reúne a estrutura do mercado, as zonas de preço relevantes e o contexto geral do mercado numa única visualização do gráfico. Desenvolvido a partir da experiência prática como trader e formador de traders, apoia um processo de análise estruturado: avaliar a direção do mercado, identificar níveis importantes e analisar vários períodos gráficos em conjunto. Análise em contexto O significado de cada sinal depend
FiboSniper Pro
Van Minh Nguyen
5 (4)
FiboSniper Pro – Multi-Filter Fibonacci System with Auto SL/TP and Control Panel FiboSniper Pro é um indicador técnico que combina Fibonacci Envelopes dinâmicos com vários filtros de confirmação para gerar sinais seletivos de Buy e Sell. Os níveis de Fibonacci são calculados com base em Moving Average e ATR e, em seguida, filtrados por ADX, EMA, RSI, ATR, Volume, Time e estrutura das velas. O indicador exibe diretamente no gráfico os níveis automáticos de Stop Loss e Take Profit baseados em ATR,
Próxima Atualização — Versão 2.52 em Breve! [NOVO] Prepare-se para 4 Grandes Novos Recursos Projetados para Aprimorar sua Análise de Mercado e seu Fluxo de Trabalho de Trading Estamos levando a análise de mercado a um novo nível com 4 novos recursos desenvolvidos para atender às suas necessidades de trading. Apresentamos: 1. TRADE OVERVIEW DASHBOARD 2. CONFLUENCE AT ZONE 3. STRONG & WEAK HIGH/LOW 4. OTE 1. TRADE OVERVIEW DASHBOARD Um painel que ajuda você a compreender mais facilmente o panoram
M1 Sniper MT5
Oleg Rodin
5 (7)
O   M1 SNIPER   é um sistema indicador de negociação fácil de usar. É um indicador de seta projetado para o período M1. O indicador pode ser usado como um sistema independente para scalping no período M1 e pode ser usado como parte do seu sistema de negociação existente. Embora este sistema de negociação tenha sido projetado especificamente para negociação no M1, ele também pode ser usado em outros períodos. Originalmente, desenvolvi este método para negociar XAUUSD e BTCUSD. Mas considero-o úti
Auto Optimized SpeedAngle é um sistema de vetorização de momentum de nível institucional que elimina o sobreajuste ( curve-fitting ) por meio da otimização contínua de avanço ( Walk-Forward Optimization , WFO). Em vez de depender de entradas estáticas que se degradam quando os regimes de mercado mudam, o indicador recalibra dinamicamente seus parâmetros utilizando validação fora de amostra ( Out-of-Sample , OOS), garantindo que os sinais exibidos representem vantagens estatísticas genuínas e não
SQN Max indicator for MT5 by ITC
Renaud Herve Francois Candel
Sqn Max Indicator Sqn Max is an exclusive indicator to trade the market with high effectiveness. The indicator is based on price action, volatility and trend. This indicator is as simple as possible but not too simple. The indicator can generate alerts to ease the trading process. You don't have to stay all day in front of your screen. The indicator can be used with any class of assets and with any time frame. It is possible to achieve better results trading our list of selected assets. We achi
Crystal Heikin Ashi Signals
Muhammad Jawad Shabir
5 (5)
Crystal Heikin Ashi Signals—Professional Trend & Signal Detection Indicator Advanced Heikin Ashi Visualization with Intelligent Signal System for Manual & Automated Trading Final Price: $149 ---------> Price goes up $10 after every 10 sales . Limited slots available — act fast . Overview User Guide PDF Crystal Heikin Ashi Signals is a professional-grade MetaTrader 5 indicator that combines pure Heikin Ashi candle visualization with an advanced momentum-shift detection system. Designed for both m
Smc Pro ToolKit
Talal N Z Aljarusha
5 (14)
SMC PRO TOOLKIT — SMART MONEY ANALYSIS & STRUCTURED TRADE PLANNING SMC Pro ToolKit is a professional Smart Money Concepts analysis workspace for MetaTrader 5. It combines market structure, multi-timeframe analysis, institutional price zones, setup evaluation, confirmation tools, volume context, alerts, and risk planning inside one organized chart environment. One workspace. Multiple layers of confirmation. One structured trading plan. OPEN COMPLETE USER GUIDE MULTI-CONDITION SETUP ENGINE At
Atomic Analyst MT5
Issam Kassas
4.5 (64)
Atomic Analyst — MetaTrader 5 Após a compra, envie-me uma mensagem no MQL5 para receber Smart Universal Expert Advisor GRÁTIS, além do curso online, do manual em PDF e do acesso ao grupo privado. O Atomic Analyst reúne a ação do preço, a direção da tendência, sinais de entrada e saída, Stop Loss e vários níveis de Take Profit diretamente no seu gráfico. VEJA O SINAL. ENTENDA O CENÁRIO. O Atomic Analyst organiza sua análise em informações visuais claras: • Setas de compra e venda para identificar
FX Power MT5 NG
Daniel Stein
5 (33)
FX Power: Analise a Força das Moedas para Decisões de Negociação Mais Inteligentes Visão Geral FX Power é a sua ferramenta essencial para compreender a força real das principais moedas e do ouro em quaisquer condições de mercado. Identificando moedas fortes para comprar e fracas para vender, FX Power simplifica as decisões de negociação e revela oportunidades de alta probabilidade. Quer você prefira seguir tendências ou antecipar reversões usando valores extremos de Delta, esta ferramenta adap
Trend Catcher ind mt5
Ramil Minniakhmetov
5 (18)
INDICADOR TREND CATCHER O Indicador Trend Catcher analisa os movimentos de preços do mercado, utilizando uma combinação de indicadores de análise de tendências adaptativos, proprietários e personalizados pelo autor. Identifica a verdadeira direção do mercado, filtrando o ruído de curto prazo e focando a força do momentum subjacente, a expansão da volatilidade e o comportamento da estrutura de preços. Utiliza também uma combinação de indicadores personalizados de suavização e filtragem de tendê
O Scalper Vault é um sistema de negociação poderoso e completo, projetado para traders que buscam consistência em operações intraday. Este indicador de alta precisão funciona como um sistema de negociação autônomo, oferecendo análises de nível institucional tanto para o mercado Forex quanto para Opções Binárias. ENTRE EM CONTATO COMIGO APÓS A COMPRA PARA RECEBER DICAS DE NEGOCIAÇÃO E UM BÔNUS EXCLUSIVO! Ao eliminar suposições e análises manuais complexas, o Scalper Vault permite que você foque
Unix Scalper
Issam Kassas
4 (4)
Unix Scalper — MetaTrader 5 Após a compra, envie-me uma mensagem no MQL5 para receber Smart Universal Expert Advisor GRÁTIS, além do curso online, do manual em PDF e do acesso ao grupo privado. Identifique a oportunidade. Veja o plano. Escolha como operar. O UNIX Scalper reúne análise de mercado, decisões BUY/SELL/WAIT e níveis de Entry, Stop Loss, TP1 e TP2 em um painel organizado. VEJA O SINAL E O PLANO • Decisões claras: BUY, SELL ou WAIT. • Níveis definidos: Entry, Stop Loss, TP1 e TP2. •
SIO Oscillator: oscilador auto-otimizável de desequilíbrio de semivariância Compre o indicador e receba GRÁTIS o Expert Advisor (EA) baseado nele. A maioria dos osciladores trata todo movimento de preço da mesma forma. O SIO separa a pressão de alta da pressão de baixa e mede o desequilíbrio entre elas, mostrando qual lado realmente controla o mercado: compradores ou vendedores. Quando o desequilíbrio atinge um extremo, o SIO gera um sinal claro com níveis de entrada, Stop Loss e Take Profit. O
Indicador multi-moeda de força e momentum MT5 O Dynamic Forex28 Navigator é a evolução dos nossos indicadores populares de longa data, reunindo o poder de cinco em um: Advanced Currency Strength28 Indicator (700 avaliações) Advanced Currency IMPULSE with ALERT (530 avaliações) Currency Strength EXOTICS GOLD Impulse with Alert CS28 Combo Signals (bônus atual) Não é necessário comprar quatro indicadores e empilhá-los nos seus gráficos. Tudo está reunido em um único indicador poderoso: a força dos
Adaptive Price Action Engine Compre um indicador, ganhe o EA de graça Análise Auto-Otimizada de Tendências e Padrões de Candlestick em Múltiplos Timeframes Os mercados estão em constante mudança, e nem todos os padrões de Price Action têm o mesmo valor em todas as condições de mercado. O Adaptive Price Action Engine foi desenvolvido para se adaptar às mudanças nas condições do mercado, combinando estrutura de tendência, análise Multi-Timeframe, padrões de candlestick e otimização estatística em
Azimuth Pro
Ottaviano De Cicco
5 (7)
Azimuth Pro V2: Estrutura Fractal Sintética e Entradas Confirmadas para MT5 Visão geral Azimuth Pro é um indicador de estrutura swing multinível da Merkava Labs . Quatro camadas de swing aninhadas, VWAP ancorado em swings, detecção de padrões ABC, filtragem estrutural de três timeframes e entradas confirmadas em barra fechada — um gráfico, um fluxo de trabalho dos micro-swings aos macro-ciclos. Este não é um produto de sinais cegos. É um fluxo de trabalho baseado em estrutura para traders que v
Neuro Poseidon MT5
Daria Rezueva
4.68 (53)
Neuro Poseidon is a new indicator by Daria Rezueva. It combines precise trading signals with adaptive TP/SL levels - creating best possible trades as a result! Message me and get  Neuro Poseidon Assistant  as a gift to automize your trading process! What makes it stand out? 1. Proven profitability on all assets and timeframes 2. Only confirmed BUY and SELL signals present on the chart 3. Adaptive TP & SL levels generated by the software for each trade 4. Easy to understand - suitable for al
PZ Swing Trading MT5
PZ TRADING SLU
5 (5)
Swing Trading é o primeiro indicador projetado para detectar oscilações na direção da tendência e possíveis oscilações de reversão. Ele usa a abordagem de negociação de linha de base, amplamente descrita na literatura de negociação. O indicador estuda vários vetores de preço e tempo para rastrear a direção da tendência agregada e detecta situações nas quais o mercado está sobrevendido ou sobrecomprado em excesso e pronto para corrigir. [ Guia de instalação | Guia de atualização | Solução de prob
SkyHammer Signal Pro Indicador profissional de sinais de tendência sem repaint, com níveis Entry, SL e TP bloqueados SkyHammer Signal Pro é um indicador estruturado de tendência e momentum, desenvolvido para traders que procuram sinais claros, fixos e verificáveis. Funciona melhor em timeframes baixos, como M1 e M5 . O indicador não tenta prever topos ou fundos do mercado. Em vez disso, ele aguarda estrutura de mercado confirmada, direção de tendência, força de momentum, volatilidade saudável e
Mais do autor
The Daily Dipper Skipper is an on-chart dashboard that watches a list of symbols on several timeframes at once and shows where RSI is in, or approaching, an oversold ("dip") or overbought ("rip") zone. It is a monitoring and alerting tool. It does not open, modify or close trades. It reads RSI on D1, H4, H1, M30 and M15. Each symbol is given a class from A to E that sets how many of those timeframes it is watched on, so your most-traded instruments can be watched on all five while quieter ones s
A volatility squeeze is when the Bollinger Bands contract inside the Keltner Channel. Price is coiling, and the release that follows is often a strong move. Finding squeezes by hand across dozens of charts and timeframes is slow. CalmFx Squeeze Ranker scans your symbol list, or your whole Market Watch filtered by asset class, from a single chart and scores every market from 0 to 100, with the tightest coils at the top. How the score works Compression: how deep the Bollinger Bands sit inside the
A quiet session on a symbol that normally moves a lot has to resolve somewhere. CalmFx Session Range Ranker measures how tight a reference session's range was (Tokyo by default) against each symbol's own average daily range. It ranks your whole watchlist from 0 to 100 and shows the break levels next to the score, so you can see which markets are coiled ahead of the next session and where they would break. How the score works Compression: the session range as a percentage of the symbol's average
Markets that stretch too far from their mean tend to snap back. CalmFx Snap Ranker scans your symbol list, or your whole Market Watch, from a single chart and scores how stretched each market is from 0 to 100. The strongest snap-back candidates appear at the top, each with its expected direction. How the score works RSI: how far RSI is past its overbought or oversold level. Band position: how far price sits across the Bollinger Bands. 100 means at a band, and higher means it has closed outside.
Markets that move strongly and cleanly in one direction tend to keep going. CalmFx Surge Ranker scans your symbol list, or your whole Market Watch, from a single chart and scores the strength and cleanliness of each market's current move from 0 to 100. The strongest, cleanest trends appear at the top, each with its direction. How the score works Momentum: the rate of change measured in ATR units, so a currency pair, an index and gold can be compared fairly. Trend quality: how straight the move i
See the trend on nine timeframes at once. CalmFx MultiTF Trend Dashboard reads M1, M5, M15, M30, H1, H4, D1, W1 and MN on the chart symbol and shows each one as BULL, BEAR or MIX, with how long that reading has held and an overall bias across the board. What it shows One row per timeframe, from a fast moving average against a slow one (8 and 200 by default). A timer on each row showing how long the current reading has held. An overall bias and an agreement meter showing how aligned the nine time
The four forex sessions at a glance. CalmFx Sessions Clock shows which of Sydney, Tokyo, London and New York are open, a live countdown to the next open or close, and how far each open session has run. What it shows Open or closed for each session, with its hours in GMT. A live countdown to the next open or close. Progress through each open session. The server time and GMT in the title bar. Daylight saving handled properly London, New York and Sydney change their clocks on different dates, and S
FREE
Support and resistance zones drawn from where price has actually turned. CalmFx SR Zones finds swing highs and lows, merges the ones that sit close together into zones, and counts how many times each zone has been touched. Only zones with enough touches are drawn. How the zones are built Swing points are found with a strength you choose (bars on each side). Swing points within a fraction of ATR are merged into one zone, so the zone width suits the market: the same inputs work on a currency pair,
Three moving averages drawn as two coloured clouds, so trend, pullback and turn are visible at a glance. CalmFx Trend Ribbon shades between the fast and mid averages, and between the mid and slow averages, and each cloud changes colour with its direction. What it draws A fast-to-mid cloud for the quick read and a mid-to-slow cloud for the structure. The three moving average lines on top (8, 38 and 200 by default). Periods, method and applied price are inputs. An optional Bollinger envelope drawn
CalmFx Trading Panel is an on-chart panel for manual trading in MetaTrader 5. It places market and pending orders in one click, manages open positions with a trailing stop and a hedge button, and shows sessions, multi-timeframe trend, RSI alerts and the economic calendar on the same chart. The panel works on any symbol. Distance settings such as take profit, trailing stop and pending order offsets are scaled automatically to each market's average daily range, so the same settings behave consiste
The Daily Dipper Skipper is an on-chart dashboard that watches a list of symbols on several timeframes at once and shows where RSI is in, or approaching, an oversold ("dip") or overbought ("rip") zone. It is a monitoring and alerting tool. It does not open, modify or close trades. It reads RSI on D1, H12, H8, H4 and H1. Each symbol is given a class from A to E that sets how many of those timeframes it is watched on, so your most-traded instruments can be watched on all five while quieter ones st
A volatility squeeze is when the Bollinger Bands contract inside the Keltner Channel. Price is coiling, and the release that follows is often a strong move. Finding squeezes by hand across dozens of charts and timeframes is slow. CalmFx Squeeze Ranker scans your symbol list, or your whole Market Watch filtered by asset class, from a single chart and scores every market from 0 to 100, with the tightest coils at the top. How the score works Compression: how deep the Bollinger Bands sit inside the
A quiet session on a symbol that normally moves a lot has to resolve somewhere. CalmFx Session Range Ranker measures how tight a reference session's range was (Tokyo by default) against each symbol's own average daily range. It ranks your whole watchlist from 0 to 100 and shows the break levels next to the score, so you can see which markets are coiled ahead of the next session and where they would break. How the score works Compression: the session range as a percentage of the symbol's average
Markets that stretch too far from their mean tend to snap back. CalmFx Snap Ranker scans your symbol list, or your whole Market Watch, from a single chart and scores how stretched each market is from 0 to 100. The strongest snap-back candidates appear at the top, each with its expected direction. How the score works RSI: how far RSI is past its overbought or oversold level. Band position: how far price sits across the Bollinger Bands. 100 means at a band, and higher means it has closed outside.
Markets that move strongly and cleanly in one direction tend to keep going. CalmFx Surge Ranker scans your symbol list, or your whole Market Watch, from a single chart and scores the strength and cleanliness of each market's current move from 0 to 100. The strongest, cleanest trends appear at the top, each with its direction. How the score works Momentum: the rate of change measured in ATR units, so a currency pair, an index and gold can be compared fairly. Trend quality: how straight the move i
See the trend on ten timeframes at once. CalmFx MultiTF Trend Dashboard reads M1, M5, M15, M30, H1, H2, H4, H8, H12 and D1 on the chart symbol and shows each one as BULL, BEAR or MIX, with how long that reading has held and an overall bias across the board. What it shows One row per timeframe, from a fast moving average against a slow one (8 and 200 by default). A timer on each row showing how long the current reading has held. An overall bias and an agreement meter showing how aligned the ten t
The four forex sessions at a glance. CalmFx Sessions Clock shows which of Sydney, Tokyo, London and New York are open, a live countdown to the next open or close, and how far each open session has run. What it shows Open or closed for each session, with its hours in GMT. A live countdown to the next open or close. Progress through each open session. The server time and GMT in the title bar. Daylight saving handled properly London, New York and Sydney change their clocks on different dates, and S
FREE
Three moving averages drawn as two shaded clouds, so trend, pullback and turn are visible at a glance. CalmFx Trend Ribbon shades between the fast and mid averages, and between the mid and slow averages, and each cloud changes colour with its direction. What it draws A fast-to-mid cloud for the quick read and a mid-to-slow cloud for the structure. The three moving average lines on top (8, 38 and 200 by default). Periods, method and applied price are inputs. An optional Bollinger envelope drawn a
Filtro:
Sem comentários
Responder ao comentário