SignalX Pivot Levels

What this is

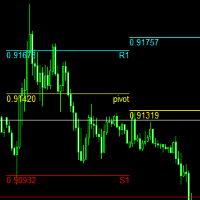
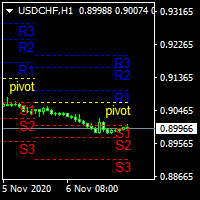
Pivot levels give a reference frame for the day without any indicator clutter: where the previous period balance sits, and where the likely support and resistance are. This indicator draws daily, weekly and monthly pivots at once, in classic, Fibonacci, Camarilla or Woodie form, labelled with their prices.

What it does

Draws daily, weekly and monthly pivots at once in one of four methods: classic, Fibonacci, Camarilla or Woodie.

  • Three timeframes of pivot structure in one tool with the method switchable at load, rather than one indicator per timeframe.
  • Runs on a single chart; it does not need to be the chart you trade from.
  • No DLL calls. No external services. No network requests.
  • No account, terminal, symbol or time limitation is embedded.

Inputs

Input Type Default
InpShowDaily bool true
InpShowWeekly bool true
InpShowMonthly bool false
InpLookbackBars int 600
InpShowLabels bool true
InpDayColor color C'232,181,75'
InpWeekColor color clrDodgerBlue
InpMonthColor color clrMediumPurple
InpFontSize int 8

How to use it

  1. Attach the EA to a chart of the symbol you trade.
  2. Set the inputs to match your own risk approach. Defaults are deliberately conservative.
  3. Allow live trading in the Expert Advisors settings for this EA.
  4. Test on a demo account first. That is not a formality; the defaults are not tuned to your broker.

Notes

  • Written for MetaTrader 4, any broker, any account currency. Sizing maths uses the symbol's own tick value.
  • Works alongside other EAs, including with a magic number you choose, so it will not fight them for orders it does not own.
  • It performs management and measurement only; it does not generate trading signals.

Honest limits

  • This is a tool, not a strategy. It does not predict anything and it cannot make a losing method profitable.
  • No performance figures are published for it because tools of this kind do not have a meaningful backtest curve of their own.
  • If your broker quotes oddly (very wide spreads, non-standard tick values) verify the sizing on a demo account before using real funds.

Trading involves risk of loss. Nothing here is financial advice.

Produtos recomendados
Pivot Points MT4
KEENBASE SOFTWARE SOLUTIONS
O KT Pivot Points traça automaticamente os níveis de pivô diários, semanais e mensais no gráfico, com cálculos precisos baseados nos dados mais recentes. Pontos de pivô são indicadores amplamente utilizados na análise técnica, especialmente no mercado Forex. Recursos Envia alertas quando o preço atinge um nível de pivô.  Oferece personalização completa para cada tipo de nível de pivô.   Mostra os níveis de pivô diário, semanal e mensal de forma clara e simples. Utiliza recursos mínimos da CPU
Raymond Cloudy Day Indicator for MT4 – Pivot-Based Reversal and Trend Levels Raymond Cloudy Day Indicator is a pivot-based level indicator for MetaTrader 4 (MT4). It was developed by Ngo The Hung based on Raymond’s original idea and is designed to give a structured view of potential reversal zones, trend extensions and support/resistance levels directly on the chart. The default settings are optimised for XAUUSD on the H1 timeframe, but the indicator can be tested and adjusted for other symbols
TCL Boll Bands Trader MT4
Stratos Digital (PVT) Ltd
TCL Boll Bands Trader is a Bollinger Bands indicator for MetaTrader 4 with a multi-mode trend filter, dual-deviation entry levels, volatility subfilters, and an interactive on-chart dashboard. How It Works Standard Bollinger Bands signals can produce signals against the dominant move when the underlying market is in a strong trend. This indicator addresses that by checking each potential signal against a configurable trend filter before plotting it, and by adding squeeze, Average Directional Ind
FREE
Smart Trendlines
Suvashish Halder
5 (2)
Smart Trendlines – No.1 Trendlines Indicator Smart Trendlines is a precision tool that automatically draws trendlines based on every valid pivot point, helping traders identify key support and resistance zones. It continuously adjusts as new market pivots form, providing a live and accurate reflection of price structure. Whether you’re tracking trends, preparing for reversals, or anticipating breakouts — this indicator keeps you one step ahead. It works seamlessly across all assets including For
RelicusRoad Daily Pivots é um indicador de pontos pivô diários para MetaTrader 4 e MetaTrader 5 que divide a amplitude do dia anterior em níveis de Fibonacci e os estende acima e abaixo dela, de menos 100 a mais 200 por cento. Em vez de pivôs de piso clássicos, a amplitude anterior já fechada é tratada como uma escala em que a mínima é 0% e a máxima é 100%. Dezanove níveis são impressos como pequenos marcadores coloridos no bordo direito do gráfico, para que o tamanho do movimento de hoje se lei
FREE
VR Pivot
Vladimir Pastushak
VR Pivot é um indicador de pontos pivôs importantes (pivot). Os Pontos Pivôs são um tipo especial de suporte (support) e níveis de resistência (resistance) que são usados para identificar as zonas de preço mais fortes. Os comerciantes profissionais usam os níveis de pivôs para determinar os preços em que há uma alta probabilidade de uma reversão de preço. Os níveis são calculados de acordo com fórmulas matemáticas especiais, os preços de fechamento, abertura, máximo, mínimo do período anterior s
O que é um Pivot? Um pivô é um nível de preço significativo conhecido de antemão, que os traders consideram importante e podem tomar decisões de negociação em torno desse nível. Como um indicador técnico, um preço pivô é semelhante a um nível de resistência ou suporte. Se o nível do pivô for excedido, o preço deverá continuar nessa direção. Ou o preço pode reverter nesse nível ou perto dele. O que um pivô lhe diz? Existem pivôs e pontos de pivô. Esses termos podem significar coisas diferente
Smart Pivot Points para MetaTrader 4 — Níveis Claros para Negociações Inteligentes O Smart Pivot Points é um indicador profissional para o MetaTrader 5 que calcula e exibe automaticamente um conjunto completo de níveis de negociação chave no gráfico. Transforma o caos da ação do preço num mapa estruturado e claro, destacando zonas de suporte, resistência, equilíbrio de preços e potenciais alvos. Concebida para traders que valorizam a clareza, a ferramenta funciona em qualquer mercado: Forex, cr
Optimized Version of the Pivot-Based Adaptive Support, Resistance, and Signal Line Indicator No Parameters, Simple and Easy to Use, Suitable for Daily and Lower Timeframes. Advantages: Applicable to all instruments. Suitable for all timeframes. The indicator automatically adjusts with changing data, providing more accurate signals. Instructions for Use: If the current price breaks above the signal line, the trend is bullish, with the initial target being the upper resistance line. If the price
Pivot Points Classic and Camarilla desenha os níveis de pivô Classic (P, R1-R3, S1-S3) e os níveis Camarilla (H1-H4, L1-L4) diretamente no gráfico. Os níveis são calculados a partir do High, Low e Close do período anterior do timeframe escolhido (D1 por padrão), e cada período é desenhado como uma linha horizontal sobre o período a que se aplica, para que você veja como o preço reagiu aos níveis em dias, semanas ou meses anteriores. Funções Pivôs Classic - o pivô central P com três níveis de res
FREE
pivot points using by many traders and pivot levels most of the times are very helpfull . this indicator is a custom with internal parameters. it can show two times pivot (weekly and daily). you can choose periods total for each time showing pivots.( 1 week , 2 week ,...1day , 2day ,...) when use weekly and daily pivots , it can show you many support and resistance zones. if have proposal comment too me for upgrading indicator.
FREE
Grapic ByArrowTrend Pro
Truong Cong Truc
1 (1)
Indicator support for only: Entry Point to Trend Pro Link indicator  support   :   https://www.mql5.com/en/market/product/70867 Supports all currency pairs declared in the definition. Help investors do not need to open many charts. Notice the DEAL:  multiple time frames confluence   M15, H1, H4. Entry Point to Trend Pro The indicator helps investors to identify the earliest and perfect reversal point. Easy to make decision to trade with the trend   Price action trading. support resistance an
FREE
Automatic Fibonacci Pivots
Martin Alejandro Bamonte
Now free. The key Fibonacci pivot levels, drawn for you automatically every day, on any timeframe. Automatic Fibonacci Pivots calculates the daily support and resistance from the Fibonacci sequence and plots them clean on your chart: the daily pivot, S1/S2/S3 below and R1/R2/R3 above. These are the price zones where the market tends to react, bounce or break, and now you see them without drawing a single line. What it does: - Daily Fibonacci pivot levels (pivot, S1/S2/S3, R1/R2/R3), updated
FREE
Sniper Trend Fusion
Ilham Hijrah Saputra
5 (1)
Sniper Trend Fusion This indicator is a powerful all-in-one trading tool designed to simplify chart analysis and improve decision-making. It combines multiple proven techniques into a single system, helping traders identify trend direction, volatility, key price levels, and market structure without clutter. Instead of switching between multiple indicators, everything you need is integrated into one smooth and efficient interface. Key Advantages All-in-One System Combines trend, volatility, sup
FREE
SMC Session Scanner MT4 is a panel indicator for MetaTrader 4 that watches many symbols and timeframes for smart-money structure and session levels. For each symbol and timeframe it shows one of these: a fresh break of structure (BOS), a change of character (CHoCH), or a fresh liquidity sweep. It also shows price inside a live order block or fair value gap. Otherwise it shows the latest break and how long ago it was. A Session column shows the session now. It also shows today's first close beyon
Auto Trendline Channel MTF draws trendlines, parallel channels and horizontal support / resistance automatically from confirmed swing highs and lows. For each line it records the touch count, close breaks, wick breaks and retests. A table shows, for the chart timeframe and two higher timeframes, the nearest line above and below the price, the distance to it and the Dow theory direction. Touch counts and break records describe what happened on the past chart. They do not tell whether price will
.................................if you need pivot point s levels............................... ............................this is a daily pivot point level creator........................... ...it is for daily pivots and show levels at times period H4 , H1 , M30 , M15 ,M 5... .................................also shows levels for 3 last days.............................. ................can use it with other indicators and see important levels...............
FREE
Daily Range Forecast mostra qual será provavelmente o tamanho do dia, quanto dele já foi percorrido e os dois preços a partir dos quais o dia é maior do que o habitual. No ouro usa um modelo integrado testado no histórico do ouro; em qualquer outro gráfico ajusta-se ao histórico próprio desse símbolo. O que mostra A faixa de hoje no gráfico: da máxima de hoje menos a amplitude provável até à mínima de hoje mais essa amplitude. Só se estreita com uma nova máxima ou mínima; além de qualquer uma da
FREE
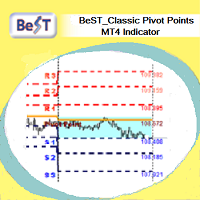
BeST_ Classic Pivot Points is an MT4 Indicator that is based on the widely known and definitely classic Pivot Point of a market prices activity. A pivot point is calculated as an average of significant prices (high,low,close) from the performance of a market in the prior trading period. If the market in the following period trades above the pivot point it is usually evaluated as a bullish sentiment, whereas trading below the pivot point is seen as bearish. A pivot point and the associated suppo
FREE
Supply Demand Zone Pro Indicator works with all products and timeframes. It is using a new calculation method, and now you can select the desired zone on any timeframe! Strongest Zones are already enabled by default This is a great advantage in trading.This indicator has a built in backtester enabled by default, just move the chart. Supply and Demand ? Supply is a price zone where sellers outnumbered buyers and drove the price lower. Demand is a price zone where buyers outnumbers sellers and dr
GRÁTIS — pivôs de giro ZigZag junto com um filtro de tendência de média móvel, desenhados juntos. Mostra os níveis de pivô e o contexto de tendência sobre os quais um sistema de rompimento de pivôs opera. Ajustado para o ouro (XAUUSD). 100% grátis, sem limitações. Se conquistar um lugar nos seus gráficos, uma breve avaliação é o que mais nos ajuda — leva 30 segundos e é o que permite que outros traders encontrem esta ferramenta. Plataforma: MetaTrader 4 (esta página). Um rompimento de pivô só
FREE
Marca d'Água para Gráficos Estilo TradingView Transforme seus gráficos do MetaTrader 4 para ficarem tão elegantes e profissionais quanto o TradingView. Você está cansado do visual padrão e simples do MetaTrader? O WaterMark MT4 é um indicador leve e totalmente personalizável, projetado para aprimorar sua experiência de gráficos, adicionando marcas d'água elegantes e modernas diretamente ao seu terminal de negociação. Este indicador preenche a lacuna visual entre os gráficos padrão do MetaTrader
FREE
Ultra Advanced FiboChannel
Marcel De Oliveira Farias
Ultra Advanced FiboChannel é um indicador de canal de Fibonacci para MetaTrader 4 que desenha automaticamente os níveis de Fibonacci no gráfico. Ele combina a análise de Fibonacci com uma visão de canal do mercado. Principais características - Desenha automaticamente os níveis de Fibonacci - Visão do preço baseada em canal - Recomendado em H1, H4 e D1 - Fácil de usar - Uma versão demo está disponível para teste Configurações recomendadas Tempos gráficos: H1, H4, D1 Pares: EUR/USD, USD/JPY, GBP/
NAM Divergences
NAM TECH GROUP, CORP.
5 (1)
Indicador de detecção MT4 Multi-timeframe Divergence e Overbougt / Oversold. Características - Totalmente personalizável no painel de controle do gráfico, fornece interação completa. - Oculte e mostre o painel de controle onde quiser. - Informação em tempo real sobre divergências não capitalizadas. - Informações em tempo real sobre situações de sobrecompra / sobrevenda. - Informações em tempo real sobre divergências regulares. - Informações em tempo real sobre divergências ocultas. -
This is a Multi-Time-Frame Zigzag indicator You can change parameters of Zigzag, include Zigzag Depth, Zigzag Deviation, Zigzag Backstep. You can choose which Time Frame to display Zigzag by turn ShowXXX to true or false (ShowXXX = ShowM1, ShowM5, ShowM15...). Noted: Lower Time Frame Zigzag will not display on Higher Time Frame. Example: Your current Time Frame is H1, you can not see Zigzag of M1 to M30 even you turn them on.
5/35 Oscillator to be used with our Elliott Wave Indicator as part of the overall strategy on trading the 5th wave. The Elliott Wave Indicator Suite is designed around a simple but effective Swing Trading Strategy. The Indicator Suite is great for Stocks, Futures and Forex trading on multiple timeframes You can find the main Elliott Wave Indicator here  https://www.mql5.com/en/market/product/44034
FREE
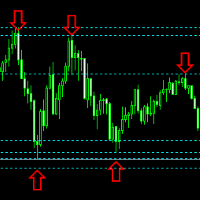
.....................................hi....................... ................for showing high s and low s and support and resistanses .....................we have a lot of ways............................... it can be helpful for finding trends , higher highs , higher lows , lower highs , lower lows .......................today i write on of thems.......................... ........................you can enter the number of last support and resistanses .........................and it will dra
FREE
Genesis Matrix Pro is a professional multi-timeframe trend detection indicator designed to help traders identify high-quality market alignment with clarity and structure. It combines 12 different technical indicators into one visual alignment matrix, allowing traders to quickly see when market conditions are bullish, bearish, or neutral. A signal is generated only when the selected strategies are aligned, helping reduce noise and improve decision-making. PLEASE CONTACT ME AFTER PURCHASE TO GET
Newlevel
Sergey Nanov
Indicator. Zones of support and resistance levels The most reliable tool in the hands of any technical analyst is support and resistance levels.It is these levels that magically work in the market, because the price then bounces off them, on the contrary, gaining maximum acceleration, punching them and striving for a new price point.However, in practice, many beginners face enormous difficulties in building them.This is due to the fact that the price may react quite differently to them, and ofte
FREE
SR indicator
Alexander Chertnik
5 (3)
SR is a support and resistance indicator, it shows major highs and lows by different colors. The color of a level is changing if the last high or low are touching it. After the closing of a bar above or below level, it will delete it. extern inputs: loop for candles / colors / drawing time *This indicator signal is not perfect and have to be used with other market analysis and confirmations.
FREE
Os compradores deste produto também adquirem
Trend SniperX MT4
Sarvarbek Abduvoxobov
5 (5)
Trend Sniper X é um indicador de tendência multitemporal para MetaTrader 5 que ajuda os traders a identificar a direção da tendência e potenciais pontos de reversão com clareza e precisão. Para MT5: https://www.mql5.com/en/market/product/181101 Informação de preço: O preço atual é promocional e está sujeito a alterações à medida que novas atualizações e recursos forem lançados. Canal Code2Profit Domine o Mercado com Análise Multitemporal! Como Maximizar sua Taxa de Acerto com o Trend Sniper X: R
Scalper Vault
Oleg Rodin
5 (40)
O Scalper Vault é um sistema de negociação poderoso e completo, projetado para traders que buscam consistência em operações intraday. Este indicador de alta precisão funciona como um sistema de negociação autônomo, oferecendo análises de nível institucional tanto para o mercado Forex quanto para Opções Binárias. ENTRE EM CONTATO COMIGO APÓS A COMPRA PARA RECEBER DICAS DE NEGOCIAÇÃO E UM BÔNUS EXCLUSIVO! Ao eliminar suposições e análises manuais complexas, o Scalper Vault permite que você foque
O sistema PRO Renko é um sistema de negociação altamente preciso especialmente concebido para a negociação de gráficos RENKO. Trata-se de um sistema universal que pode ser aplicado a vários instrumentos de negociação. O sistema neutraliza eficazmente o chamado ruído de mercado, dando-lhe acesso a sinais de inversão precisos. O indicador é muito fácil de usar e tem apenas um parâmetro responsável pela geração de sinal. Você pode facilmente adaptar a ferramenta a qualquer instrumento de negocia
SR Liquidity
Oleg Rodin
5 (2)
O SR Liquidity é um indicador de trading projetado para revelar as zonas ocultas onde a liquidez do mercado se concentra e o preço reage com maior intensidade. Essas áreas específicas de liquidez funcionam como níveis poderosos de suporte e resistência, oferecendo um mapa claro de onde é mais provável que o mercado reverta. Em vez de traçar linhas comuns de Suporte e Resistência, o SR Liquidity analisa o comportamento real dos preços para detectar as zonas onde se acumulam pressões de compra e v
Atomic Analyst
Issam Kassas
5 (14)
Atomic Analyst — MetaTrader 4 Para dúvidas sobre o produto, orientação de configuração ou suporte técnico, envie-me uma mensagem diretamente aqui no MQL5. O indicador transforma cálculos complexos do mercado em sinais visuais simples, candles coloridos, leituras de tendência, níveis de stop loss e várias zonas de take profit que os traders podem entender rapidamente e usar em condições reais de mercado. Principais usos de trading: Scalping e day trade: Desenvolvido para tomada de decisão rápida
M1 Sniper
Oleg Rodin
4.97 (30)
O M1 SNIPER é um sistema indicador de negociação fácil de usar. É um indicador de seta projetado para o período M1. O indicador pode ser usado como um sistema independente para scalping no período M1 e pode ser usado como parte do seu sistema de negociação existente. Embora este sistema de negociação tenha sido projetado especificamente para negociação no M1, ele também pode ser usado em outros períodos. Originalmente, desenvolvi este método para negociar XAUUSD e BTCUSD. Mas considero-o útil ta
SIO Oscillator: oscilador auto-otimizável de desequilíbrio de semivariância Compre o indicador e receba GRÁTIS o Expert Advisor (EA) baseado nele. A maioria dos osciladores trata todo movimento de preço da mesma forma. O SIO separa a pressão de alta da pressão de baixa e mede o desequilíbrio entre elas, mostrando qual lado realmente controla o mercado: compradores ou vendedores. Quando o desequilíbrio atinge um extremo, o SIO gera um sinal claro com níveis de entrada, Stop Loss e Take Profit. O
Quant Direction
Georgios Kalomoiropoulos
Quant Direction é uma ferramenta de análise de mercado tridimensional. Ela oferece uma análise de mercado totalmente objetiva, baseada em algoritmos, que calcula simultaneamente desvios percentuais precisos em diversos parâmetros. Desenvolvido com ferramentas avançadas de modelagem com inteligência artificial e rigorosamente testado, o algoritmo foi projetado para interpretar o mercado com precisão sem precedentes. Você pode analisar qualquer par de moedas ou instrumento financeiro em sua plataf
AW Prime Oscillator
AW Trading Software Limited
5 (1)
Uma combinação de dois osciladores. O primeiro exibe os pontos de entrada, o segundo mostra a tendência atual. O indicador pode exibir sinais do oscilador por meio de setas em dois modos, todos os sinais do oscilador rápido ou sinais apenas na direção da tendência atual. Possui painel multi-timeframe e três tipos de notificações de sinal. Benefícios: Adequado para negociação diurna e de scalping Filtragem de tendências Configuração simples e sensível Painel multiperíodo Adequado para integração
Hidden Cycles
Lev Vladimirovic Marushkin
5 (1)
The Only 100% Universal Tool! Stop trading against nature! This is your chance to secure the only indicator rooted in the absolute laws that govern the entire universe. Most tools guess—this one reveals the truth. Buy another toy or buy the truth. Your choice... Based on Universal Laws — NOT Some Guy’s Algorithm: Let the market adjust to the Hidden Cycles Geometry — not the other way around. Most indicators are based on a man-made formula. They often lag, fail over time, or need constant re-o
Smart Trend Trading System é um indicador para MetaTrader 4 que reúne informações de tendência, sinais de entrada e saída e níveis de preço em um único gráfico. Ele combina mais de 10 ferramentas de trading em um único sistema, incluindo detecção de tendência, zonas de reversão, Smart Cloud, lógica de trailing stop, suporte e resistência, coloração de candles, alertas e análise multi-timeframe. O sistema foi desenvolvido para ajudar você a operar diferentes condições de mercado: Mercados em tend
Este indicador examina a estrutura de preços de fractais de diferentes períodos para determinar possíveis pontos de reversão no mercado, proporcionando tempo aos traders posicionais que já possuem um modelo de avaliação fundamental ou técnico. Diferentemente de seu irmão mais novo, Reversal Fractals , esse indicador não perde reversões por causa do período selecionado e encontra fractais de reversão em zigue-zague, ignorando as reversões que não possuem impulso suficiente para iniciar um movime
Currency Strength Wizard é um indicador muito poderoso que fornece uma solução completa para uma negociação bem-sucedida. O indicador calcula o poder deste ou daquele par forex usando os dados de todas as moedas em vários intervalos de tempo. Esses dados são representados em uma forma de índice de moeda fácil de usar e linhas de energia de moeda que você pode usar para ver o poder desta ou daquela moeda. Tudo o que você precisa é anexar o indicador ao gráfico que deseja negociar e o indicador mo
CRT Multi-Timeframe Market Structure & Liquidity Sweep Indicator Non-Repainting | Multi-Asset | MT5 Version Available MT5 Version:   https://www.mql5.com/en/market/product/162075 Full User Guide — explains what each feature does and why:   https://www.mql5.com/en/blogs/post/767525 Quick Start User Guide  — explains how to configure and in what order:  https://www.mql5.com/en/blogs/post/767540 Indicator Overview CRT Ghost Candle HTF Fractal is a complete institutional-grade market structure too
Neuro Poseidon MT4
Daria Rezueva
4.74 (46)
Neuro Poseidon is a new indicator by Daria Rezueva. It combines precise trading signals with adaptive TP/SL levels - creating best possible trades as a result! Message me and get  Neuro Poseidon Assistant  as a gift to automize your trading process! What makes it stand out? 1. Proven profitability on all assets and timeframes 2. Only confirmed BUY and SELL signals present on the chart 3. Adaptive TP & SL levels generated by the software for each trade 4. Easy to understand - suitable for all
Non repaint MT4
Yan Zhen Du
5 (1)
This is a professional chart indicator designed for traders focused on stability and clear price action. It helps filter market noise and provides clear visual entry and exit zones for your trading decisions. Core Features: Strictly Non-Repainting: The system is built with strict non-repaint logic. What you see on the chart is the true historical performance. Confirmed Signals: Signals are triggered and confirmed only after the candle closes . Once a trading arrow appears on a closed candle, it
Forex Breath System é um sistema de negociação baseado em tendências que pode ser usado em qualquer mercado. Você pode usar este sistema com moedas, metais, commodities, índices, criptografia e até ações. Também pode ser usado em qualquer período de tempo. O sistema é universal. Ele mostra tendência e fornece sinais de seta com a tendência. O indicador também pode fornecer um tipo especial de alerta quando os sinais aparecem na direção da tendência, o que torna a negociação de tendências uma tar
Advanced Supply Demand
Bernhard Schweigert
4.91 (302)
Atualmente com 30% de desconto! A melhor solução para qualquer Trader Novato ou especialista! Este indicador é uma ferramenta de negociação exclusiva, de alta qualidade e acessível porque incorporamos uma série de recursos proprietários e uma nova fórmula. Com esta atualização, você poderá mostrar fusos horários duplos. Você não só será capaz de mostrar um TF mais alto, mas também mostrar ambos, o TF do gráfico, MAIS o TF mais alto: MOSTRANDO ZONAS ANINHADAS. Todos os traders de Oferta e Demanda
Super Signal – Skyblade Edition Sistema profissional de sinais de tendência sem repintar / sem atraso com taxa de acerto excepcional | Para MT4 / MT5 Funciona melhor em timeframes mais curtos, como 1 minuto, 5 minutos e 15 minutos. Principais características: Super Signal – Skyblade Edition é um sistema inteligente de sinais desenvolvido especificamente para operações com tendência. Utiliza uma lógica de filtragem em múltiplas camadas para detectar apenas movimentos direcionais fortes sustenta
Liquidity Scalper System: um sistema de trading baseado em liquidez no formato de indicador. A maioria dos indicadores mostra apenas uma seta, e depois o trader decide sozinho onde colocar o stop, onde está o alvo e se pode confiar no sinal. O Liquidity Scalper System cobre todo o ciclo da operação: encontra pools de liquidez, dá um sinal no seu rompimento, calcula imediatamente Entry, Stop Loss e três alvos, e mostra no painel as estatísticas e os resultados da validação em dados novos. O sist
Gann Made Easy
Oleg Rodin
4.84 (174)
Gann Made Easy é um sistema de negociação Forex profissional e fácil de usar, baseado nos melhores princípios de negociação usando a teoria do sr. W. D. Gann. O indicador fornece sinais precisos de COMPRA e VENDA, incluindo níveis de Stop Loss e Take Profit. Você pode negociar mesmo em movimento usando notificações PUSH. Entre em contato comigo após a compra para receber instruções de negociação e ótimos indicadores extras gratuitamente! Provavelmente você já ouviu muitas vezes sobre os métodos
True Direction Oscillator
Muhammad Elbermawi
4.85 (364)
Ou (TDO) que é um índice que mede a taxa de variação do preço usando o princípio de " Pure Momentum ". Quando o preço de um título avança de 10 para 15, a taxa de variação do preço é 150%, mas quando diminui de 15 para 10, a taxa de variação do preço é apenas 33,3%. É por isso que os indicadores de análise técnica como "Taxa de variação do preço" (ROC) ou "Momentum" fornecem leituras mais altas para movimentos de preços ascendentes do que para os descendentes. O TDO corrige esse problema para aj
Sinal de tendência GoldRush Arrow O indicador Sinal de tendência GoldRush Arrow fornece uma análise precisa e em tempo real das tendências, adaptada para scalpers de alta velocidade e curto prazo em XAU/USD. Criada especificamente para o intervalo de tempo de 1 minuto, esta ferramenta exibe setas direcionais para pontos de entrada claros, permitindo que os scalpers naveguem em condições de mercado voláteis com confiança. O indicador consiste em setas de alerta PRIMÁRIAS e SECUNDÁRIAS. Os sin
ACTUALMENTE COM 40% DE DESCONTO A melhor solução para qualquer novato ou comerciante especializado! Este Indicador é uma ferramenta comercial única, de alta qualidade e acessível, porque incorporámos uma série de características proprietárias e uma nova fórmula. Com apenas UM gráfico, pode ler a força da moeda para 28 pares de Forex! Imagine como a sua negociação irá melhorar porque é capaz de apontar o ponto exacto do gatilho de uma nova tendência ou oportunidade de escalada? Manual do util
Trend Lines PRO
Roman Podpora
5 (2)
LINHAS DE TENDÊNCIA PRO       Ajuda a entender onde o mercado está realmente mudando de direção. O indicador mostra inversões de tendência reais e pontos onde os principais participantes retornam ao mercado. Você vê     Linhas BOS     Análise de tendências e níveis-chave em prazos maiores — sem configurações complexas ou ruídos desnecessários. Os sinais não são repintados e permanecem no gráfico após o fechamento da barra. VERSÃO MT 5      -      Revela seu potencial máximo quando emparelhada co
Actualmente 30% OFF ! A melhor solução para qualquer novato ou comerciante especializado! Este software de painel de instrumentos está a funcionar em 28 pares de moedas. É baseado em 2 dos nossos principais indicadores (Advanced Currency Strength 28 e Advanced Currency Impulse). Dá uma grande visão geral de todo o mercado Forex. Mostra valores avançados de força da moeda, velocidade de movimento da moeda e sinais para 28 pares de divisas em todos os (9) períodos de tempo. Imagine como a sua n
TDI Multi Timeframe Scanner: This Dashboard indicator uses the TDI (Trader's Dynamic Index) Indicator to find best trades. Read detailed How to Use Guide: https://www.mql5.com/en/blogs/post/758252 Extra indicators also available in above post. Checks for: - SharkFin Pattern Free indicator for SharkFin: https://www.mql5.com/en/market/product/42405/ - TDI Trend: Strong/Weak Trend Up/Down - TDI Signal: Strong/Medium/Weak Signal for Buy/Sell - Consolidation - Overbought/Oversold - Volatility Ban
Italo Trend Indicator
Italo Santana Gomes
4.74 (34)
BUY INDICATOR AND GET EA FOR FREE AS A BONUS + SOME OTHER GIFTS! ITALO TREND INDICATOR  is the best trend indicator on the market, the Indicator works on all time-frames and assets, indicator built after 7 years of experience on forex and many other markets. You know many trend indicators around the internet are not complete, does not help, and it's difficult to trade, but the Italo Trend Indicator is different , the Italo Trend Indicator shows the signal to buy or sell, to confirm the signal t
VWAP Ultimate Pro MT4 – Persistent Anchored VWAP | Session VWAP | Dynamic Bands & Smart Alerts Bring an Advanced Professional VWAP Workflow to the Classic MetaTrader 4 Platform WHY TRADERS CHOOSE VWAP ULTIMATE PRO MT4? VWAP (Volume-Weighted Average Price) is a widely used benchmark for evaluating fair value, session bias and price positioning. VWAP Ultimate Pro MT4 delivers a complete VWAP workflow optimised for the MT4 architecture, including persistent Anchored VWAP, multiple VWAP periods,
CRT Candle Range Theory HTF MT4 - Ultimate CRT Indicator: Conceitos Avançados de ICT e Sistema de Negociação SnR Malaio Domine as pegadas dos criadores de mercado com o indicador mais avançado de Candle Range Theory. Desbloqueie o verdadeiro poder dos Smart Money Concepts (SMC) e opere com a precisão das instituições com o Ultimate CRT Indicator. Construído exclusivamente para traders sérios, este indicador automatiza a altamente eficaz Teoria CRT, um pilar central dos Conceitos ICT (Inner Circl
Mais do autor
SignalX Account Pulse MT5
Ahmed Ismail Muhammad Ismail Al Talhat
What this is A free single-strip readout of the numbers that decide whether an account survives a bad hour: equity, free margin, margin level with a colour state that warns before the margin call, floating profit and loss, and the current spread measured against its sixty-bar average. It takes no decisions for you and it is free on purpose. What it does Free strip showing equity, free margin, margin level with margin-call colouring, floating P/L, open position count and current spread against it
FREE
SignalX Account Pulse
Ahmed Ismail Muhammad Ismail Al Talhat
What this is A free single-strip readout of the numbers that decide whether an account survives a bad hour: equity, free margin, margin level with a colour state that warns before the margin call, floating profit and loss, and the current spread measured against its sixty-bar average. It takes no decisions for you and it is free on purpose. What it does Free strip showing equity, free margin, margin level with margin-call colouring, floating P/L and current spread against its 60-bar average. Fre
FREE
Gold Apex EA MT4
Ahmed Ismail Muhammad Ismail Al Talhat
Gold Apex EA Gold Apex EA é um Expert Advisor automatizado e avançado, desenvolvido exclusivamente para a plataforma MetaTrader 4, projetado especificamente para scalping de alta frequência e execução por momentum em Ouro (XAUUSD) usando o gráfico de 1 minuto. O sistema foi concebido para navegar pela ação de preço rápida e pelas mudanças de liquidez inerentes à negociação de metais preciosos através de regras sistemáticas e rigorosos controlos de risco. Estratégia de Negociação Principal O si
SignalX Session Breakout
Ahmed Ismail Muhammad Ismail Al Talhat
SIGNALX SESSION BREAKOUT O Indicador Definitivo de Ação de Preço Institucional e Mapeamento de Intervalos para MetaTrader 4 VISÃO GERAL DO PRODUTO E VANTAGEM DE MERCADO Bem-vindo ao SignalX Session Breakout — uma solução de análise técnica de nível de elite projetada exclusivamente para traders profissionais, desenvolvedores algorítmicos e especialistas em price action que exigem precisão matemática absoluta no MetaTrader 4. Nos mercados financeiros modernos, a identificação de rastros
SignalX Trade Panel
Ahmed Ismail Muhammad Ismail Al Talhat
What this is An on-chart control panel for manual MT4 trading. Instead of typing a lot size and hoping it is right, you set a risk percent once and every button on the panel sizes the position from your stop distance and the symbol tick value. What it does On-chart BUY/SELL buttons that size the position from a risk percent, plus CLOSE ALL and BE ALL. Interactive chart panel with risk-based sizing; no dependency on any indicator. Runs as an Expert Advisor attached to a single chart. No DLL calls
SignalX ATR Stop Planner
Ahmed Ismail Muhammad Ismail Al Talhat
What this is A planning tool that projects a volatility-based stop and target onto the chart and tells you the lot size that a fixed risk percent implies at that distance. Useful before you commit to a trade, and useful for building the habit of sizing from risk rather than from feeling. What it does Draws ATR-based stop and target levels and shows the lot size for a fixed risk percent. Volatility-adaptive stop projection drawn live on the chart. Runs as an Expert Advisor attached to a single ch
SignalX Break Even Guardian
Ahmed Ismail Muhammad Ismail Al Talhat
What this is A trade manager that works in R multiples. Once a position reaches a chosen R multiple it protects the trade, optionally takes partial profit, and only then starts trailing. It never opens trades. What it does Moves stops to break-even at a chosen R multiple, optionally takes a partial close, then trails. R-multiple driven management rather than fixed pip triggers; partial-close state persisted globally. Runs as an Expert Advisor attached to a single chart. No DLL calls. No external
SignalX Daily Risk Guard
Ahmed Ismail Muhammad Ismail Al Talhat
What this is An account-level circuit breaker. It watches the day's closed results plus floating profit and loss, and when a daily loss limit or a maximum trade count is reached it can stop new orders on the panel and flatten what is open. What it does Stops the day when a loss limit or a max-trade count is reached, and can flatten open positions. Account-level daily circuit breaker computed from closed history plus floating P/L. Runs as an Expert Advisor attached to a single chart. No DLL calls
SignalX Spread Monitor
Ahmed Ismail Muhammad Ismail Al Talhat
What this is A small on-chart readout of current spread, with a warning threshold, a colour state and an optional countdown to the next candle. Spread is a cost that most EAs and most manual traders simply do not measure. What it does Live spread versus 60-bar average, current session bucket, and seconds to the next bar close. Combines spread context, session awareness and bar timing in one compact panel. Runs as an Expert Advisor attached to a single chart. No DLL calls. No external services. N

SignalX Trade Journal Export
Ahmed Ismail Muhammad Ismail Al Talhat
What this is Writes your closed trade history to a CSV file on a timer or every tick, including commission and swap, with a totals row at the end. The point is a clean spreadsheet you can actually analyse offline instead of screenshots. What it does Writes the full closed-trade history to a CSV with a totals row, on a timer or every tick. Clean spreadsheet output including commission, swap and a computed total. Runs as an Expert Advisor attached to a single chart. No DLL calls. No external servi
SignalX Session Range Levels
Ahmed Ismail Muhammad Ismail Al Talhat
What this is Draws the high and low of a configurable session window together with the recent range history, so the levels that price has repeatedly reacted to are visible without hand-drawing them every day. What it does Marks the high and low of a configurable session for the last N sessions as extending levels. Historical session ranges kept as live trend lines, configurable wrap-around sessions. Runs as an Expert Advisor attached to a single chart. No DLL calls. No external services. No netw
SignalX Exposure Lens
Ahmed Ismail Muhammad Ismail Al Talhat
What this is Most multi-pair traders think in positions, not in currencies. Three long EURUSD trades and one short EURJPY feel diversified, but the book is really one large long EUR position. Exposure Lens opens every trade, splits it into its base and quote leg, nets every leg of the same currency together, converts the result into your account currency and shows what share of your equity each currency actually represents. What it does Nets every open position into per-currency long/short expos
SignalX Order Session Guard
Ahmed Ismail Muhammad Ismail Al Talhat
What this is Pending orders left overnight and positions carried through the weekend are two of the most common ways a planned trade turns into an unplanned risk. This utility handles the clock for you: it cancels pending orders that have been sitting for longer than you allow, closes everything at a session end time you choose, and forces a cut-off before the Friday close. What it does Expires stale pending orders, flattens all positions at a chosen session end time, and forces a Friday cut-off
SignalX Range Compression Scanner
Ahmed Ismail Muhammad Ismail Al Talhat
What this is Ranges compress before they expand. This indicator finds the bars where the Bollinger band width is in the lowest percentage of a lookback window and where the compression has lasted for a minimum number of bars, then draws each zone as a box with the upper and lower breakout levels extended to the right and the box height in points. What it does Marks historical squeeze zones where Bollinger width sits in the lowest x% of the lookback, boxes each run, extends the two breakout level
SignalX Volatility Regime Gauge
Ahmed Ismail Muhammad Ismail Al Talhat
What this is An ATR value of 12 points means very different things on EURUSD H1 and on gold M5. This indicator turns ATR into a percentile: the current ATR is ranked against the previous bars, and the result is plotted on a 0 to 100 scale with four bands. 20 means the market is quieter than 80 percent of the recent past; 90 means it is near the most volatile reading of the window. What it does Plots the percentile rank of ATR over a lookback window as a 0-100 oscillator with LOW / NORMAL / ACTIV
SignalX Currency Strength Meter
Ahmed Ismail Muhammad Ismail Al Talhat
What this is A currency is not strong or weak on its own; it is strong or weak against the others. This dashboard builds one score per major currency by measuring the change of every pair that currency appears in and crediting the base side with that change while debiting the quote side by the same amount. Averaging those credits gives eight numbers that can be compared directly. What it does Builds one strength score per currency from the change of every pair it appears in, and ranks all eight
SignalX Daily Range Envelope
Ahmed Ismail Muhammad Ismail Al Talhat
What this is Every symbol has a typical day. When a symbol has already travelled most of that distance, the rest of the day usually holds less, and a breakout strategy that works on a fresh day can stall on a spent one. This indicator measures the average daily range from history and projects half, three quarters and all of it above and below today open, so the scale of the current move is obvious at a glance. What it does Measures the average daily range over N days and projects 50%, 75% and 10
SignalX Hourly Range Stats
Ahmed Ismail Muhammad Ismail Al Talhat
What this is Not every hour of the trading day moves the same amount, and the difference matters: a breakout at a dead hour is far more likely to fail than the same setup during the session when the symbol actually travels. This indicator averages the high-low range of each hour of the server day over a number of days and shows all twenty-four hours as a ranked table. What it does Averages the high-low range of every hour of the server day over N days and ranks all 24 hours with a bar and a perc
SignalX Level Alert Grid
Ahmed Ismail Muhammad Ismail Al Talhat
What this is Watching several charts for a handful of price levels is a poor use of attention. This tool watches the levels for you. You type a list such as 1.0850;1.0900;EURUSD 1.2700 into one input, and it alerts when price approaches, touches or crosses each level. Every level fires once, so an alert means something happened rather than repeating all day. What it does Watches a list of price levels, on one symbol or several, and alerts on approach, touch and cross, each firing once per level.
SignalX Margin Buffer Guard
Ahmed Ismail Muhammad Ismail Al Talhat
What this is When margin runs low, the broker closes whatever it decides to close, usually the largest position and usually at the worst moment. This utility acts before that point with two stages: an alert at a warning level you set, and then an orderly close of the least profitable position once a lower level is reached, pausing between closes and stopping as soon as margin recovers. What it does Warns at one margin level and starts closing the least profitable position, one at a time with a c
SignalX Pending Order Grid
Ahmed Ismail Muhammad Ismail Al Talhat
What this is Placing a ladder of pending orders by hand is slow and error-prone, and one mistyped lot size turns a plan into an accident. This tool builds the whole ladder in one action: a fixed number of levels per side, a fixed distance between them, one lot size, and optional stop loss and take profit in points. Before anything is sent it draws exactly where the orders would sit, and it only places them when you set the arming input to true. What it does Places a symmetric ladder of buy-limit
SignalX Prop Challenge Tracker
Ahmed Ismail Muhammad Ismail Al Talhat
What this is Evaluation accounts are scored on rules, not on feelings, and the rules are unforgiving in one direction: a profit target is a goal, but a daily loss limit or a maximum drawdown is a hard stop. This tracker keeps all three numbers on the chart at once, measured from the starting balance you enter, so the distance between where the account is and where it is allowed to go is always visible. What it does Tracks profit-target progress, worst daily loss and worst total loss against the
SignalX Spread History Export
Ahmed Ismail Muhammad Ismail Al Talhat
What this is The spread you are quoted is a cost you pay on every trade, and most traders never measure it. This recorder samples the spread on a schedule, for one symbol or for everything in Market Watch, and appends it to a CSV file inside the terminal data folder. The result is a record you can open in a spreadsheet and use to compare hours, days and brokers. What it does Samples live spread on a fixed interval, one symbol or the whole Market Watch, and appends time / symbol / spread / ask /
SignalX Weekend Gap Detector
Ahmed Ismail Muhammad Ismail Al Talhat
What this is Weekend gaps are one of the few market events that can be measured exactly on your own chart. This indicator marks every gap between the Friday close and the Monday open, draws it as a zone, and reports what share of the recent gaps were filled and how long the fill took on average for this symbol. What it does Finds every weekend gap, draws it as a zone and reports what share of the last N gaps were filled and how many bars the fill took on average. Converts a folk belief into a pe
Visual Lot Size Calculator
Ahmed Ismail Muhammad Ismail Al Talhat
Visual trade planning and lot calculation utility for MetaTrader 5. Description: This utility allows traders to plan their entries visually directly on the chart. By using interactive graphical boxes, you can define your entry, stop loss, and take profit levels before opening a position. The software automatically calculates the required volume (lots) based on your account settings. It provides real-time data updates as you move the graphical elements on the screen. Key Features: Interactive In
SignalX Spread Monitor MT5
Ahmed Ismail Muhammad Ismail Al Talhat
What this is A small on-chart readout of current spread, with a warning threshold, a colour state and an optional countdown to the next candle. Spread is a cost that most EAs and most manual traders simply do not measure. What it does On-chart readout of current spread in points, its 60-bar average, spread against a warning level, the active session and a countdown to the next bar close. Puts the cost of the trade on the chart next to the price, with a warning state, instead of hiding it in the
SignalX Level Alert Grid MT5
Ahmed Ismail Muhammad Ismail Al Talhat
What this is Watching several charts for a handful of price levels is a poor use of attention. This tool watches the levels for you. You type a list such as 1.0850;1.0900;EURUSD 1.2700 into one input, and it alerts when price approaches, touches or crosses each level. Every level fires once, so an alert means something happened rather than repeating all day. What it does Watches a list of price levels, on one symbol or several, and alerts on approach, touch and cross, each firing once per level.
SignalX Session Range Levels MT5
Ahmed Ismail Muhammad Ismail Al Talhat
What this is Draws the high and low of a configurable session window together with the recent range history, so the levels that price has repeatedly reacted to are visible without hand-drawing them every day. What it does Marks the high and low of a configurable session window and keeps the last N sessions on the chart as boxes, with breakout levels extended to the right and each box labelled with its range in points. Session structure on demand at any hour window, drawn as the actual tradable b
SignalX Volatility Regime Gauge MT5
Ahmed Ismail Muhammad Ismail Al Talhat
What this is An ATR value of 12 points means very different things on EURUSD H1 and on gold M5. This indicator turns ATR into a percentile: the current ATR is ranked against the previous bars, and the result is plotted on a 0 to 100 scale with four bands. 20 means the market is quieter than 80 percent of the recent past; 90 means it is near the most volatile reading of the window. What it does Plots the percentile rank of ATR over a lookback window as a 0-100 oscillator with LOW / NORMAL / ACTIV
Filtro:
Sem comentários
Responder ao comentário