IBI Footprint
- Indicadores
-
Brahim Eljaziri
 IBI-System
Trader since 2008, specialized in developing indicators and Expert Advisors for MetaTrader.
Focus: order flow tools based on real exchange data (footprint, imbalance, delta, CVD).
Educational tools only — not financial advice. - Versão: 1.60
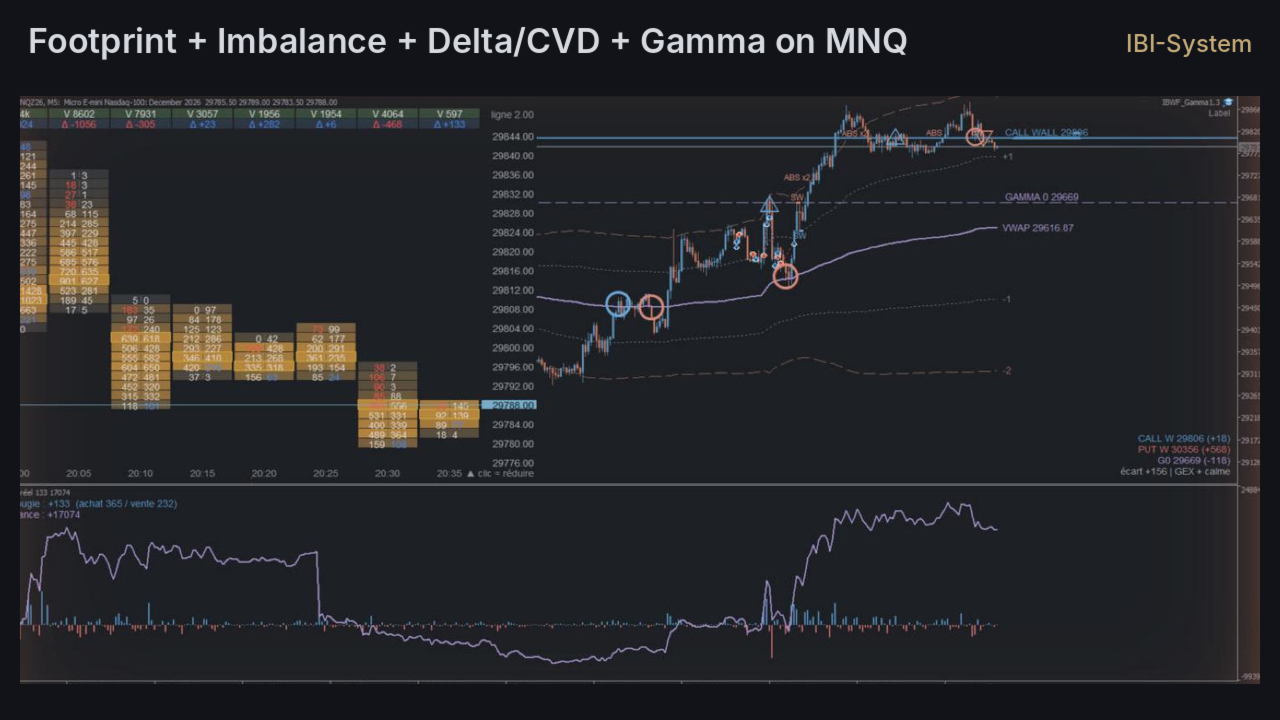
IBI Footprint draws a professional footprint chart from the real trades of the exchange: for every candle and every price level you see how many contracts were sold and how many were bought.
What you see
- Top of each column: candle volume (V) and delta (Δ = buys − sells).
- Each price row: sells | buys. Warmer cells = more volume.
- Diagonal imbalances highlighted (buyer in blue, seller in red).
- POC (price with the most volume) framed in gold.
- Click the panel to shrink it to a thin bar and see your candles again.
Requirements
- Real exchange data with buyer/seller side of each trade: exchange-traded futures (CME: MNQ, NQ, MES, ES…). A broker such as AMP Global USA gives this data even on a free demo account.
- On CFD / Forex symbols there is no real exchange volume: the indicator shows a message and stays inactive.
Main inputs
- Number of candles (columns), row size in ticks (0 = automatic), column width / row height, panel position and height.
- Diagonal imbalance: minimum ratio (default 300 %) and minimum volume.
- Colors (soft palette, easy on the eyes), shrunken panel height.
Free tool for education. It does not trade and gives no buy/sell advice. Trading involves risk.