Ict Assistant

  • Indicadores
  • Brahim Eljaziri
    Brahim Eljaziri
    IBI-System
    Trader since 2008, specialized in developing indicators and Expert Advisors for MetaTrader.
    Focus: order flow tools based on real exchange data (footprint, imbalance, delta, CVD).
    Educational tools only — not financial advice.
  • Versão: 3.4

⛔ NO AUTOMATIC EXECUTION – 100% MANUAL TRADING.

⛔ This indicator never opens, modifies or closes a trade. It shows you the ICT setups and calculates your risk. YOU decide and YOU place every order.

What it is
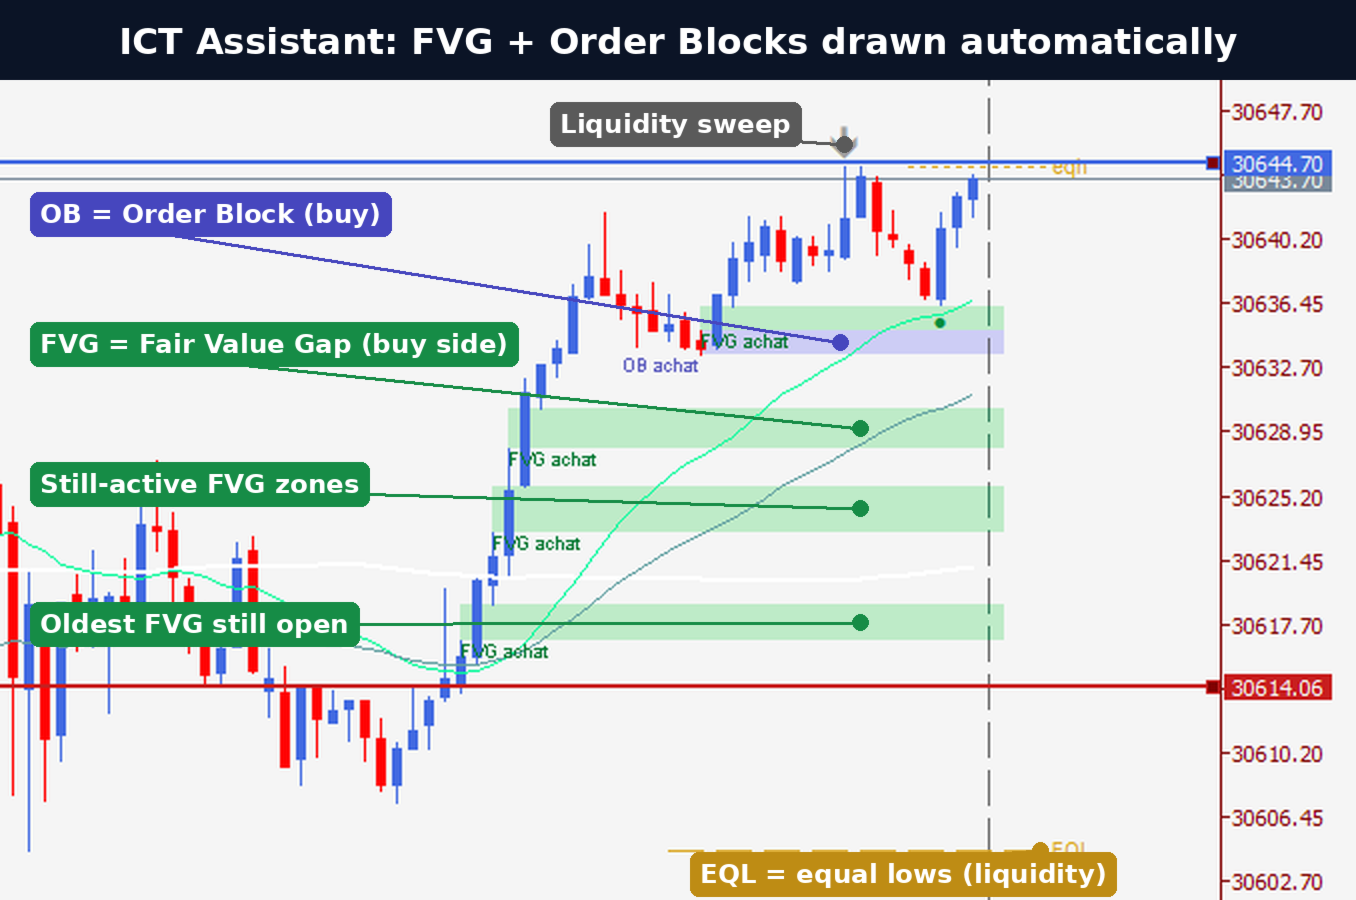
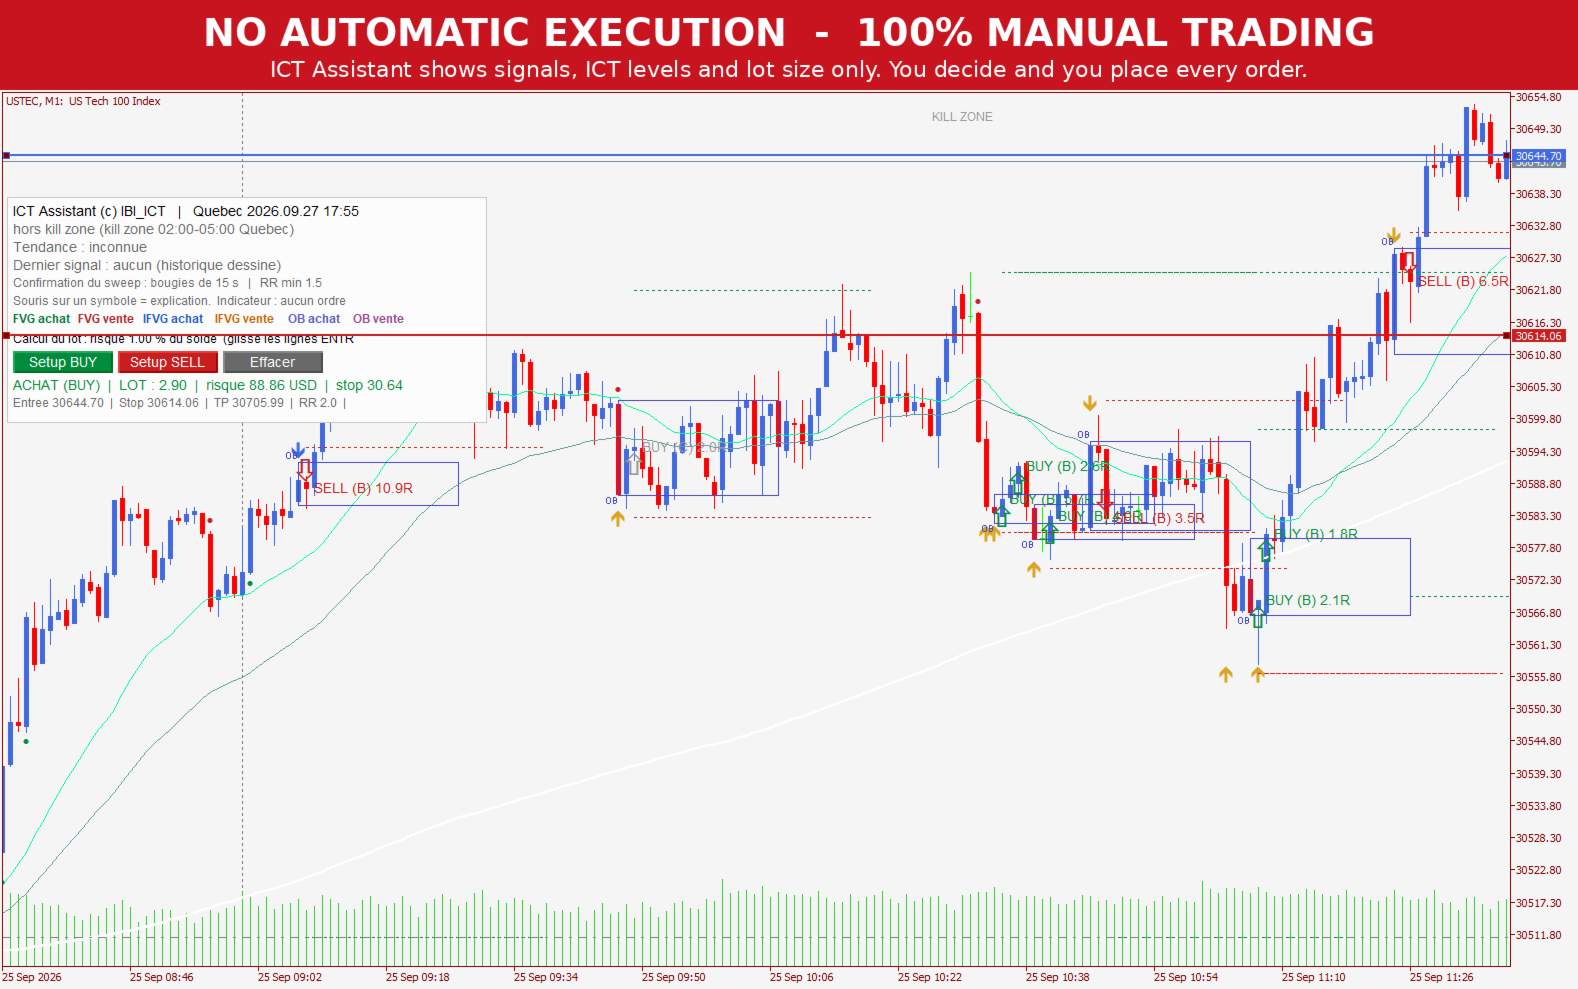
Ict Assistant draws the full ICT liquidity model directly on your chart, so you read the market the way ICT traders do: where the liquidity is, when it gets swept, and where price is likely to go next.

What you see on the chart

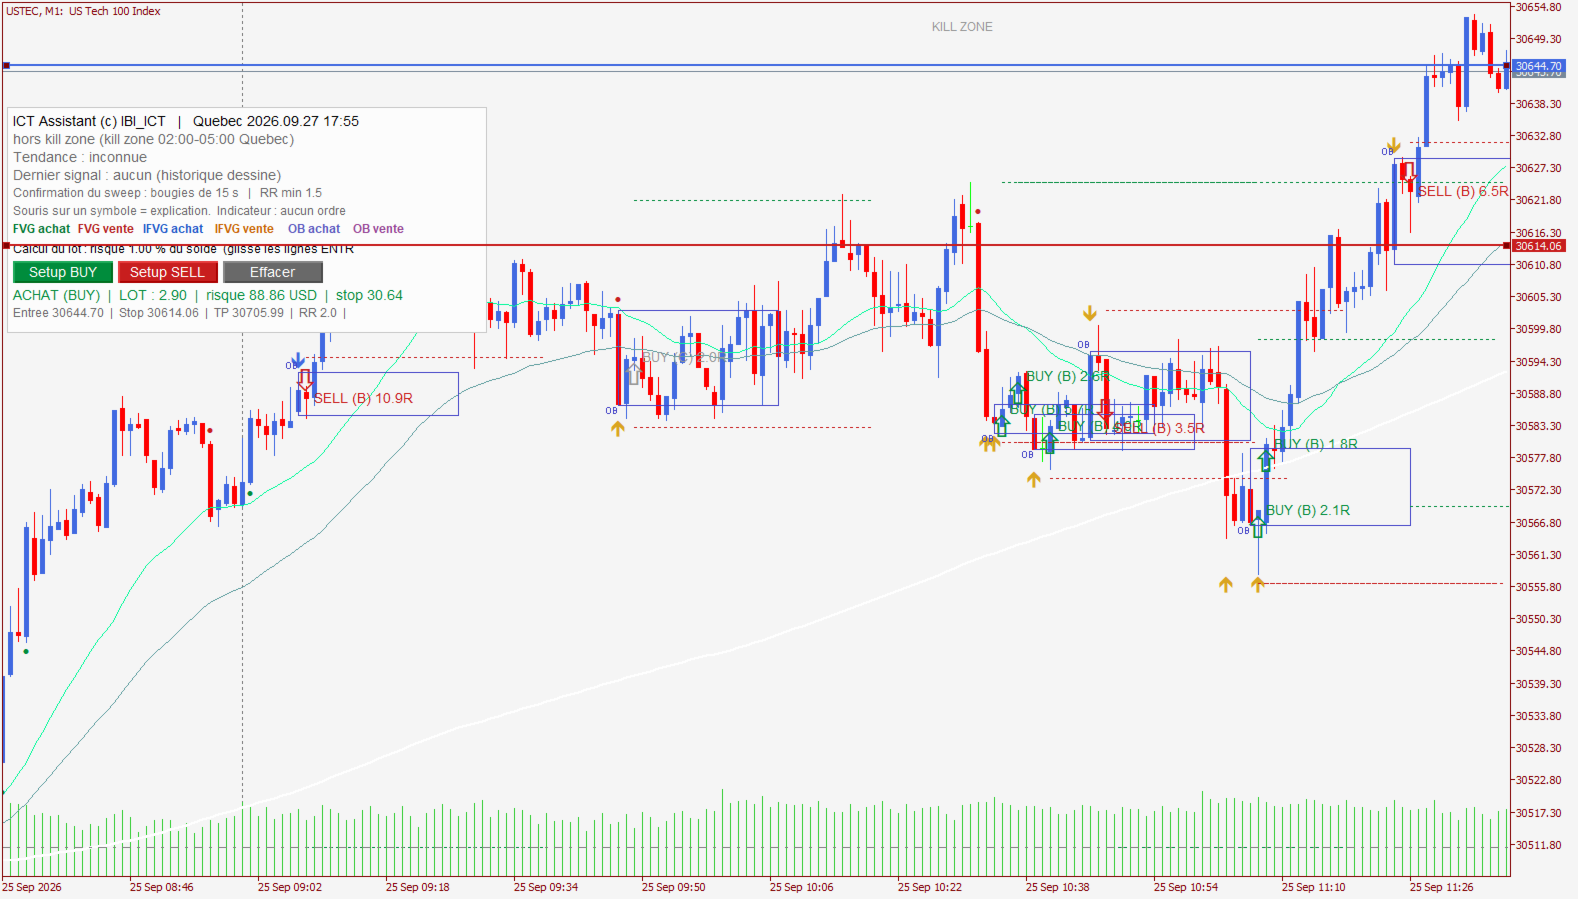
  • Kill zone (02:00–05:00 New York time) with clean vertical lines, plus the start and end of the trading day
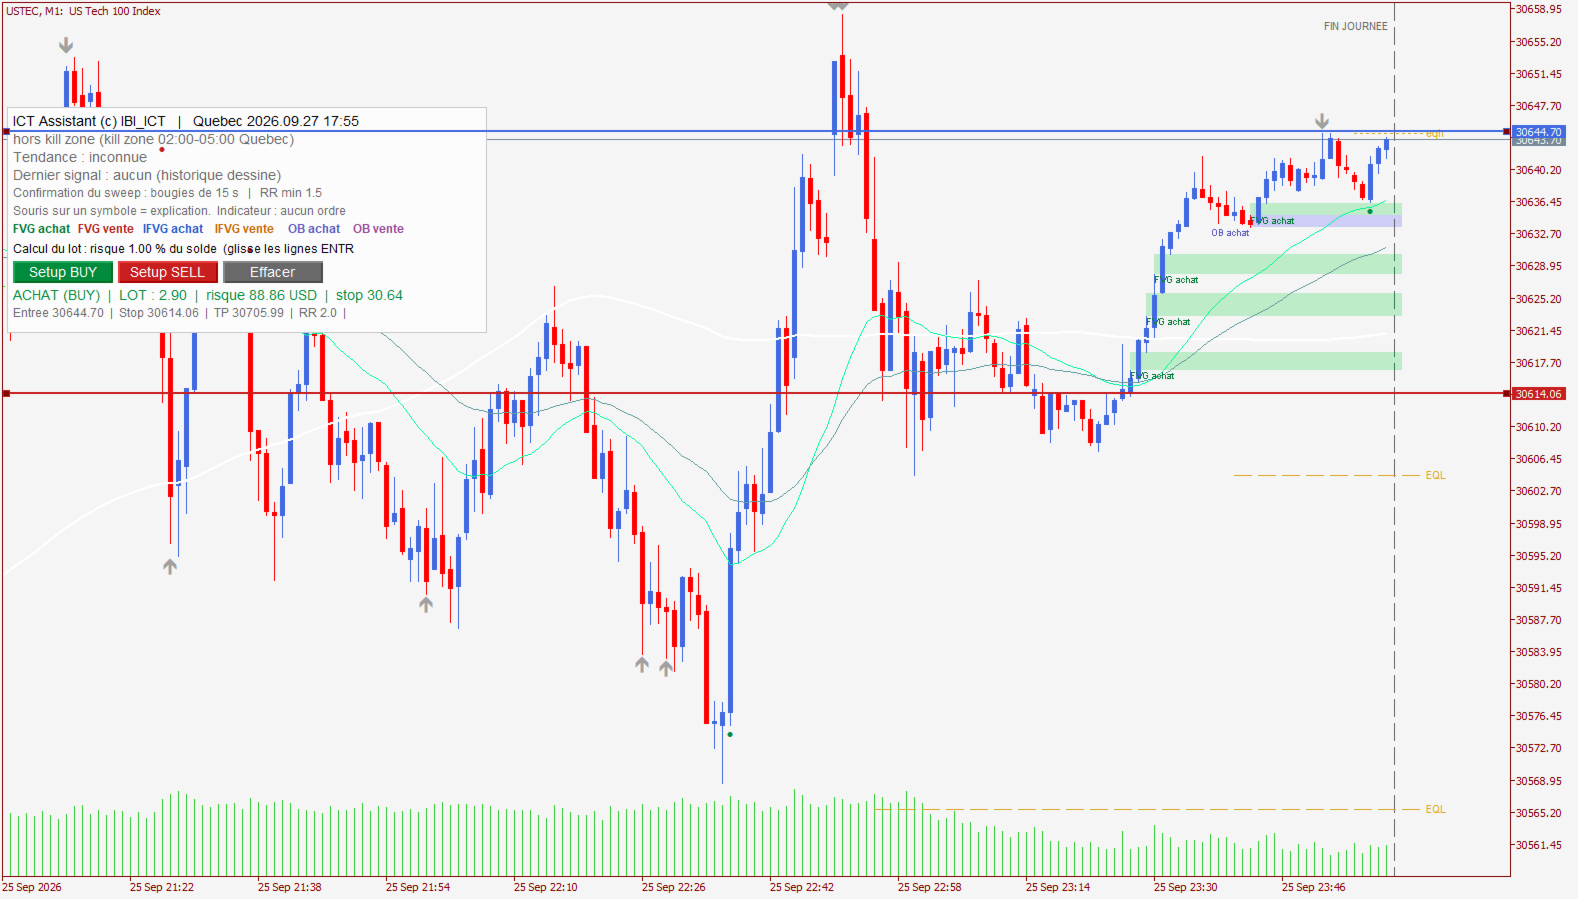
  • Liquidity pools: previous week high/low, previous day high/low (PDH/PDL), Asian range high/low, equal highs/lows
  • Sweeps of those levels, confirmed on 15-second candles (price takes the liquidity, then closes back inside)
  • FVG and IFVG (fair value gaps and inverted FVGs) that are still active
  • Order blocks (bullish / bearish) that are still valid
  • Displacement candles (strong moves)
  • Trend filter: H1 vs EMA 50 and price vs Midnight Open
  • Graded BUY / SELL setups (A = with the trend, B, C = weak) with a suggested stop behind the sweep wick and a target on the next liquidity level
  • Alerts: pop-up, sound and push notification to your phone on A/B setups

Built-in risk calculator

  1. Click Setup BUY or Setup SELL: ENTRY, STOP and TP lines appear on the chart.
  2. Drag the lines where you want them.
  3. The panel instantly shows the lot size for your risk % (1% by default), the amount at risk in your account currency, the stop distance and the RR.
  4. You place the order yourself, with the normal MT5 order window.

Important

  • Designed and tested for US100 / Nasdaq (USTEC, NAS100...) on the M1 chart. Other US indices (US500, US30) may work; results on forex, crypto or commodities are not guaranteed. The panel shows a warning on non-index symbols.
  • All times are displayed in New York time.
  • Set Server time zone in the inputs to match your broker (default: New York + 7h, used by FTMO, FundingPips, IC Markets...).
  • In the Strategy Tester you see the drawings and setups only. No trades are taken, because the indicator never trades.
  • This is a decision-support tool, not a guarantee of profit. Trading involves risk.

Inputs

  • Server time zone / UTC offset – your broker's server time
  • Pop-up, Push, Sound – alerts on A/B setups
  • Risk per trade (%) – used by the lot calculator (default 1%)
Produtos recomendados
Indicador Balance of Power (BOP) com suporte multi-timeframe, sinais visuais personalizáveis e sistema de alertas configurável. Serviços de programação freelance, atualizações e outros produtos TrueTL estão disponíveis no meu perfil MQL5 . Feedbacks e avaliações são muito apreciados! O que é o BOP? Balance of Power (BOP) é um oscilador que mede a força dos compradores em relação aos vendedores comparando a variação do preço com o range da vela. O indicador é calculado como (Fechamento - Abert
FREE
GDS Renko Pip ST Chart - Pip-Based Renko Chart Indicator for MetaTrader 5 GDS Renko Pip ST Chart is a pip-based Renko chart indicator for MetaTrader 5. It helps traders build and study cleaner Renko price movement using a practical fixed pip or point-based brick structure. This tool is designed as a Renko chart foundation for manual analysis. It does not predict the market, does not generate buy or sell signals and does not decide whether a trade should be opened. Renko EDGE EA Golden Delta | A
FREE
Donchian Breakout And Rsi
Mattia Impicciatore
4.33 (3)
Descrição geral Este indicador é uma versão aprimorada do Canal Donchian clássico, enriquecida com funções práticas para o trading real. Além das três linhas padrão (máxima, mínima e linha do meio), o sistema detecta breakouts e os mostra visualmente com setas no gráfico, exibindo apenas a linha oposta à direção da tendência atual para uma leitura mais limpa. O indicador inclui: Sinais visuais : setas coloridas nos breakouts Notificações automáticas : alerta pop-up, push e e-mail Filtro RSI : pa
FREE
TrendVision AI
Murtadha Majid Jeyad Al-Khuzaie
TrendVision AI – Smart Trend Channels & Price Forecasting for MetaTrader 5 Discover market structure and explore potential future price direction with TrendVision AI, an advanced technical indicator for MetaTrader 5 that combines automatic trendline analysis with a machine-learning-based price forecasting model. How Does TrendVision AI Work? TrendVision AI analyzes historical candlestick data within a configurable lookback window. It automatically draws two trendlines directly on the chart:
FREE
Indicador Average True Range (ATR) com suporte multi-timeframe, sinais visuais personalizáveis e sistema de alertas configurável. Serviços de programação freelance, atualizações e outros produtos TrueTL estão disponíveis no meu perfil MQL5 . Feedbacks e avaliações são muito apreciados! O que é o ATR? O Average True Range (ATR), desenvolvido por J. Welles Wilder, é um indicador técnico que mede a volatilidade do mercado. Ele calcula a média do True Range durante um período especificado. O True
FREE
O Trade Behavior Mirror lê apenas o histórico de operações já encerradas da sua própria conta e conta um único padrão: abrir uma nova posição pouco depois de uma perda realizada, com um lote maior do que o seu volume habitual. A ferramenta não prevê nada e não dá nenhum conselho. Cada número no painel é algo que já aconteceu nesta conta. Como os números são construídos: ela lê até 31 dias de negociações encerradas em todos os símbolos e todos os números mágicos - é uma visão de toda a conta, nã
FREE
PROMETHEUS TECHNICAN VERSION Free | By THE SONS A gift from The Sons — no strings, no trial, no expiry. Every trader deserves access to professional-grade market intelligence. That belief is why Prometheus Technical Version exists, and why it costs nothing. Consider it our handshake to the trading community. What You're Getting This is not a simplified tool dressed up as a gift. Prometheus Technican Version is a fully built, institutional-quality technical analysis indicator running a dual-model
FREE
PositionMap Pro — Account Overview Panel for MT5 A real-time panel that groups all open positions by symbol and shows Buy lots, Sell lots and net profit/loss directly on your chart — the whole account at a glance. Instead of counting lots symbol by symbol in the Terminal tab, PositionMap Pro groups everything automatically. You instantly see how much exposure you have on each symbol, split by direction. Panel example Symbol Buy Lot Sell Lot Net P/L EURUSD 0.50 — +12.30 XAUUSD — 1.00 −45.00 GBPUS
FREE
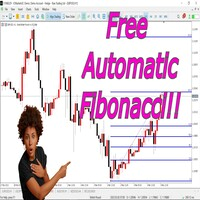
Free automatic Fibonacci is an indicator that automatically plots a Fibonacci retracement based on the number of bars you select on the BarsToScan setting in the indicator. The Fibonacci is automatically updated in real time as new highest and lowest values appears amongst the selected bars. You can select which level values to be displayed in the indicator settings. You can also select the color of the levels thus enabling the trader to be able to attach the indicator several times with differe
FREE
Indicator and Expert Adviser  EA Available in the comments section of this product. Download with Indicator must have indicator installed for EA to work. Mt5 indicator alerts for bollinger band and envelope extremes occurring at the same time. Buy signal alerts occur when A bullish candle has formed below both the lower bollinger band and the lower envelope  Bar must open and close below both these indicators. Sell signal occur when A bear bar is formed above the upper bollinger band and upper
FREE
Are you tired of drawing trendlines every time you're analyzing charts? Or perhaps you would like more consistency in your technical analysis. Then this is for you. This indicator will draw trend lines automatically when dropped on a chart. How it works Works similar to standard deviation channel found on mt4 and mt5. It has 2 parameters: 1. Starting Bar 2. Number of bars for calculation The   starting bar   is the bar which drawing of the trend lines will begin, while the   number of bars for c
FREE
Important Lines
Terence Gronowski
4.88 (24)
This indicator displays Pivot-Lines, preday high and low, preday close and the minimum and maximum of the previous hour. You just have to put this single indicator to the chart to have all these important lines, no need to setup many single indicators. Why certain lines are important Preday high and low : These are watched by traders who trade in a daily chart. Very often, if price climbs over or falls under a preday low/high there is an acceleration in buying/selling. It is a breakout out of a
FREE
Follow The Line MT5
Oliver Gideon Amofa Appiah
4.6 (35)
This indicator obeys the popular maxim that: "THE TREND IS YOUR FRIEND" It paints a GREEN line for BUY and also paints a RED line for SELL. (you can change the colors). It gives alarms and alerts of all kinds. IT DOES NOT REPAINT and can be used for all currency pairs and timeframes. Yes, as easy and simple as that. Even a newbie can use it to make great and reliable trades. NB: For best results, get my other premium indicators for more powerful and reliable signals. Get them here: https://www.m
FREE
True Risk
Oleksii Lishchenko
Seu lote pode arriscar mais do que o percentual que você definiu. O True Risk mostra o risco real da sua próxima operação antes de você abri-la. O problema As corretoras arredondam cada lote para baixo até um passo e nunca ficam abaixo do lote mínimo. Em uma conta pequena, só o lote mínimo pode ser muitas vezes o seu plano. Com 300 dólares e um stop no ouro a 25 dólares de distância, 0.01 lote já arrisca 25 dólares, ou seja, 8.3 por cento e não o 1 por cento que você definiu. O spread e a comiss
FREE
Easy GOLD MT5
Franck Martin
3.87 (45)
Easy Gold is the latest addition to the BotGPT family. It is surprising and very powerful. It is ideal for beginners due to its simplicity.  There is absolutely nothing to do, it's 100% automated, simply indicate the percentage of risk you want to take per trade and the EA is ready. Whatever your capital, the EA takes care of everything. Optimized on (XAUUSD).  Unleash all the power with the professional version (AGI Gold) and its connection to the neural network, available in my store. My othe
FREE
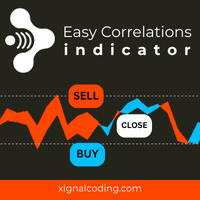
Easy Correlations Indicator The Easy Correlations Indicator is designed to help traders analyze the relationship between two correlated instruments. By monitoring the distance between their Relative Strength Index (RSI) values, the indicator highlights situations where one instrument has moved significantly further than the other. This creates potential trading opportunities: Sell the stronger instrument (overstretched RSI) Buy the weaker instrument (lagging RSI) Because the positions are opened
FREE
LT Donchian Channel
Thiago Duarte
4.86 (7)
Donchian Channel (ou canal de Donchian) é um indicador criado por  Richard Donchian. Ele é  formado tomando a máxima mais alta e a mais baixa mais baixa do último período especificado em velas. A área entre alta e baixa é o canal para o período escolhido. Sua configuração é simples. É possível ter a média entre a linha superior e inferior além de alertas quando o preço atinge um dos lados. Se tiver alguma dúvida ou encontrar alguma falha, me contate. Faça bom uso!
FREE
This indicator is an automated version of the Fibonacci retracement (Fib) indicator. Deciding the best areas to use when drawing the fib can be tricky and this  indicator was made with that in mind. When you drop it on the chart it will automatically choose the best points to draw the fib with, but in case you aren't satisfied with those regions, you can adjust it as you wish.
FREE
MACD Enhanced
Nikita Berdnikov
4 (4)
Introducing the MACD  Enhanced – an advanced MACD (Moving Average Convergence Divergence) indicator that provides traders with extended capabilities for trend and momentum analysis in financial markets. The indicator uses the difference between the fast and slow exponential moving averages to determine momentum, direction, and strength of the trend, creating clear visual signals for potential entry and exit points. Attention! To achieve the best results, it is recommended to adapt the indicator
FREE
GOM Trade Manager
Wannapach Chinnaprapa
GOM Trade Manager helps you execute trades the way you want it. Works on all instruments Forex, Commodities, & Crypto. It helps you with lot calculations, spread addition and balance calculations so you can just focus on actual trading. For full automatic planned management, stackable triggers and spread widening protection >> check out GOM Trade Manager Pro . ------------------------------------------NOTABLE FEATURES------------------------------------------ You set everything based on bid
FREE
See where the pullback should end before it happens. FiboZone OTE Map finds impulse legs that broke market structure and draws their optimal trade entry (OTE) zone, the 0.705 to 0.95 retracement of the move, on up to three timeframes at once. It tells you when price reaches a zone and when a lower timeframe confirms the turn inside it. What it shows OTE zones: for every impulse that breaks structure by at least 1.5 ATR, the 0.705 to 0.95 retracement zone is drawn from the impulse extreme to the
FREE
Haven Key Levels PDH PDL
Maksim Tarutin
4.91 (11)
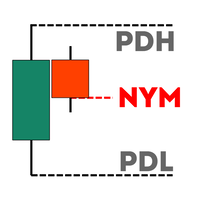
O indicador   "Haven Key Levels PDH PDL"   ajuda os traders a visualizar os níveis-chave no gráfico. Ele marca automaticamente os seguintes níveis: DO (Daily Open)   — o nível de abertura diária. NYM (New York Midnight)   — o nível da meia-noite de Nova Iorque. PDH (Previous Day High)   — o máximo do dia anterior. PDL (Previous Day Low)   — o mínimo do dia anterior. WO (Weekly Open)   — o nível de abertura semanal. MO (Monthly Open)   — o nível de abertura mensal. PWH (Previous Week High)   — o
FREE
Draggable Volume Profile
Basharat Umar Khan
5 (1)
Short Description Drag two lines to any chart range for an instant Fixed-Range Volume Profile (POC, Value Area VAH/VAL) featuring Delta Coloring, Developing Profile tracking, Initial Balance, HVN/LVN, and Retest Rays. Detailed Description The Fixed-Range Volume Profile & Delta Analyzer answers a foundational market structure question: At which price did the most trading activity actually occur within a specific timeframe? Simply drag the two vertical reference lines ( START and END ) anywhere o
FREE
CosmiCLab SMC FIBO CosmiCLab SMC FIBO is a professional trading indicator designed for traders who use Smart Money Concepts (SMC), market structure analysis and Fibonacci retracement levels. The indicator automatically detects market swings and builds Fibonacci levels based on the latest impulse movement. It also identifies market structure changes such as BOS (Break of Structure) and CHOCH (Change of Character), helping traders understand the current market direction. CosmiCLab SMC FIBO also pr
PZ Penta O MT5
PZ TRADING SLU
3.8 (5)
The Penta-O is a 6-point retracement harmonacci pattern which usually precedes big market movements. Penta-O patterns can expand and repaint quite a bit. To make things easier this indicator implements a twist: it waits for a donchian breakout in the right direction before signaling the trade. The end result is an otherwise repainting indicator with a very reliable trading signal. The donchian breakout period is entered as an input. [ Installation Guide | Update Guide | Troubleshooting | FAQ | A
FREE
BBMA with EMA50
Teeraporn Satitman
This indicator consist of Standard BBMA Standard signal Sign on chart added EMA50 Behavior Tracking: The chart background changes color based on the EMA50 (default is black) and shifts to white when a breakout of the Bollinger Bands occurs. Three Engulfing Color Change: Automatically adjusts colors to help you easily determine market zones. default yellow/white High-Low Line Sign: Highlights the potential trading range and key price levels for better visual  MHV
FREE
Totz Smart Money Concepts (FVG + Supply/Demand + Liquidity) Totz SMC is an all-in-one Smart Money Concepts (SMC) visual indicator engineered to clean up your charts, standardise market structure identification, and highlight high-probability institutional entry zones automatically. Key Features Fair Value Gaps (FVG): Automatically plots bullish and bearish imbalance zones with custom opacity and minimum size filtering. Supply & Demand Zones: Pinpoints explosive institutional displacement b
FREE
Desenha os preços de abertura diários, semanais e mensais atuais e anteriores como linhas rotuladas, os níveis que muitos traders intraday usam como pontos de viés e de reação. Principais recursos Calculado em barras fechadas, os valores não repintam Funciona em qualquer símbolo e timeframe Todos os períodos, níveis e cores podem ser alterados nos parâmetros Leve em recursos, com uma configuração de máximo de barras Os objetos são removidos automaticamente quando o indicador é excluído Parâmetro
FREE
VolumeBasedColorsBars
Henrique Magalhaes Lopes
VolumeBasedColorsBars — Free Powerful Volume Analysis for All Traders Unlock the hidden story behind every price bar! VolumeBasedColorsBars is a professional-grade, 100% FREE indicator that colorizes your chart candles based on real, adaptive volume analysis. Instantly spot surges in market activity, identify exhaustion, and catch the moves that matter. This indicator gives you:    • Dynamic color-coded bars for instant volume context    • Adaptive thresholds based on historical, session-awar
FREE
Spike Catch Pro
Amani Fungo
4.14 (7)
Spike Catch Pro 22:03 release updates Advanced engine for searching trade entries in all Boom and Crash pairs (300,500 and 1000) Programmed strategies improvements Mx_Spikes (to combine Mxd,Mxc and Mxe), Tx_Spikes,   RegularSpikes,   Litho_System,   Dx_System,   Md_System,   MaCross,   Omx_Entry(OP),  Atx1_Spikes(OP),   Oxc_Retracement (AT),M_PullBack(AT) we have added an arrow on strategy identification, this will help also in the visual manual backtesting of the included strategies and see ho
FREE
Os compradores deste produto também adquirem
Trend Sniper X
Sarvarbek Abduvoxobov
4.86 (44)
Trend Sniper X é um indicador de acompanhamento de tendência para múltiplos tempos gráficos no MetaTrader 5 que ajuda os traders a identificar a direção da tendência e potenciais pontos de reversão com clareza e precisão. para MT4: https://www.mql5.com/en/market/product/193245 Informações sobre o preço: O preço atual é promocional e está sujeito a alterações à medida que novas atualizações e funcionalidades forem lançadas. Oferta Bônus: Para obter o Auto-Trade Assistant EA GRATUITO para este in
Um novo Rei chegou à cidade - Indicador + Gestão de Ordens (TP1 + TP2 + TP3) + Enviador opcional de sinais para Telegram INCLUÍDO (GRÁTIS) (SISTEMA COMPLETO DE TRADING e SINAIS) Nosso melhor EA para Ouro: Gold Slayer Este indicador inclui uma estratégia avançada, um sistema de trading com gestão de ordens personalizável e um sistema de reversão à média que combina extensões de envelopes, apoiado por múltiplos filtros inteligentes de confirmação, como o RSI, para capturar entradas de reversão de
Smart Trend Trading System — MetaTrader 5 Após a compra, envie-me uma mensagem no MQL5 para receber Smart Universal Expert Advisor GRÁTIS, além do curso online, do manual em PDF e do acesso ao grupo privado. O STTS reúne a direção da tendência, sinais de entrada e saída, zonas de reversão e níveis de preço importantes diretamente no seu gráfico. Siga o sistema manualmente ou conecte um EA compatível separado para executar operações automaticamente com as configurações que você escolher. UM SISTE
Zoryk Gold
Reda El Koutbane
4.78 (18)
O desconto termina em 24 horas — próximo preço $ 69 ZORYK — Sistema avançado de sinais para XAUUSD no MetaTrader 5 Você conhece essa sensação. Você passa muito tempo analisando o ouro. Espera pela entrada certa. Finalmente abre a operação e o preço começa imediatamente a se mover contra você. Você fecha cedo demais, move o Stop Loss ou hesita por alguns segundos. Depois disso, o mercado alcança exatamente o destino que você esperava originalmente, mas sem você dentro da operação. O problema ne
Tenha sua vantagem no trading à vista! M5 Sniper é um novo indicador da MeanFX. Ele combina sinais de trading precisos com níveis adaptativos de TP/SL — criando, como resultado, as melhores operações estatísticas possíveis! O preço aumenta a cada 5 compras, o próximo preço é de 69$ Envie-me uma mensagem após a compra para receber dicas/guia e um EA bônus O que o faz se destacar? Desempenho estatístico comprovado no Gold XAUUSD ( funciona em praticamente todos os ativos , com foco em dominar um ú
O Entry Points Pro mostra onde entrar, onde colocar o stop e com qual lote operar — antes de você colocar a ordem. PREÇO Agora 199 USD: 10 cópias por este preço, depois 249 USD. O preço final é 349 USD. Eu ganho meu dinheiro operando nos mercados e mostro isso, por isso não preciso vender este indicador para todo mundo. É uma ferramenta para traders que pensam por conta própria, não um botão mágico. Sem rompimento, não há operação. Uma seta cinza é um sinal cancelado: o preço não rompeu o candl
Ultra Indicator
Ihor Otkydach
5 (1)
O ULTRA é um indicador técnico que funciona numa base «tudo-em-um» — analisa o mercado de forma independente, gera sinais de negociação, apresenta níveis para definir ordens de stop-loss e sugere quando encerrar as negociações para garantir lucros ou minimizar perdas. Por outras palavras, não importa se não sabe analisar o mercado, determinar níveis — onde definir o seu stop-loss — ou se tem dificuldades com a gestão do capital. O ULTRA fará tudo isso por si! BÓNUS PARA O COMPRADOR: Após adquiri
Gann Made Easy   é um sistema de negociação Forex profissional e fácil de usar, baseado nos melhores princípios de negociação usando a teoria do sr. W. D. Gann. O indicador fornece sinais precisos de COMPRA e VENDA, incluindo níveis de Stop Loss e Take Profit. Você pode negociar mesmo em movimento usando notificações PUSH. Entre em contato comigo após a compra para receber instruções de negociação e ótimos indicadores extras gratuitamente! Provavelmente você já ouviu muitas vezes sobre os método
SuperScalp Pro
Van Minh Nguyen
4.54 (37)
SuperScalp Pro - Professional Multi-Layer Confluence Scalping System O SuperScalp Pro é um indicador avançado de scalping que aprimora o Supertrend clássico com vários filtros inteligentes de confirmação. Ele ajuda a identificar oportunidades de Buy/Sell com maior probabilidade de sucesso, reduzindo significativamente os sinais falsos. Setas claras de Buy e Sell aparecem diretamente no gráfico, juntamente com os níveis de Stop Loss e Take Profit baseados em ATR, calculados automaticamente em tem
GoldenX Entry MT5
VividMind Digital Solutions
5 (17)
GoldenX Entry é um indicador para MT5 com um algoritmo adaptativo Smart Entry Trend, um sistema de pontuação de sinais, um detector de regime de mercado e um filtro de volatilidade. Cada sinal inclui um nível de entrada calculado, três níveis de Take-Profit (TP1, TP2, TP3) e um nível de Stop-Loss. Ele é construído sobre múltiplas camadas analíticas projetadas para se adaptar a diferentes condições de mercado, combinando um sistema analítico multicamadas com um otimizador integrado e um sistema d
Gold Trend Coach MT5
Cristhian Alexander Gaibor Cuasquer
4.27 (11)
Sinais de compra e venda sem repintura para o ouro (XAUUSD) no MetaTrader 5. Todo sinal vem com stop loss e três take profits. Um filtro Smart Money Concepts com BOS e CHoCH, para você operar a favor da estrutura, não contra ela. Um Mentor ao vivo no seu painel que guia cada passo, da entrada até o TP3. E alertas direto no seu celular e no seu próprio canal do Telegram. Isso é o Gold Trend Coach. Nunca mais opere sozinho. KIT DO COMPRADOR GRÁTIS junto com a sua compra: 1. Telegram Alert Bridge:
SMC Intraday Formula
VividMind Digital Solutions
5 (26)
Vamos ser honestos primeiro. Nenhum indicador sozinho vai te tornar lucrativo. Se alguém te disser o contrário, está te vendendo um sonho. Qualquer indicador que mostre setas perfeitas de compra/venda pode ser feito para parecer impecável — basta dar zoom na parte certa da história e tirar um print das operações vencedoras. Nós não fazemos isso.  SMC Intraday Formula é uma ferramenta. Ela lê a estrutura do mercado para você, identifica as zonas de maior probabilidade de preço e mostra exatament
Boba Analysis Suite
Trade Ready Solutions LLC
5 (2)
Boba Analysis Suite O Boba Analysis Suite é um indicador de análise para o MetaTrader 5. Reúne a estrutura do mercado, as zonas de preço relevantes e o contexto geral do mercado numa única visualização do gráfico. Desenvolvido a partir da experiência prática como trader e formador de traders, apoia um processo de análise estruturado: avaliar a direção do mercado, identificar níveis importantes e analisar vários períodos gráficos em conjunto. Análise em contexto O significado de cada sinal depend
Gold Entry Sniper
Tahir Mehmood
5 (23)
Gold Entry Sniper – Painel ATR Multi-Tempo Profissional para Scalping e Swing Trading em Ouro Gold Entry Sniper é um indicador avançado para MetaTrader 5 projetado para fornecer sinais de compra/venda precisos para XAUUSD e outros ativos, com base na lógica de Trailing Stop ATR e análise multi-tempo . Ideal tanto para scalpers quanto para swing traders. Principais Recursos e Vantagens Análise Multi-Tempo – Veja a tendência de M1, M5 e M15 em um único painel. Trailing Stop Baseado em ATR – Níveis
Próxima Atualização — Versão 2.52 em Breve! [NOVO] Prepare-se para 4 Grandes Novos Recursos Projetados para Aprimorar sua Análise de Mercado e seu Fluxo de Trabalho de Trading Estamos levando a análise de mercado a um novo nível com 4 novos recursos desenvolvidos para atender às suas necessidades de trading. Apresentamos: 1. TRADE OVERVIEW DASHBOARD 2. CONFLUENCE AT ZONE 3. STRONG & WEAK HIGH/LOW 4. OTE 1. TRADE OVERVIEW DASHBOARD Um painel que ajuda você a compreender mais facilmente o panoram
FX Power MT5 NG
Daniel Stein
5 (33)
FX Power: Analise a Força das Moedas para Decisões de Negociação Mais Inteligentes Visão Geral FX Power é a sua ferramenta essencial para compreender a força real das principais moedas e do ouro em quaisquer condições de mercado. Identificando moedas fortes para comprar e fracas para vender, FX Power simplifica as decisões de negociação e revela oportunidades de alta probabilidade. Quer você prefira seguir tendências ou antecipar reversões usando valores extremos de Delta, esta ferramenta adap
M1 Sniper MT5
Oleg Rodin
5 (7)
O   M1 SNIPER   é um sistema indicador de negociação fácil de usar. É um indicador de seta projetado para o período M1. O indicador pode ser usado como um sistema independente para scalping no período M1 e pode ser usado como parte do seu sistema de negociação existente. Embora este sistema de negociação tenha sido projetado especificamente para negociação no M1, ele também pode ser usado em outros períodos. Originalmente, desenvolvi este método para negociar XAUUSD e BTCUSD. Mas considero-o úti
FiboSniper Pro
Van Minh Nguyen
5 (4)
FiboSniper Pro – Multi-Filter Fibonacci System with Auto SL/TP and Control Panel FiboSniper Pro é um indicador técnico que combina Fibonacci Envelopes dinâmicos com vários filtros de confirmação para gerar sinais seletivos de Buy e Sell. Os níveis de Fibonacci são calculados com base em Moving Average e ATR e, em seguida, filtrados por ADX, EMA, RSI, ATR, Volume, Time e estrutura das velas. O indicador exibe diretamente no gráfico os níveis automáticos de Stop Loss e Take Profit baseados em ATR,
Auto Optimized SpeedAngle é um sistema de vetorização de momentum de nível institucional que elimina o sobreajuste ( curve-fitting ) por meio da otimização contínua de avanço ( Walk-Forward Optimization , WFO). Em vez de depender de entradas estáticas que se degradam quando os regimes de mercado mudam, o indicador recalibra dinamicamente seus parâmetros utilizando validação fora de amostra ( Out-of-Sample , OOS), garantindo que os sinais exibidos representem vantagens estatísticas genuínas e não
SQN Max indicator for MT5 by ITC
Renaud Herve Francois Candel
Sqn Max Indicator Sqn Max is an exclusive indicator to trade the market with high effectiveness. The indicator is based on price action, volatility and trend. This indicator is as simple as possible but not too simple. The indicator can generate alerts to ease the trading process. You don't have to stay all day in front of your screen. The indicator can be used with any class of assets and with any time frame. It is possible to achieve better results trading our list of selected assets. We achi
Smc Pro ToolKit
Talal N Z Aljarusha
5 (14)
SMC PRO TOOLKIT — SMART MONEY ANALYSIS & STRUCTURED TRADE PLANNING SMC Pro ToolKit is a professional Smart Money Concepts analysis workspace for MetaTrader 5. It combines market structure, multi-timeframe analysis, institutional price zones, setup evaluation, confirmation tools, volume context, alerts, and risk planning inside one organized chart environment. One workspace. Multiple layers of confirmation. One structured trading plan. OPEN COMPLETE USER GUIDE MULTI-CONDITION SETUP ENGINE At
SIO Oscillator: oscilador auto-otimizável de desequilíbrio de semivariância Compre o indicador e receba GRÁTIS o Expert Advisor (EA) baseado nele. A maioria dos osciladores trata todo movimento de preço da mesma forma. O SIO separa a pressão de alta da pressão de baixa e mede o desequilíbrio entre elas, mostrando qual lado realmente controla o mercado: compradores ou vendedores. Quando o desequilíbrio atinge um extremo, o SIO gera um sinal claro com níveis de entrada, Stop Loss e Take Profit. O
Power Candles MT5
Daniel Stein
4.58 (12)
Power Candles V3 - Indicador de força com auto-otimização O Power Candles V3 transforma a força da moeda e do instrumento num plano de negociação prático em todos os gráficos aos quais está associado. Em vez de se limitar a colorir as velas, executa uma otimização automática em tempo real em segundo plano e apresenta-lhe os melhores valores de Stop Loss, Take Profit e limiar de sinal para o símbolo em questão. Basta um clique para o adotar na negociação em tempo real — as linhas de entrada, Stop
Atomic Analyst MT5
Issam Kassas
4.51 (65)
Atomic Analyst — MetaTrader 5 Após a compra, envie-me uma mensagem no MQL5 para receber Smart Universal Expert Advisor GRÁTIS, além do curso online, do manual em PDF e do acesso ao grupo privado. O Atomic Analyst reúne a ação do preço, a direção da tendência, sinais de entrada e saída, Stop Loss e vários níveis de Take Profit diretamente no seu gráfico. VEJA O SINAL. ENTENDA O CENÁRIO. O Atomic Analyst organiza sua análise em informações visuais claras: • Setas de compra e venda para identificar
Unix Scalper
Issam Kassas
4 (4)
Unix Scalper — MetaTrader 5 Após a compra, envie-me uma mensagem no MQL5 para receber Smart Universal Expert Advisor GRÁTIS, além do curso online, do manual em PDF e do acesso ao grupo privado. Identifique a oportunidade. Veja o plano. Escolha como operar. O UNIX Scalper reúne análise de mercado, decisões BUY/SELL/WAIT e níveis de Entry, Stop Loss, TP1 e TP2 em um painel organizado. VEJA O SINAL E O PLANO • Decisões claras: BUY, SELL ou WAIT. • Níveis definidos: Entry, Stop Loss, TP1 e TP2. •
Tokyo mt5 Indicator
Vasiliy Strukov
5 (15)
O Tokyo Indicator oferece uma visão geral visual clara da direção da tendência, de possíveis sinais de negociação e das condições de mercado. Sua linha de tendência em degraus e codificada por cores distingue as fases de alta (azul) das fases de baixa (magenta). Setas direcionais correspondentes destacam possíveis oportunidades de compra e venda quando a tendência exibida muda. Um painel integrado reúne o sinal atual, o viés de mercado, o momentum, a volatilidade e a qualidade do sinal em uma v
Astral Structure
Ottaviano De Cicco
Astral Structure Avalie o setup. Veja o plano inicial. Oferta de lançamento - $99. $149 após o lançamento. Um setup de estrutura levanta várias perguntas: a visão mais ampla concorda, onde está a referência de stop e como os alvos são definidos? O Astral Structure reúne essas questões em um espaço de trabalho para traders discricionários que baseiam suas decisões na estrutura do mercado. Concentre-se no setup relevante. Revise em conjunto o setup elegível mais recente, sua direção e sua qualific
Crystal Heikin Ashi Signals
Muhammad Jawad Shabir
5 (5)
Crystal Heikin Ashi Signals—Professional Trend & Signal Detection Indicator Advanced Heikin Ashi Visualization with Intelligent Signal System for Manual & Automated Trading Final Price: $149 ---------> Price goes up $10 after every 10 sales . Limited slots available — act fast . Overview User Guide PDF Crystal Heikin Ashi Signals is a professional-grade MetaTrader 5 indicator that combines pure Heikin Ashi candle visualization with an advanced momentum-shift detection system. Designed for both m
Trend Catcher ind mt5
Ramil Minniakhmetov
5 (18)
INDICADOR TREND CATCHER O Indicador Trend Catcher analisa os movimentos de preços do mercado, utilizando uma combinação de indicadores de análise de tendências adaptativos, proprietários e personalizados pelo autor. Identifica a verdadeira direção do mercado, filtrando o ruído de curto prazo e focando a força do momentum subjacente, a expansão da volatilidade e o comportamento da estrutura de preços. Utiliza também uma combinação de indicadores personalizados de suavização e filtragem de tendê
Indicador multi-moeda de força e momentum MT5 O Dynamic Forex28 Navigator é a evolução dos nossos indicadores populares de longa data, reunindo o poder de cinco em um: Advanced Currency Strength28 Indicator (700 avaliações) Advanced Currency IMPULSE with ALERT (530 avaliações) Currency Strength EXOTICS GOLD Impulse with Alert CS28 Combo Signals (bônus atual) Não é necessário comprar quatro indicadores e empilhá-los nos seus gráficos. Tudo está reunido em um único indicador poderoso: a força dos
Mais do autor
IBI Footprint draws a professional footprint chart from the real trades of the exchange : for every candle and every price level you see how many contracts were sold and how many were bought . What you see Top of each column: candle volume (V) and delta (Δ = buys − sells). Each price row: sells | buys. Warmer cells = more volume. Diagonal imbalances highlighted (buyer in blue, seller in red). POC (price with the most volume) framed in gold. Click the panel to shrink it to a thin bar and see your
FREE
IBI Imbalance shows who is in control — buyers or sellers — directly on the price chart, from the real trades of the exchange. What you see Bubbles : buy imbalances (blue) and sell imbalances (red), read diagonally like a footprint. Bigger bubble = more volume; stacked imbalances = stronger signal. A large live imbalance pulses. Large aggressive orders reconstructed from the trades (triangles). ABS (absorption) : heavy aggressive volume that does not move the price. SW (sweep) : several large or
FREE
IBI Real Delta CVD calculates the real delta of each candle (contracts bought at the ask − contracts sold at the bid) from the real trades of the exchange — not from tick volume. What you see (separate window) Histogram: delta of each candle (blue = buyers, red = sellers). Line: CVD , the cumulative delta of the session, reset at the New York open (9:30) and the Tokyo open (9:00) — each can be turned off. Live text: delta of the current candle (buys / sells) and session CVD. Requirements: real e
FREE
IBI Vwap
Brahim Eljaziri
IBI Vwap draws the Volume-Weighted Average Price calculated on the real volume of the exchange , with ±1 and ±2 standard-deviation bands. What you see VWAP : the average price paid by all participants since the session start, weighted by real traded volume. Institutions use it as a benchmark: above it buyers are in control, below it sellers are. ±1 and ±2 standard-deviation bands : how far price stretches from its average. The ±2 band marks an extension zone. Short labels on the right: VWAP (wit
FREE
IBI Volume Profile shows, for each session, how much real exchange volume traded at every price — calculated trade by trade from the real trades of the exchange. What you see Volume profile of each session: one thin horizontal line per price level. The longer the line, the more contracts traded at that price — you see at a glance where the market accepted price (high volume) and where it rejected it (low volume). POC (Point of Control): the price with the highest traded volume of the session. VA
FREE
IBI Gamma Levels draws the main options gamma levels of the Nasdaq-100 on your MNQ / NQ chart: CALL WALL — largest positive gamma exposure (often acts as resistance), PUT WALL — largest negative gamma exposure (often acts as support), GAMMA 0 (gamma flip) — where total exposure changes sign: above it the market tends to be calmer, below it more volatile, GEX bars of the strikes near the price, and a small panel with each level and its distance to price. Data: free CBOE delayed quotes for NDX opt
FREE
Filtro:
Sem comentários
Responder ao comentário