SecondsTicksChart
- Utilitários
- Versão: 1.0
- Ativações: 10

SecondsTicksChart displays seconds and tick candlestick charts in MetaTrader 5.
Use fixed time intervals or a fixed number of ticks to examine price movement in more detail than a standard one-minute chart. SecondsTicksChart builds candles from your broker's tick data and displays them on the same chart through a custom symbol. No separate feeder chart is required.
This is a charting utility implemented as an Expert Advisor. It is designed for display and analysis and does not place or manage orders.
Chart modes and features
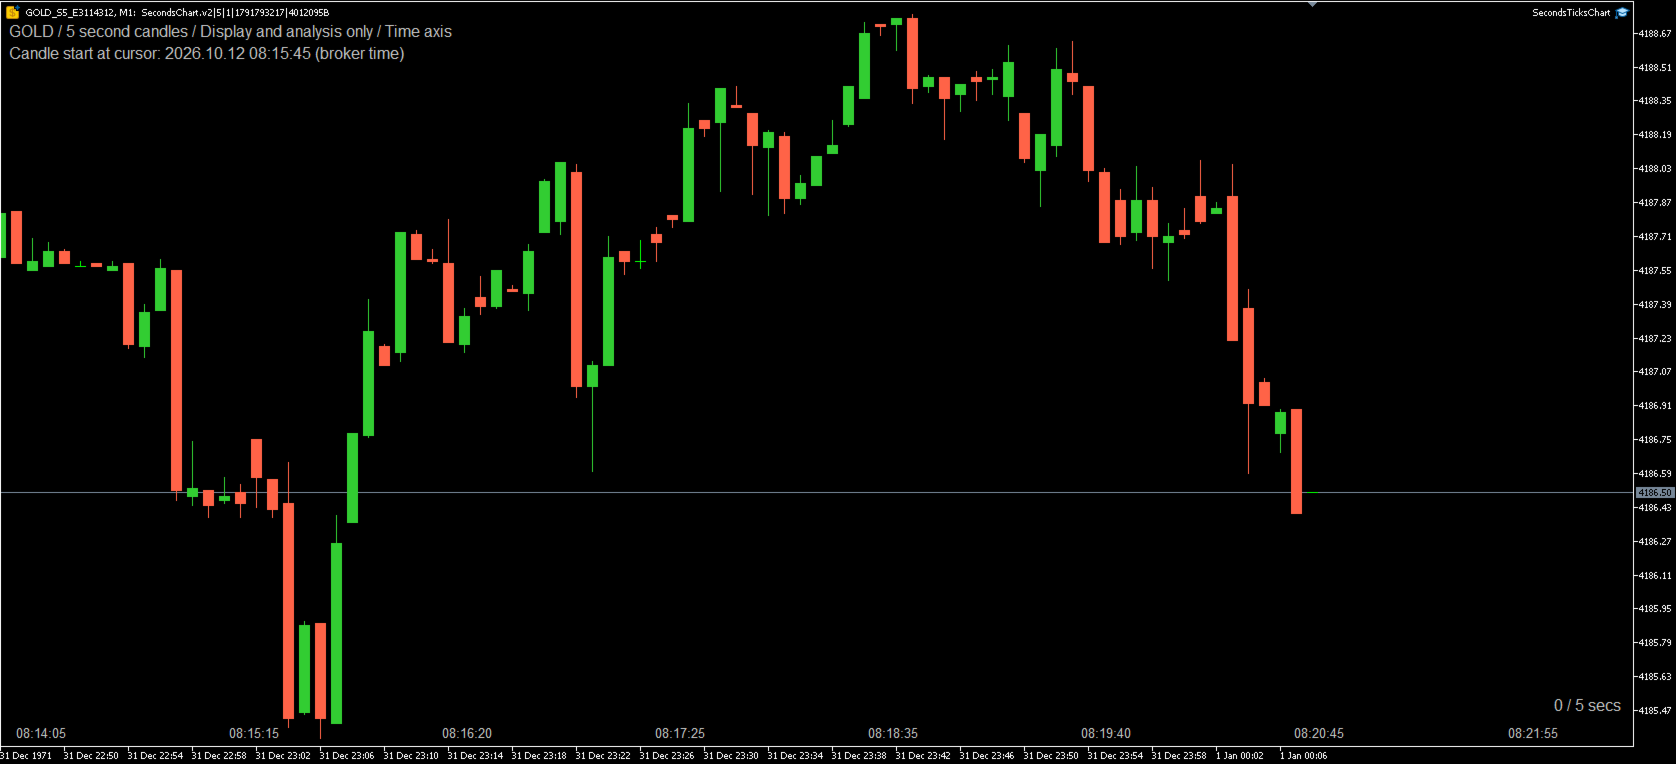
Seconds mode groups valid price ticks into fixed intervals from 1 to 3,600 seconds. The default is 5 seconds per candle. You can choose intervals such as 1, 7, 10 or 15 seconds. Each candle opens at the first valid price in its interval and closes at the last. Intervals without ticks are omitted; the utility does not create artificial candles to fill gaps.
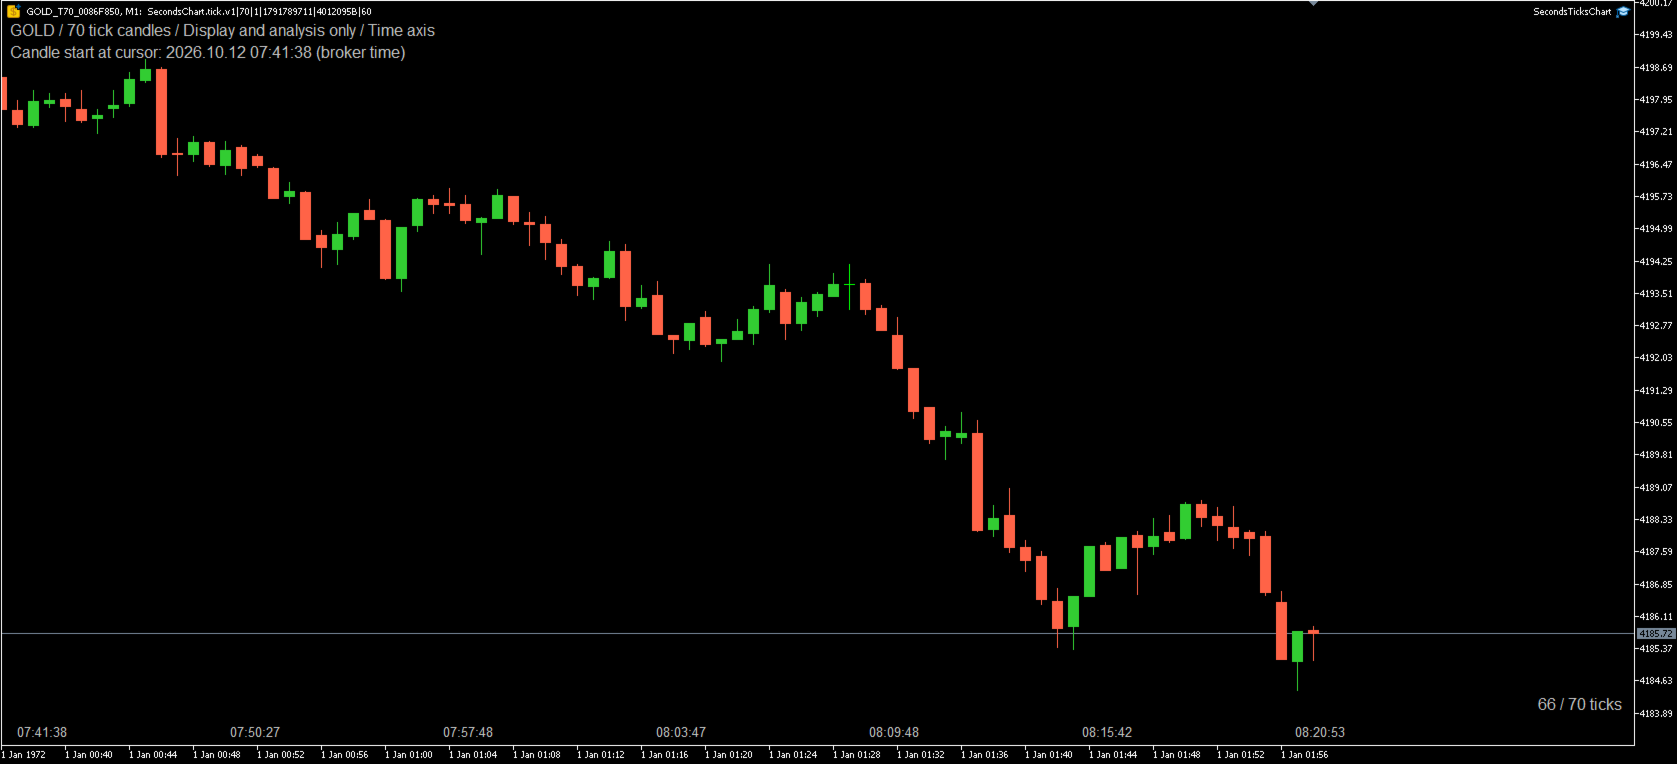
Tick mode creates a candle from a selected number of valid ticks, from 1 to 1,000,000. The default is 70 ticks per candle. Candle duration varies with market activity. Repeated prices still count as ticks. Bid, Ask and midpoint modes use quote events, while Last mode uses trade events.
Choose the source symbol and price basis: the source symbol's default Bid/Last setting, Bid, Ask, Last or the Bid/Ask midpoint. Recent candles are restored from available broker tick history, and the current candle updates as new data arrives.
Customize bullish and bearish candle bodies, wicks and borders. Actual candle start-time labels, top-left status information and candle formation progress can be shown or hidden independently. The formation display shows elapsed seconds or the accepted tick count, such as "2 / 10 secs" or "10 / 70 ticks", in the bottom-right or top-right chart corner.
You can add compatible indicators and drawing objects to the generated chart. Indicators that depend on real timestamps, trading sessions, exact symbol names or other timeframes may require adaptation.
Getting started
- Attach SecondsTicksChart from the Navigator's Expert Advisors section to a normal chart of your broker's source symbol.
- Select Seconds candles or Tick candles and set the relevant candle size. Adjust the price source and display settings as needed.
- Wait for tick history to load. The same chart switches to the generated custom symbol. Add your indicators and drawings after the generated chart appears.
Keep the utility attached and the terminal connected to receive updates. Initial loading time depends on the requested history and the data available from your broker.
Input parameters
Candle settings
| Parameter | Default | Description |
|---|---|---|
| Chart type | Seconds candles | Select Seconds candles or Tick candles. |
| Seconds per candle (1-3600) | 5 | Fixed interval in seconds; used only in seconds mode. |
| Ticks per candle (1-1000000) | 70 | Number of valid ticks per candle; used only in tick mode. |
| Source symbol (blank = current or saved source) | Blank | Broker symbol to read. A blank value uses the current symbol, or the saved source on a generated chart. |
| Candle price | Same as source symbol | Use the source's Bid/Last setting, Bid, Ask, Last or the Bid/Ask midpoint. |
| Initial history to restore (minutes) | 60 | Request 1-10,080 minutes of tick history before the latest source tick, subject to availability. |
| Refresh interval (milliseconds) | 250 | Update interval from 100 to 5,000 milliseconds; separate from candle size. |
Candle colors
| Parameter | Default | Description |
|---|---|---|
| Bullish candle body color | LimeGreen | Body color for bullish candles. |
| Bearish candle body color | Tomato | Body color for bearish candles. |
| Bullish wick and border color | LimeGreen | Wick and border color for bullish candles. |
| Bearish wick and border color | Tomato | Wick and border color for bearish candles. |
Display settings
| Parameter | Default | Description |
|---|---|---|
| Show top-left information | true | Show source, chart type, status and time information. |
| Show actual candle start times | true | Show actual start-time labels in broker time, without timezone conversion. |
| Show candle formation | true | Show elapsed seconds or the current candle's tick count. |
| Candle formation position | Bottom right | Select Bottom right or Top right. |
| Time and status text color | Silver | Text color for time, status and formation labels. |
| Font size | 9 | Information and formation text size, from 6 to 24. |
| Bottom-left actual-time font size | 12 | Actual-time label size, from 6 to 24, independent of the information text size. |
Chart behavior and requirements
The generated chart uses the custom symbol's M1 timeframe to display each seconds or tick candle. The M1 label does not mean that a candle represents one real minute. The standard time axis, crosshair, Data Window and indicator timestamps use virtual time. Use the utility's actual start-time labels to read candle times in broker time.
The utility requires the MetaTrader 5 desktop terminal, a logged-in trading account and tick data for the selected broker symbol. Historical coverage and chart updates depend on the broker's data and the terminal connection. Last-price mode requires trade ticks with valid Last prices. The Strategy Tester is not supported.
Use one generator instance per custom symbol. The utility occupies the chart's Expert Advisor slot; attaching another Expert Advisor to that chart replaces it and stops updates. Additional charts can display the same generated symbol without another generator instance.
Removing the utility stops updates but retains the custom symbol, stored history and your drawings. To return to a standard chart, remove the utility and select the original broker symbol and a normal timeframe. While the utility is attached, changing the timeframe returns the generated chart to M1.
Drawings from the original chart are not automatically converted. Check time-based drawings when changing the source, chart mode or candle settings. Tick charts reuse their saved history origin when restarted with the same configuration, so restoration may cover more than the requested history period and take longer. If retrieved tick history no longer matches saved candle start times, updates stop with a status message; changing the history setting creates a new generated symbol.
No DLL imports or WebRequest access are required.