Minty Pullback
- Experts
- Versão: 1.0

When the EMA20 crosses the EMA50, a trend has started. Minty Pullback does not chase that move. It waits for the price to pull back to the EMA20, then enters as soon as the trend resumes, with a stop just past the pullback. There is no fixed target. The trade stays open until the trend ends, so the few long trends pay for the many small stops.
How it trades
- Timeframe: signals come from H4 bars, whatever chart it is attached to.
- Trend: the H4 EMA20 above the EMA50 is an uptrend; below it is a downtrend. The daily EMA20/50 must point the same way. It only buys in uptrends and only sells in downtrends.
- Pullback: a bar dips to the H4 EMA20 (or rises to it, in a downtrend) without closing past the EMA50.
- Entry: within 6 bars of the dip, a bar closes back past the EMA20 and past the previous bar's high (its low, for sells). The EA buys or sells at the start of the next bar. Each pullback is traded only once.
- Stop: every trade has a stop loss, just past the pullback's low (high, for sells) plus 0.2 × ATR, and always between 0.5 and 1.5 × ATR(14, H4).
- Exit: there is no fixed target. The trade closes when an H4 bar closes past the EMA50, when the EMA20 crosses back over the EMA50, or at the stop.
- One trade at a time per symbol. No grid, no martingale, no averaging, no AI.
Settings
| Setting | Default | Meaning |
|---|---|---|
| Maximum drawdown, % | 30 | Each trade risks 3% of this (30 → 0.9% of equity, at most 3%). Trades shrink once half of it is used. Losing half of it in one day pauses new trades until tomorrow (an open trade is kept). At the limit everything is closed and the EA stops |
| Magic number | 61280001 |
Panel
The panel shows:
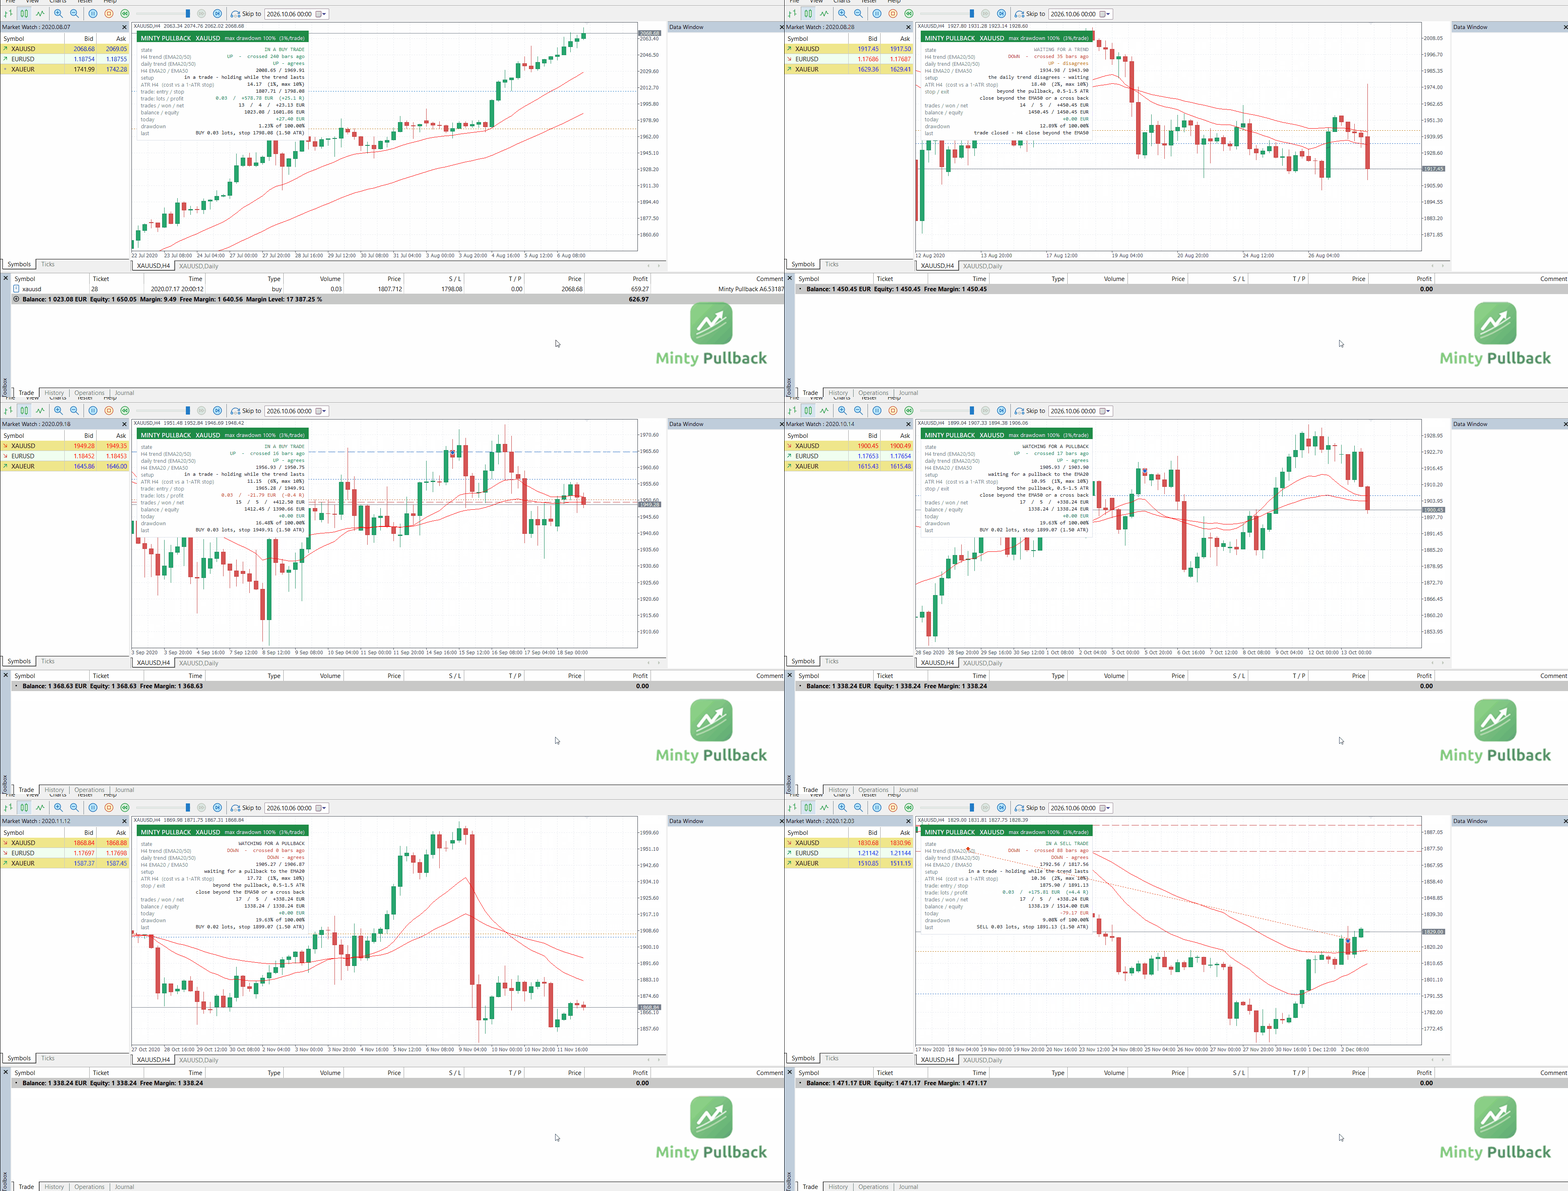
- the H4 trend and how long ago the EMAs crossed;
- whether the daily trend agrees;
- the H4 EMA20 and EMA50;
- the setup ("waiting for a pullback", "pulled back 2 bars ago – waiting for a close past the last high", "SIGNAL"…);
- the ATR and the cost of a trade;
- the open trade's entry, stop and profit in R;
- trades, wins and net result;
- today's result, equity and drawdown.
Lines on the chart mark the H4 EMA20 and EMA50 and the trade's entry and stop. On an H4 chart the EA also adds the two EMAs to the chart, and removes them when it is taken off.
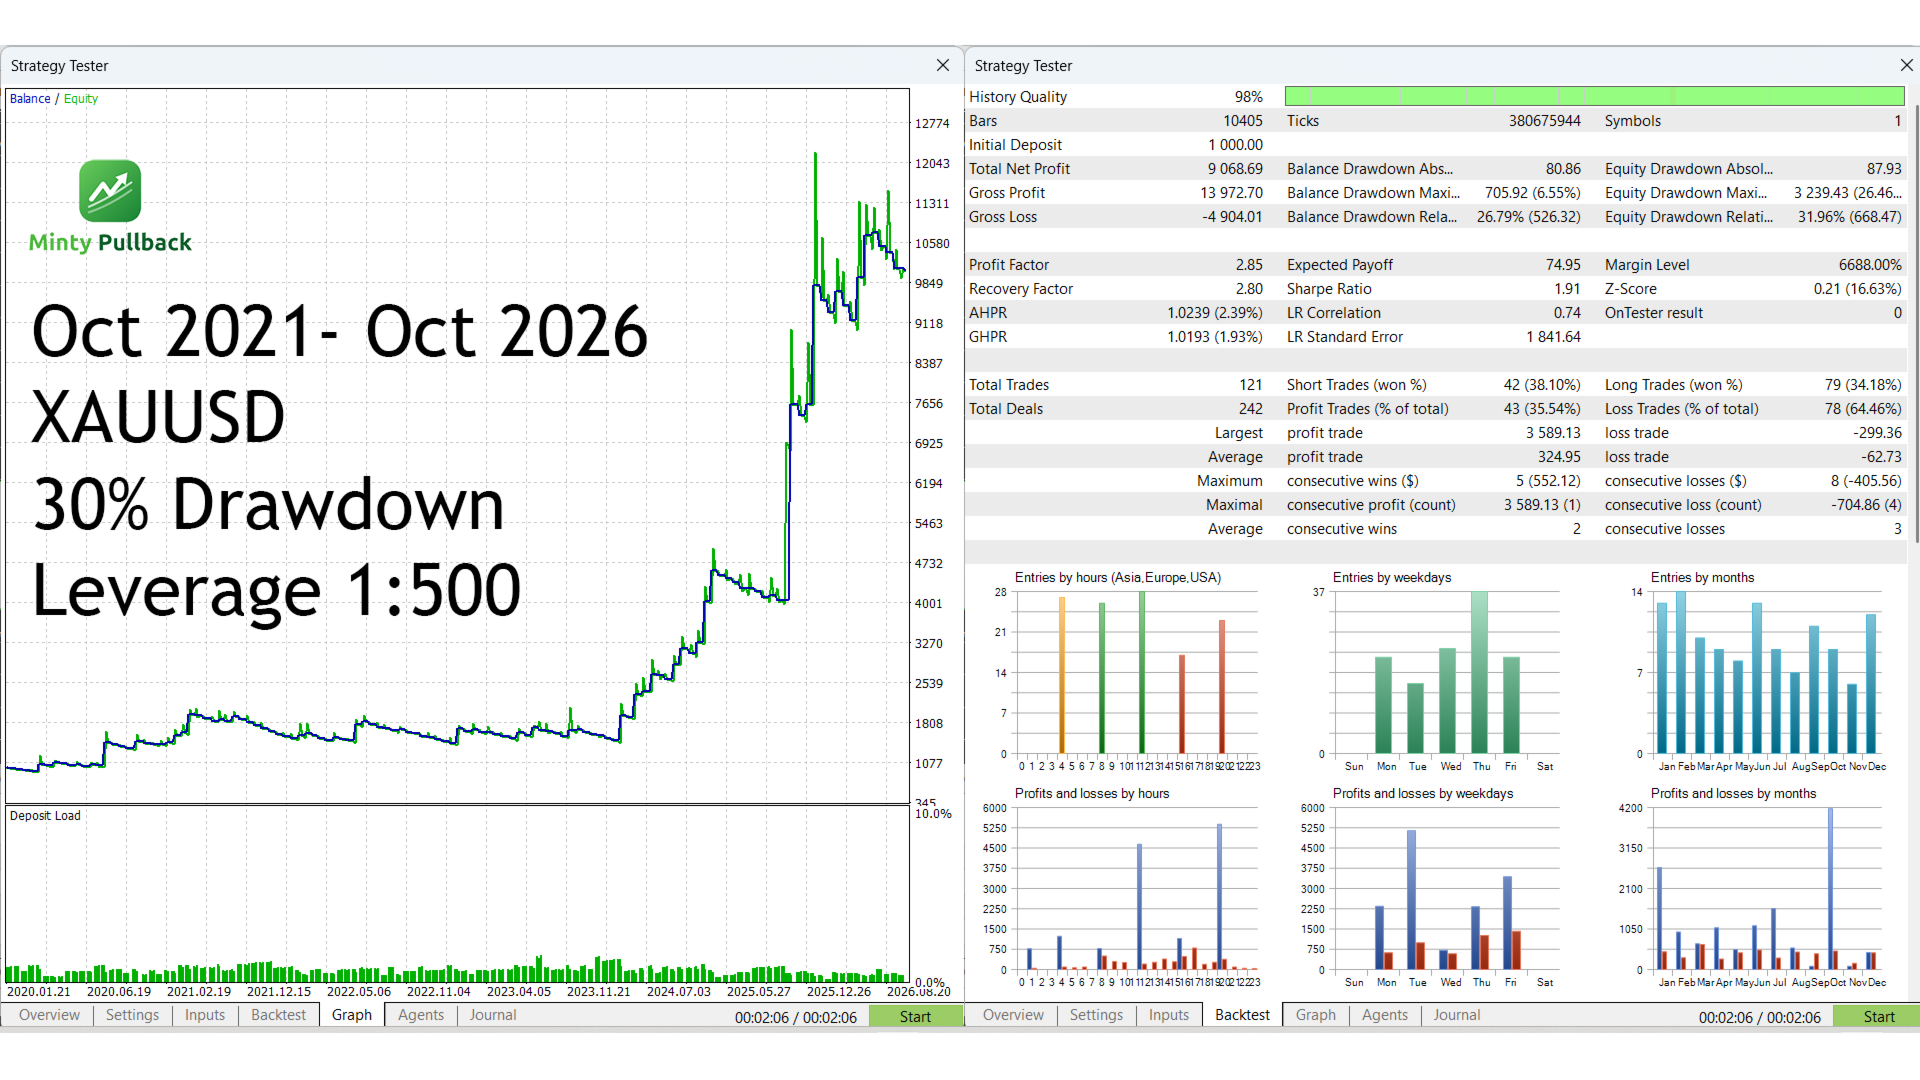
Simulation, 2013 – Aug 2026 (broker H4 bars, $0.50 cost per trade)
XAUUSD, maximum drawdown 30 (0.9% risk per trade):
- Result: ×3.64, with a 13.1% maximum drawdown. Since Oct 2021: ×2.16, with an 8.5% maximum drawdown.
- Trades: about 19 a year; 32% end in profit.
- Average trade: a win averages +3.9 R and a loss −0.94 R. Profit factor 1.94. The longest losing streak was 9 trades.
- Years: 2013 +21%, 2014 +5%, 2015 +4%, 2016 +4%, 2017 −1%, 2018 −3%, 2019 −1%, 2020 +21%, 2021 +8%, 2022 −7%, 2023 +7%, 2024 +31%, 2025 +45%, 2026 (to August) +14%.
| Maximum drawdown setting | Risk per trade | Result since 2013 | Deepest drawdown | Worst year |
|---|---|---|---|---|
| 10 | 0.3% | ×1.58 | 4.3% | −2.2% |
| 30 | 0.9% | ×3.64 | 13.1% | −6.7% |
| 50 | 1.5% | ×7.60 | 21.7% | −11.3% |
| 100 | 3.0% | ×34.2 | 41.8% | −22.7% |
Other symbols (same rules, maximum drawdown 30):
| Symbol | R per trade | Result since 2013 | Deepest drawdown |
|---|---|---|---|
| XAUUSD | +0.60 | ×3.64 | 13% |
| ETHUSD (from 2017) | +0.78 | ×4.29 | 23% |
| USDJPY | +0.26 | ×1.76 | 19% |
| XAGUSD | +0.24 | ×1.55 | 26% |
| BTCUSD | +0.24 | ×1.57 | 33% |
| GBPUSD | +0.15 | ×1.37 | 16% |
| EURJPY | +0.14 | ×1.32 | 11% |
| EURUSD | −0.10 | ×0.73 | 40% |
| AUDUSD | −0.26 | ×0.49 | 54% |
Trend pullbacks work where markets trend: gold, the yen pairs and crypto. On range-bound pairs such as EURUSD, AUDUSD, NZDUSD, USDCHF and EURGBP they lose. Use it on XAUUSD.
These are simulated results. Past results do not guarantee future results.
Good to know
- Few winners do the work. Two trades in three are stopped out for a small loss. The profit comes from a handful of long trends a year: the 10 best trades out of 262 made most of the gain. Long flat stretches are normal; 2016–2019 and 2021–2023 went mostly sideways.
- Gaps: a weekend or news gap can jump past the stop, and the loss is then larger than planned.
- Swaps are paid on trades held for days; the median trade lasts 2 days, the longest lasted about 8 weeks.
Requirements and tips
- Symbol: XAUUSD, on any chart timeframe. Use H4 to see the setup on the chart. Attach one chart per symbol.
- Account: hedging or netting both work. On a netting account it skips the symbol while another position is open on it.
- Strategy Tester: use a chart timeframe of H4 or lower and "every tick" or "1 minute OHLC". The EA needs about 220 H4 bars and 120 daily bars of history before it trades.
- Cost gate: no entry while the spread and commission are more than 10% of the stop. Right after the daily open, when spreads widen, it retries for up to 30 minutes.
- Don't run it at full risk alongside Minty Gain, Minty Scalper or Minty Breakout; they trade the same gold trend.
- Try it on a demo account first.