Keltner Linear Channel
- Indicadores
- Versão: 1.21
- Atualizado: 2 abril 2020
- Ativações: 5

Colored indicator of the linear channel.
Plotting and calculation is based on the Keltner method. It is used for making trading decisions and analyzing market sentiment.
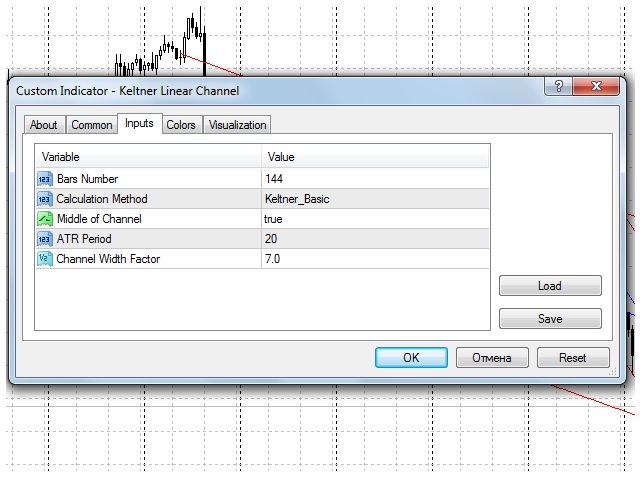
The input parameters provide the ability to adjust the channel on the chart.
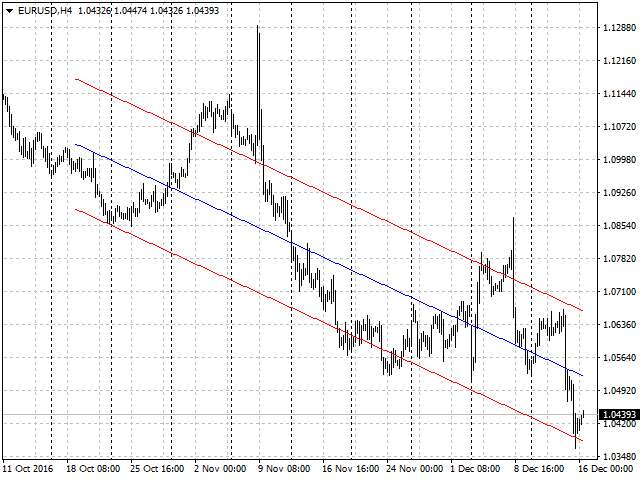
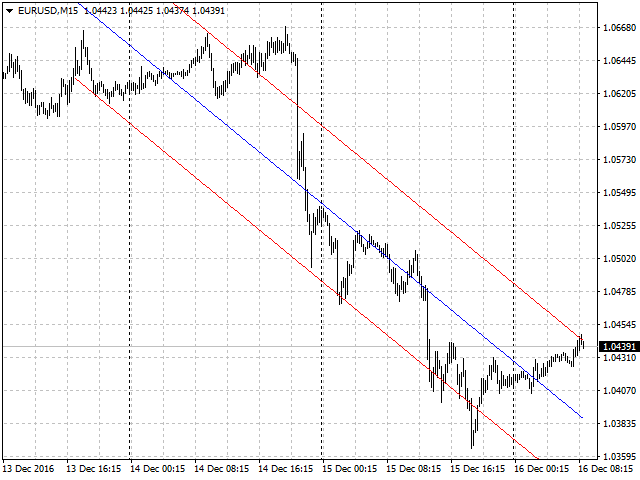
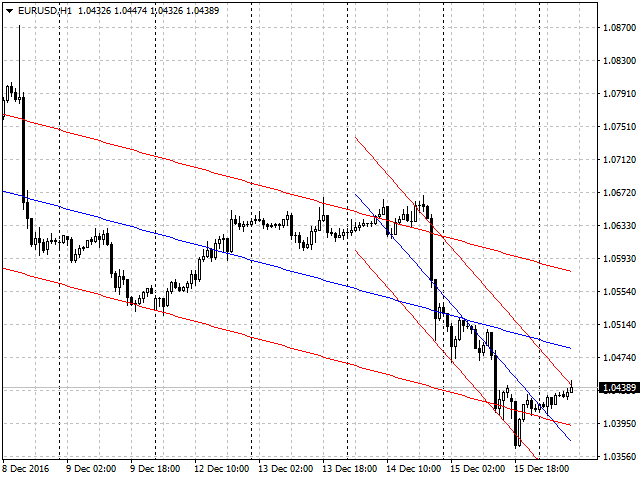
Attaching multiple instances of the indicator to the chart with different calculation periods leads to displaying a system of channels on the chart.
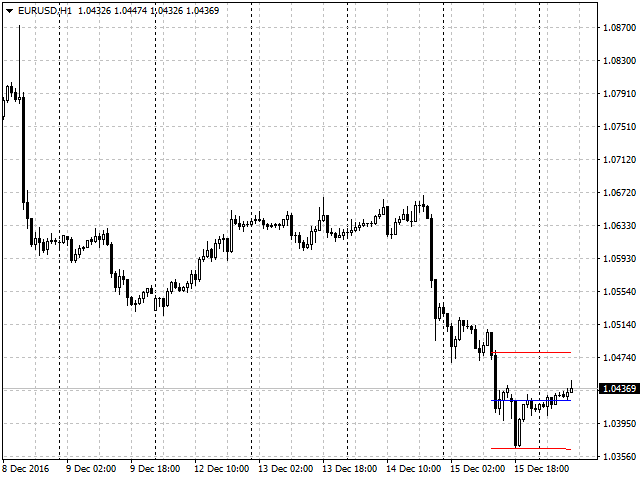
Various options for plotting the channel are shown in the screenshots.
Purpose
The indicator can be used for manual or automated trading within an Expert Advisor. Values of indicator buffer of the double type can be used for automated trading:
- Channel middle line - buffer 0.
- Upper channel boundary line - buffer 1.
- Lower channel boundary line - buffer 2.
Values of the buffers must not be equal to zero.
Input parameters
- Bars_Number - number of bars for the indicator calculation.
- Calculation Method - Method of calculating the channel:
- Keltner_Basic - basic (by Keltner)
- Kelner_Improved - improved (by Keltner).
- Custom - custom (by the following parameters).
- Middle of Channel - Display the channel middle on the chart:
- true - yes.
- false - no.
- ATR Period - calculation period for the ATR (Average True Range).
- Channel Width Factor