Candlestick Tools
- Indicadores
- Versão: 1.24
- Atualizado: 23 julho 2024
- Ativações: 15

Description
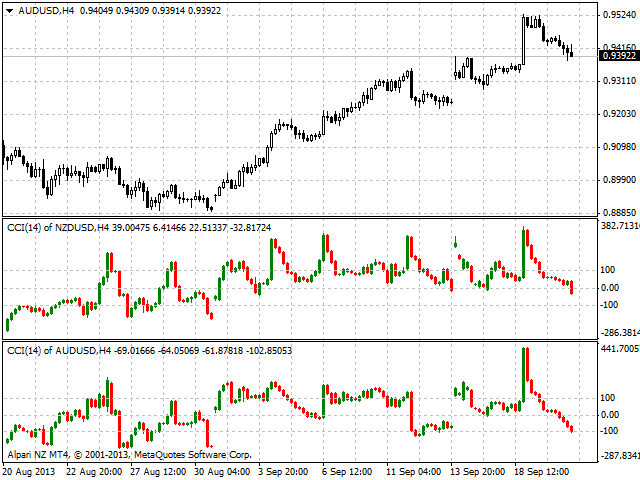
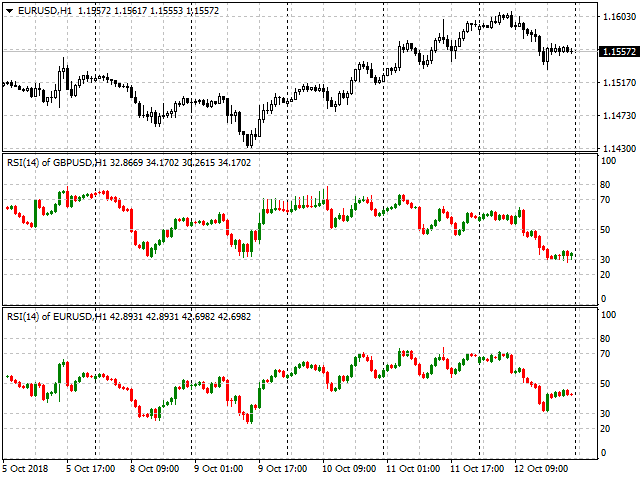
Candlestick Tools is a colored multicurrency/multy-symbol indicator. It shows one of four standard indicators as a candlestick chart in a separate window below the chart of the main financial symbol.
The indicator is calculated based on one of two indicators included in the standard package of the МetaТrader 4 terminal:
- CCI - Commodity Channel Index.
- RSI - Relative Strength Index.
The default indicator is Commodity Channel Index.
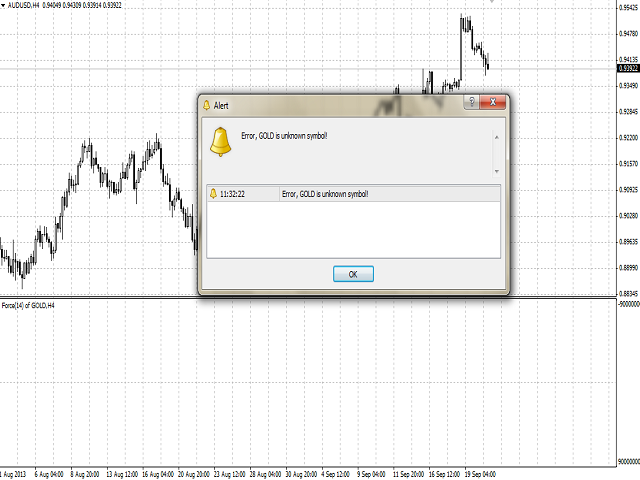
The indicator may be used with any broker, irrespective of the name of the financial instrument since it is necessary to manually enter the name as an input parameter. If you enter a non-existent or incorrect name of a financial instrument, you will receive an error message that this financial instrument is unknown (does not exist).
You can set the number of displayed candlesticks, as well as select bullish and bearish coloring.
Purpose
The indicator can be used as a visual tool that represents market data in a convenient informative way, which helps to analyze market events.
The indicator can be used for manual or automated trading in an Expert Advisor. Values of indicator buffer of the double type, that characterizes the candlestick configuration, can be used for automated trading:
- The indicator values based on Open prices - buffer 0.
- The indicator values based on High prices - buffer 1.
- The indicator values based on Low prices - buffer 2.
- The indicator values based on Close prices - buffer 3.
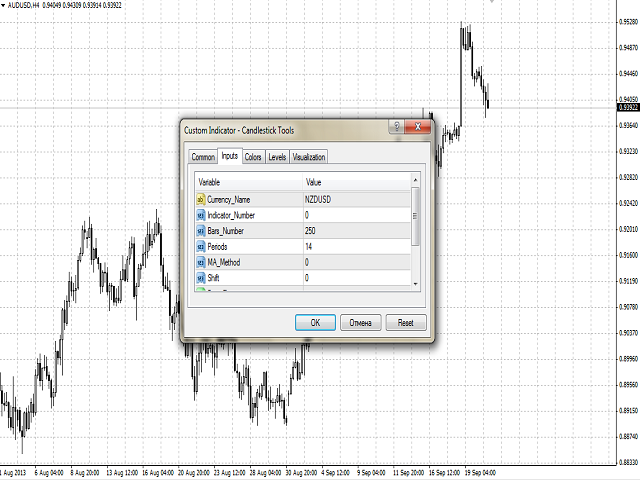
Inputs
- Currency_Name - the name of the financial instrument.
- Indicator_Number - the name of the indicator.
- Bars_Number - the number of bars to be displayed in a separate window.
- Periods - indicator calculation period.
- MA_Method - averaging method for the MA of the basic indicator.
- Shift - the sift of the basic and calculation indicator relative to the price chart.
- Bars_Flag - a flag to allow display of the number of bars specified in the Bars_Number parameter:
- true - according to Bars_Number.
- false - maximum available bars in the history.
- Bulls_Color - the color of the bullish candlestick.
- Bears_Color - the color of the bearish candlestick.
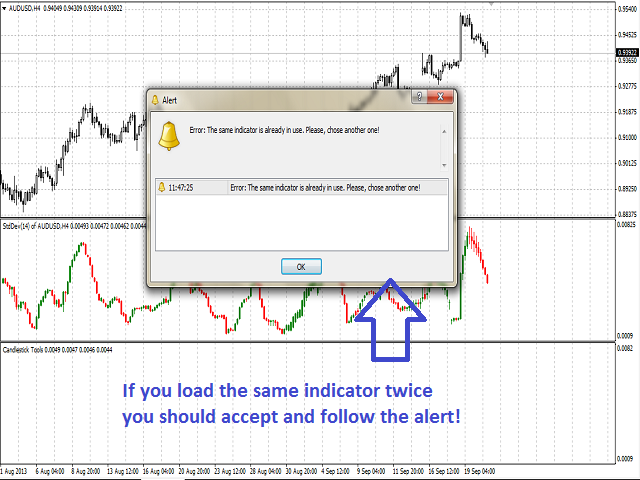
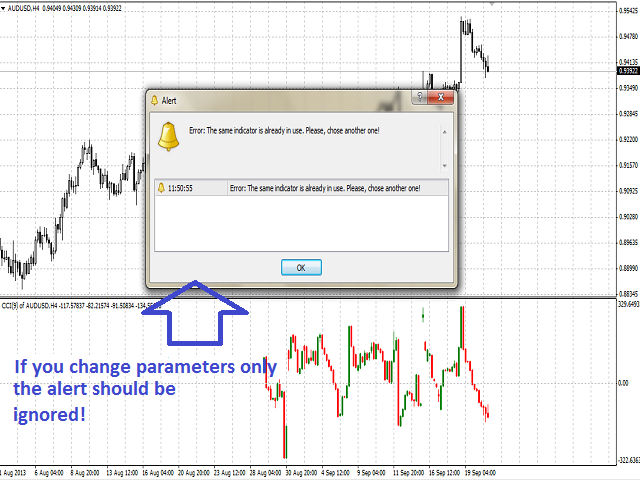
Limitations
A chart with the same parameters on the same financial symbol cannot be displayed more than once. Otherwise, you receive an error message related to its re-use and will be offered to select another financial instrument. However the message should be ignored when you only modify parameters of a drawn indicator for calculation (see screenshots).
Recommendations
It is recommended to use the indicator with the parameter Bars_Number not exceeding the number of bars that can be shown in one window (about 250 bars).
Notes
In case of loss of connection with the trading server, when connection is restored and data is downloaded, the chart will be redrawn from the beginning to the number of bars specified by Bars_Number and Bars_Flag.