TulipVolatilityScanner
- Indicadores
- Versão: 1.0

# Volatility Scanner v1.0 — Professional Multi-Symbol Volatility Analysis Panel
## Overview
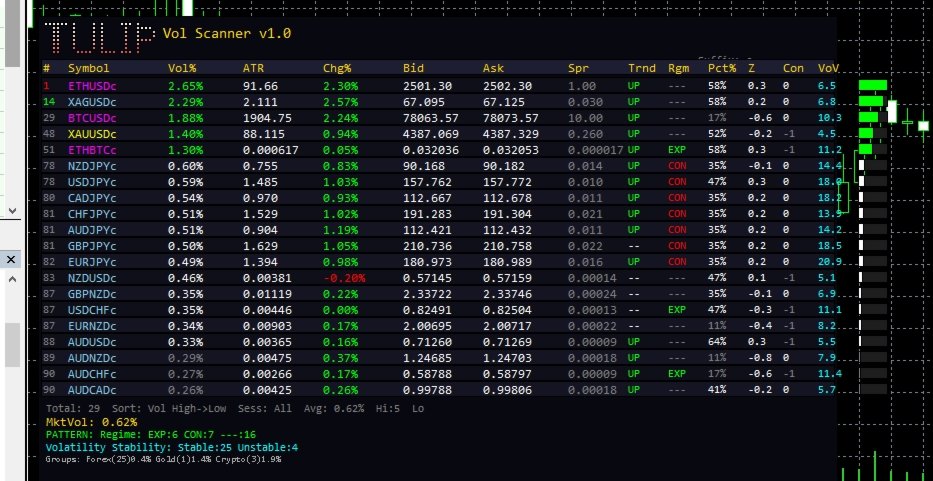
**Volatility Scanner** is an institutional-grade, real-time volatility analysis dashboard for MetaTrader 5. It monitors up to 30 symbols simultaneously, computing 30+ volatility metrics across multiple asset classes — Forex, Gold, Indices, Crypto, and Stocks — all from a single chart.
Built for traders who demand precision, speed, and depth. Whether you're a scalper watching for volatility spikes, a swing trader identifying regime shifts, or a risk manager monitoring portfolio-wide exposure — Volatility Scanner delivers the data you need, instantly.
---
## Key Features
### Real-Time Multi-Symbol Monitoring
- Track up to **30 symbols** simultaneously on one chart
- **Auto-detection** of broker suffixes (e.g., .c, .pro, .ecn)
- **5 asset classes**: Forex, Gold, Indices, Crypto, Stocks — each with distinct color coding
- Live Bid/Ask/Spread updates with configurable refresh interval
### 30+ Volatility Metrics
| Category | Metrics |
|----------|---------|
| **Core Volatility** | Close-to-Close, Parkinson, Garman-Klass, Yang-Zhang estimators |
| **Moving Averages** | EWMA (configurable lambda), Short/Long EWMA crossover |
| **Risk Metrics** | Value at Risk (VaR), Sharpe Proxy, Maximum Drawdown estimation |
| **Statistical** | Percentile ranking, Z-Score, NATR (Normalized ATR), Volatility of Volatility |
| **Pattern Detection** | Volatility Regime (Expansion/Contraction), Consecutive Days, Spike Detection |
| **Advanced** | Volatility Term Structure, GARCH Forecast, Tail Risk (Kurtosis), Breakout Composite Score |
| **Cross-Market** | Correlation analysis, Multi-Timeframe Composite, Clustering Strength |
| **Practical** | Adaptive Lookback, Optimal Leverage scoring, Mean Reversion Score |
### 6 Display Modes
| Mode | Description |
|------|-------------|
| **Full** | Complete dashboard with all metrics |
| **Compact** | Reduced columns for smaller screens |
| **Mini** | Essential metrics only (15 symbols max) |
| **Heatmap** | Color-coded volatility overview |
| **Risk** | Focus on risk metrics (VaR, Sharpe, MDD) |
| **Advanced** | Full metrics with v1.0 features (VoV, Momentum, Tail Risk) |
### 21 Sort Modes
Sort by any metric — Volatility, ATR, Change%, Spread, Percentile, Z-Score, NATR, VaR, Sharpe, Vol-of-Vol, Momentum, Mean Reversion, Tail Risk, Breakout Score, or Symbol Name (A-Z/Z-A).
### 13-Language Support
English, Chinese (中文), Russian (Русский), Spanish (Español), Portuguese (Português), German (Deutsch), French (Français), Japanese (日本語), Korean (한국어), Italian (Italiano), Turkish (Türkçe), Arabic (العربية), Persian (فارسی)
### TULIP Gradient Logo
Signature pixel-art logo with smooth pink-to-white gradient, inspired by the TulipTradingPanel design language.
### Smart Alerts
- **Volatility Spike** detection with configurable threshold
- **Clustering Alert** — warns when multiple symbols spike simultaneously
- **Regime Shift** notification — alerts on expansion/contraction transitions
- Sound, Push, or Both notification modes
### Session Filter
Filter symbols by trading session: All, London, New York, Tokyo, Sydney, London-NY Overlap, Asian
### Keyboard Shortcuts
| Key | Action |
|-----|--------|
| `T` | Toggle panel on/off |
| `S` | Cycle through sort modes |
| `R` | Cycle through display modes |
| `+` / `-` | Zoom in/out (60%–150%) |
### Group Statistics
Real-time summary of volatility by asset class — Forex, Gold, Indices, Crypto — with average volatility and symbol count per group. Market Volatility Index shows overall market conditions.
### Volatility Bar Chart
Visual horizontal bar for each symbol, color-coded: Green (high vol), White (normal), Gray (low vol).
---
## Technical Specifications
| Parameter | Default | Range |
|-----------|---------|-------|
| Max Symbols | 30 | 5–50 |
| History Bars | 20 | 10–100 |
| Refresh Interval | 3 sec | 1–60 sec |
| ATR Period | 14 | 5–50 |
| EWMA Lambda | 0.94 | 0.80–0.99 |
| VaR Confidence | 95% | 90–99% |
| Panel Scale | 100% | 60–150% |
---
## What's New in v1.0
- **Volatility of Volatility (VoV)** — Measures stability of volatility itself
- **Volatility Momentum** — Detects accelerating vs decelerating volatility
- **Mean Reversion Score** — Quantifies tendency to revert to mean
- **Tail Risk (Kurtosis)** — Identifies fat-tail distribution risk
- **Breakout Composite Score** — Multi-factor breakout probability
- **Maximum Drawdown Estimation** — Risk-based MDD projection
- **Adaptive Lookback** — Dynamically adjusts calculation window
- **MTF Composite** — Blends M15/H1/H4 volatility signals
- **Clustering Strength** — Measures cross-symbol spike correlation
- **Optimal Leverage** — Risk-adjusted position sizing guidance
---
## Installation
1. Copy `VolatilityScanner.ex5` to `MQL5\Indicators\`
2. Restart MetaTrader 5 (or refresh the indicators list)
3. Drag `VolatilityScanner` onto any chart
4. Configure settings in the Inputs tab
5. Panel appears automatically on the chart
---
## Minimum Requirements
- MetaTrader 5 build 3000+
- Windows 10/11
- Active market data feed
---
## Support
For questions, bug reports, or feature requests, please contact us via MQL5 private message.
---
*Copyright 2026, MetaTrader 5 Tool Suite*