TulipTradingPanel
- Indicadores
- Versão: 1.0

# Tulip Trading Panel v1.0
## Advanced Multi-Factor Technical Analysis Indicator for MetaTrader 5
---
### 🌷 Overview
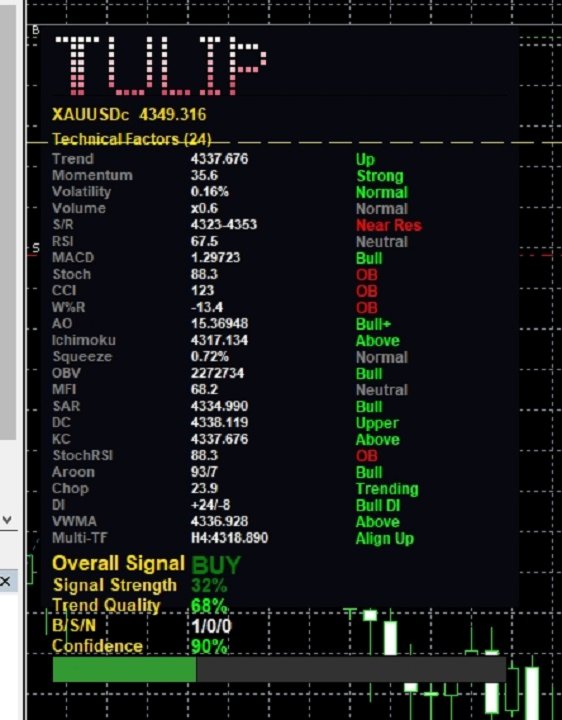
Tulip Trading Panel is a comprehensive technical analysis indicator that combines **24 professional-grade indicators** into a single, elegant dashboard. Powered by an advanced weighted scoring algorithm with category-based analysis, it provides clear buy/sell signals with confidence levels and trend quality metrics.
---
### 📊 Key Features
**24 Technical Indicators:**
- **Trend:** EMA, Ichimoku Cloud, Parabolic SAR, Donchian Channels, VWMA, Multi-Timeframe (H1+H4)
- **Momentum:** RSI, MACD, Stochastic, CCI, W%R, Awesome Oscillator, Stochastic RSI
- **Volatility:** ATR, Bollinger Bands Squeeze, Keltner Channels, Choppiness Index
- **Volume:** Volume Analysis, OBV (On Balance Volume), MFI (Money Flow Index)
- **Direction:** ADX +/-DI, Aroon Oscillator
**Advanced Scoring Algorithm:**
- Weighted scoring system with category-based analysis
- Confluence detection (bonus when indicators agree)
- Conflict penalty (when signals are split)
- Category alignment bonus (Trend + Momentum + Volume)
- Strong signal bonus
- Multi-timeframe confirmation
**Visual Dashboard:**
- Real-time signal strength bar with pulse animation
- Trend quality meter (0-100%)
- Confidence level indicator (0-100%)
- Buy/Sell/Neutral counter
- Gradient TULIP text logo
- Bilingual support (Chinese/English)
**Chart Markers:**
- Large BUY/SELL text arrows on signal change
- V/X signal circles
- Support/Resistance lines (optional)
- Trend line (auto-drawn)
- **Stop Loss line** (ATR-based, yellow dashed)
**Alert System:**
- Sound alerts
- Push notifications
- Email alerts
- Configurable alert thresholds
---
### 🎯 Signal Logic
The indicator calculates a composite score from all 24 factors:
| Score Range | Signal | Color |
|-------------|--------|-------|
| > 2.5 | STRONG BUY | Lime |
| 1.0 to 2.5 | BUY | Green |
| -1.0 to 1.0 | NEUTRAL | Yellow |
| -2.5 to -1.0 | SELL | Orange |
| < -2.5 | STRONG SELL | Red |
---
### ⚙️ Input Parameters
**General Settings:**
- Language selection (Chinese/English)
- Panel visibility toggle
- TULIP text logo toggle
- Signal arrows toggle
- Support/Resistance lines toggle
- Signal circles toggle
- Panel position (X, Y)
- Panel colors
**Analysis Periods:**
- MA Period (default: 20)
- RSI Period (default: 14)
- ATR Period (default: 14)
- Bollinger Bands Period & Width
- Stochastic K/D
- CCI Period
- Ichimoku Tenkan/Kijun/Senkou
- And more...
**Thresholds:**
- RSI Buy/Sell levels
- ADX Threshold
- CCI Buy/Sell levels
- MFI Buy/Sell levels
- Squeeze Threshold
**Chart Markers:**
- Arrow size
- Circle size
- S/R line width
**Stop Loss Line:**
- Show/Hide toggle
- ATR multiplier (default: 1.5)
- Line style
**Alerts:**
- Alert mode (Off/Sound/Push/Email/All)
- Signal change alerts toggle
---
### 📈 How to Use
1. **Attach to Chart:** Drag the indicator onto any chart
2. **Read the Dashboard:** All 24 factors are displayed in real-time
3. **Check Signal Strength:** The bar shows overall signal power
4. **Verify Trend Quality:** Higher % = more reliable signal
5. **Check Confidence:** Higher % = stronger agreement among indicators
6. **Follow Signals:** BUY when green, SELL when red
7. **Use Stop Loss:** The yellow dashed line shows recommended SL level
---
### 🔧 Best Practices
- **Timeframe:** Works on all timeframes, M15-H4 recommended
- **Pairs:** Optimized for Forex, also works on Gold, Indices, Crypto
- **Confirmation:** Use with price action for best results
- **Risk Management:** Always use the provided SL line as reference
- **Avoid:** Trading during low volatility (Chop > 61.8)
---
### 📋 Version History
**v6.0 (Current)**
- 24 technical indicators
- Advanced weighted scoring algorithm
- Category-based analysis
- Stop Loss line feature
- Trend quality meter
- Confidence level indicator
- Multi-timeframe confirmation (H1+H4)
**v5.0**
- 18 indicators
- Basic scoring algorithm
- Chart markers
**v4.0**
- 13 indicators
- Alert system
---
### 💡 Technical Details
- **Indicators Used:** 24 built-in MQL5 indicators
- **Calculation:** Real-time on every tick
- **Performance:** Optimized for minimal CPU usage
- **Memory:** Lightweight object-based dashboard
- **Compatibility:** MT5 Build 2000+
---
### 📞 Support
For questions, suggestions, or bug reports, please contact via MQL5 private message.
---
**Tulip Trading Panel** - Your complete technical analysis solution.