ALYAS TrendAngle
- Indicadores
-
Salim Alyas Rasho
 I develop practical technical indicators for MetaTrader 5 under the ALYAS brand, with a focus on clear visualization, simplicity, and ease of use.
My goal is to create reliable and useful trading tools that help traders analyze the market with greater clarity and efficiency. - Versão: 1.0
- Ativações: 5
ALYAS TrendAngle
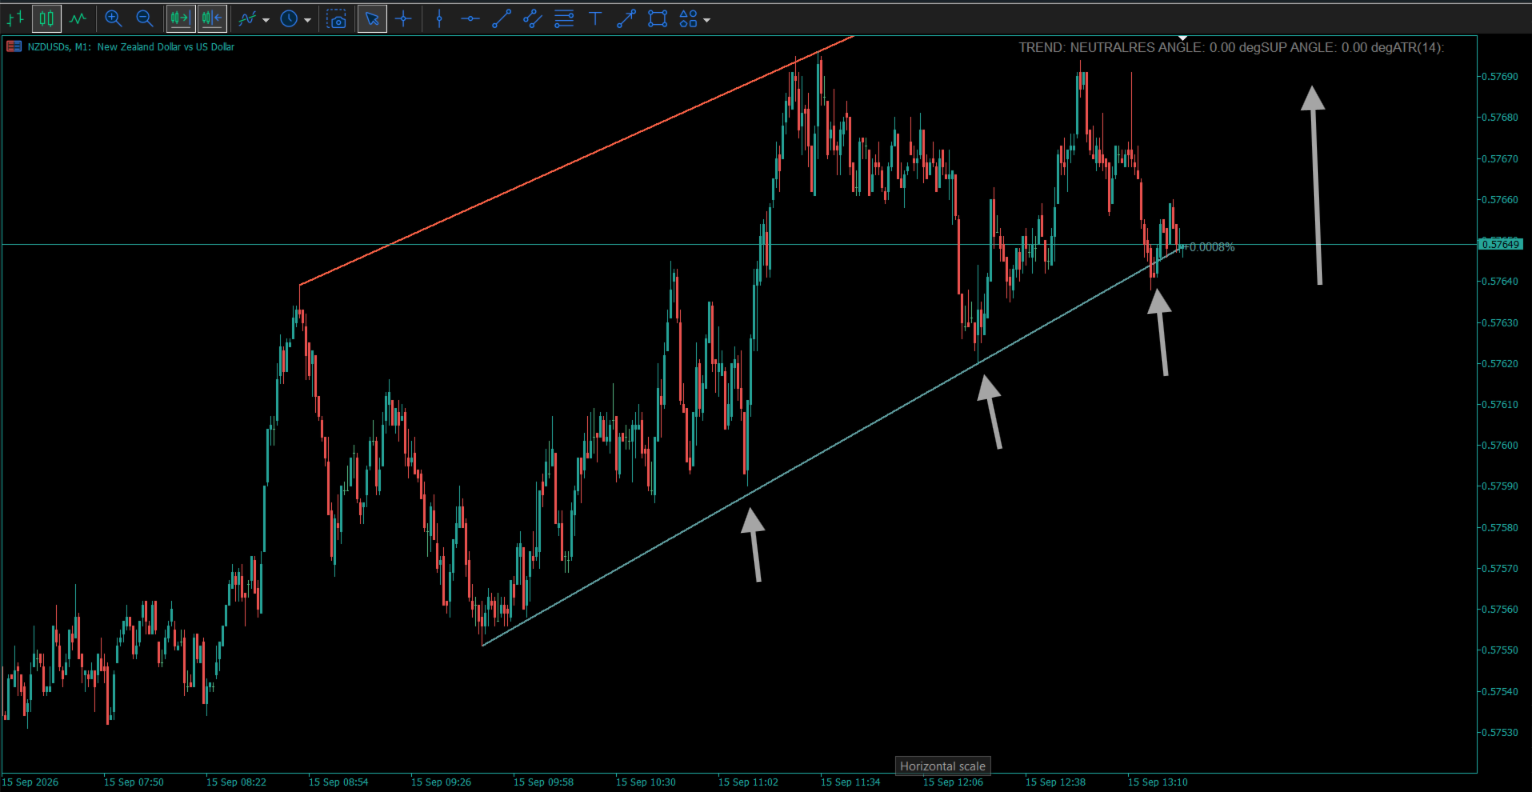
ALYAS TrendAngle is a professional MetaTrader 5 chart indicator designed to help traders analyze market structure, trend direction, and the strength and slope of dynamic support and resistance.
The indicator automatically identifies confirmed swing highs and swing lows, draws dynamic support and resistance trendlines, and calculates their normalized slope angles using ATR-based analysis.
Whether you are a beginner looking for a clearer view of the current market structure or an experienced trader performing detailed technical analysis, ALYAS TrendAngle provides a clean and practical way to visualize trend direction and trendline behavior directly on the chart.
Trend Analysis
ALYAS TrendAngle continuously evaluates the relationship between the current price and the dynamic support and resistance lines.
The dashboard displays three market states:
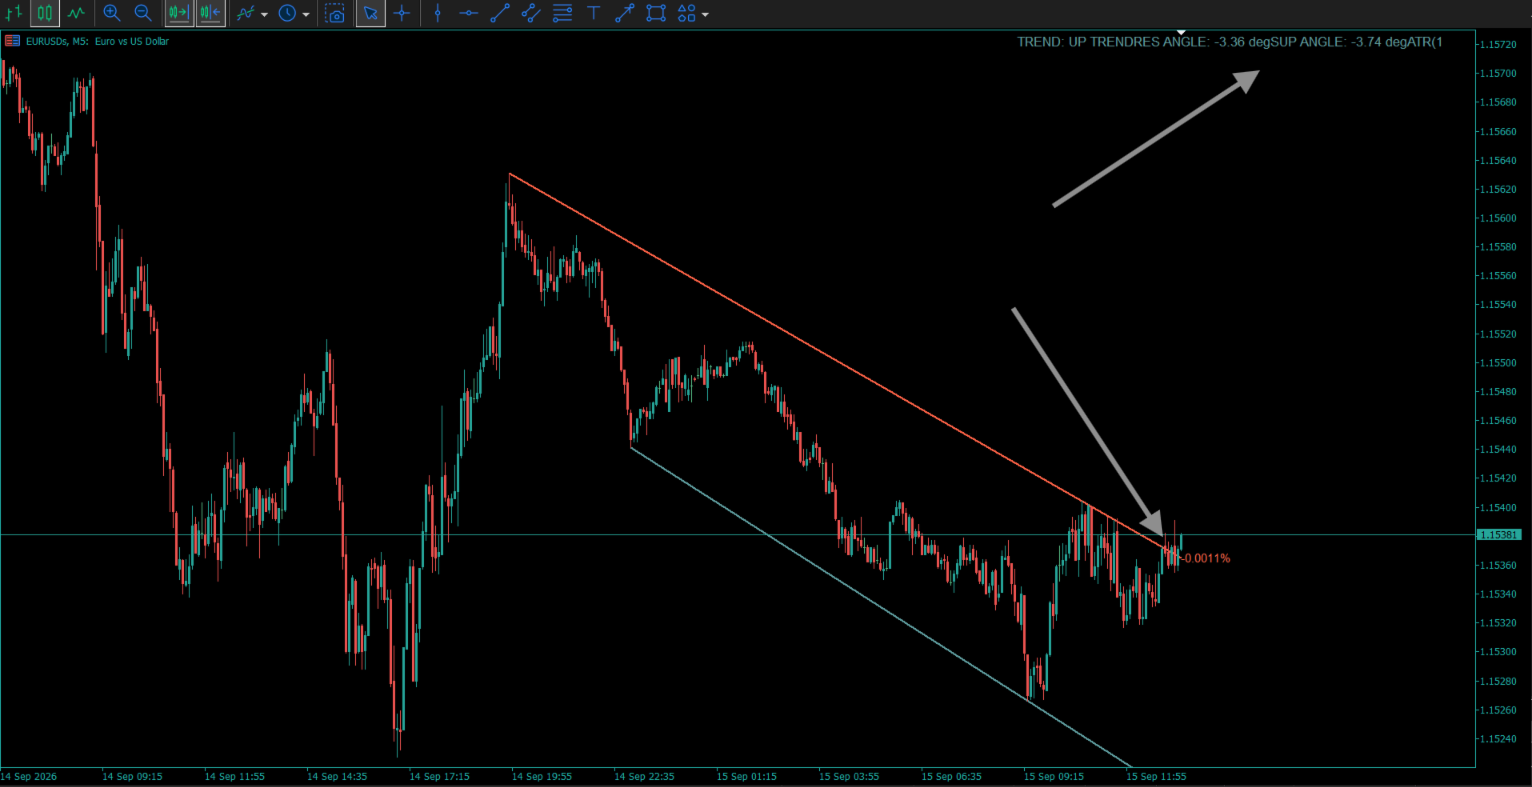
UP TREND
Price is above the calculated resistance line.
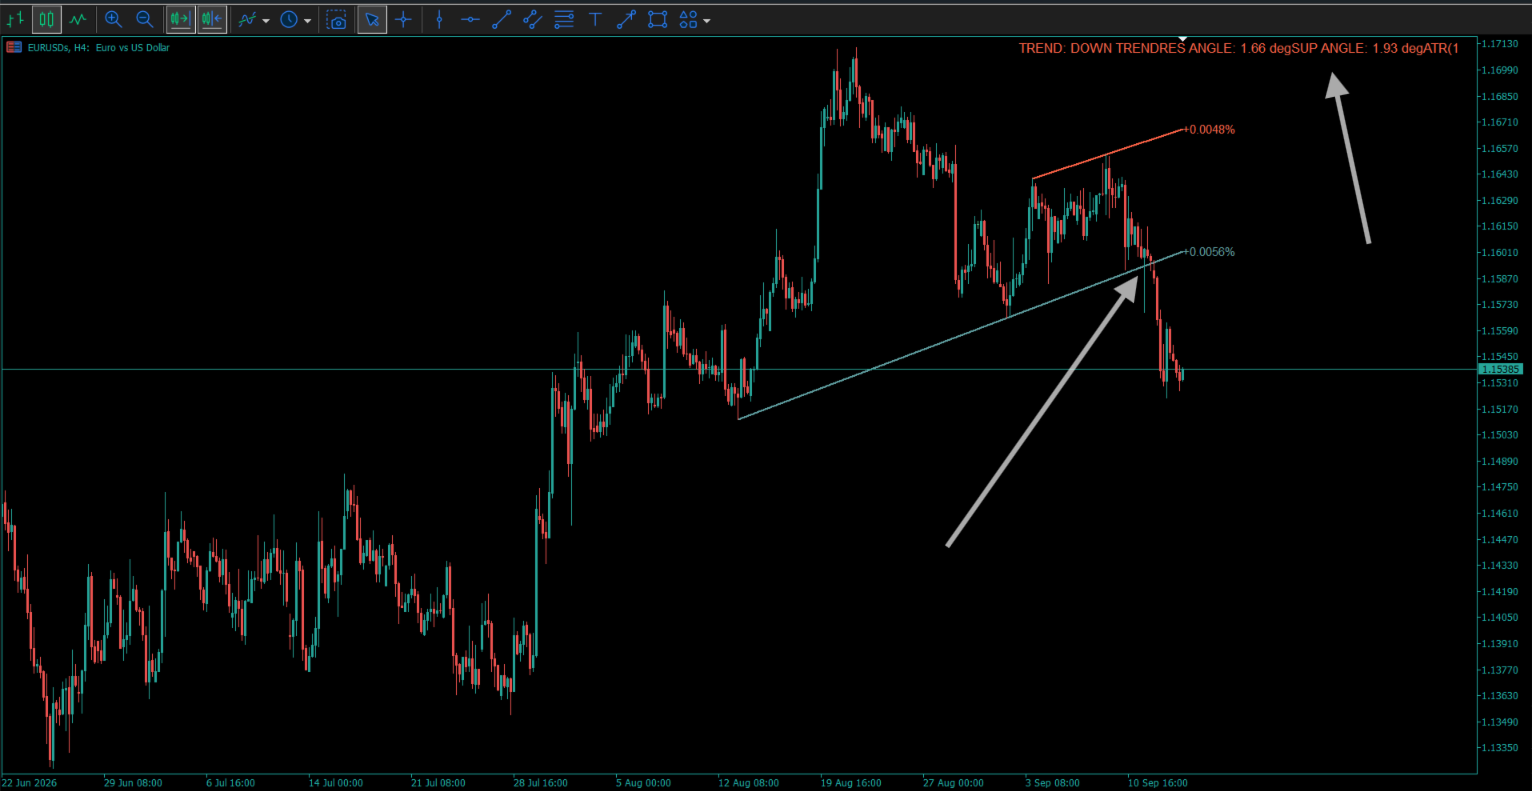
DOWN TREND
Price is below the calculated support line.
NEUTRAL
Price is between the support and resistance lines, or sufficient confirmed pivot points are not yet available.
This provides traders with a quick visual reference while still allowing the underlying support and resistance structure to be analyzed directly on the chart.
Dynamic Support & Resistance
The indicator automatically identifies confirmed pivot points and uses them to construct:
- Dynamic resistance trendline
- Dynamic support trendline
- Resistance slope percentage
- Support slope percentage
Support and resistance lines can be customized independently using different colors, widths, and line styles.
TrendAngle Analysis
One of the main features of ALYAS TrendAngle is its normalized trendline angle analysis.
The indicator calculates the slope of the support and resistance lines relative to the current ATR, helping traders evaluate the direction and steepness of the trendline in a more consistent way across different market conditions.
The dashboard displays:
- Resistance Angle
- Support Angle
- Current ATR
- Pivot Strength
- Current Trend State
Confirmed Pivot Analysis
Pivot points are confirmed only after the configured number of bars on both sides of the candidate point have been evaluated.
This confirmation process helps the indicator work with established swing points rather than relying on unconfirmed market movements.
The Pivot Strength parameter allows traders to control how strict the pivot confirmation should be.
Higher values generally require stronger swing points, while lower values allow more frequent pivot detection.
Professional Dashboard
The optional dashboard provides a compact overview of the current TrendAngle analysis directly on the chart.
It displays the current:
- Trend State
- Resistance Angle
- Support Angle
- ATR
- Pivot Strength
The dashboard can be enabled or disabled and positioned in any supported chart corner using customizable X/Y coordinates and font size.
Customization
ALYAS TrendAngle provides flexible settings for different trading styles and chart layouts.
Available customization includes:
- Pivot Strength
- ATR Period
- Resistance color
- Resistance width
- Resistance style
- Support color
- Support width
- Support style
- Dashboard visibility
- Dashboard position
- Dashboard font size
- Debug messages
Key Features
- Confirmed Pivot High detection
- Confirmed Pivot Low detection
- Dynamic resistance trendline
- Dynamic support trendline
- Resistance slope percentage
- Support slope percentage
- ATR-based normalized resistance angle
- ATR-based normalized support angle
- Current trend classification
- UP TREND state
- DOWN TREND state
- NEUTRAL state
- Optional integrated dashboard
- Current ATR display
- Configurable Pivot Strength
- Configurable ATR Period
- Independent support and resistance styling
- Adjustable dashboard position
- Adjustable dashboard font size
- Real-time chart updates
- Clean chart-based analysis
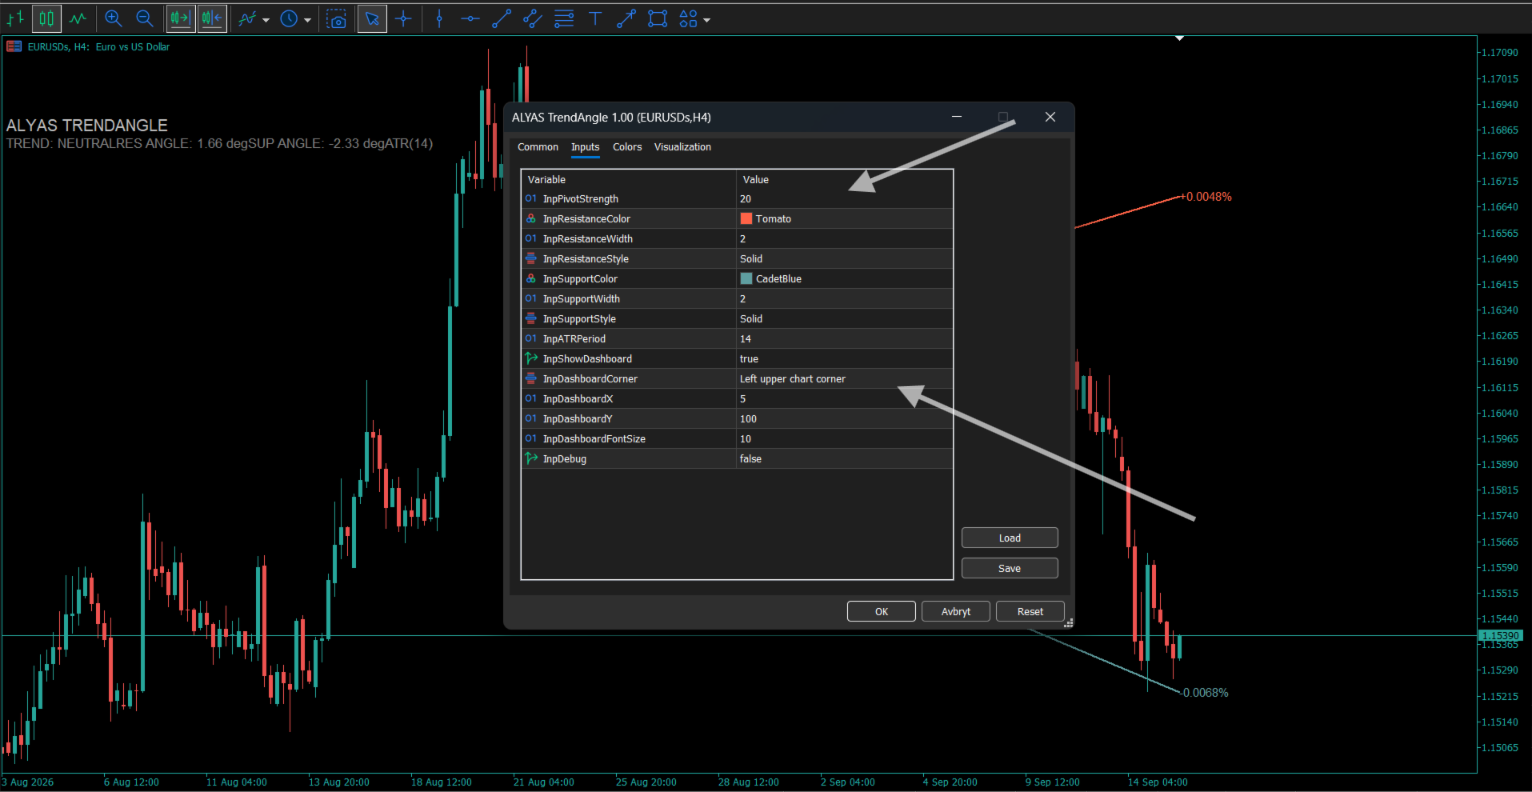
Inputs / Settings
Pivot Settings
InpPivotStrength = 20
Defines the number of bars used on each side when confirming pivot highs and pivot lows.
Resistance Settings
InpResistanceColor = Tomato
Sets the resistance line and resistance slope label color.
InpResistanceWidth = 2
Sets the resistance line width.
InpResistanceStyle = Solid
Sets the resistance line style.
Support Settings
InpSupportColor = CadetBlue
Sets the support line and support slope label color.
InpSupportWidth = 2
Sets the support line width.
InpSupportStyle = Solid
Sets the support line style.
ATR Settings
InpATRPeriod = 14
Defines the ATR period used for normalized TrendAngle calculations.
Dashboard Settings
InpShowDashboard = true
Shows or hides the TrendAngle dashboard.
InpDashboardCorner = Left Upper
Selects the chart corner used for the dashboard.
InpDashboardX = 5
Sets the horizontal dashboard position.
InpDashboardY = 100
Sets the vertical dashboard position.
InpDashboardFontSize = 10
Sets the dashboard font size.
Debug
InpDebug = false
Enables additional diagnostic messages in the MetaTrader log.
Important Information
ALYAS TrendAngle is a technical analysis indicator designed to assist traders in evaluating market structure, trend direction, support, resistance, and trendline slope.
It does not execute trades, place orders, or manage positions automatically.
Support & Feedback
Thank you for using this indicator.
If you find it useful in your market analysis, your feedback is greatly appreciated. A review helps other traders discover the product and provides valuable feedback for future improvements and updates.
For questions, suggestions, or technical support, please feel free to contact me through the MQL5 platform.
Thank you for your support.