ALYAS Linear Regression Channel
- Indicadores
-
Salim Alyas Rasho
 I develop practical technical indicators for MetaTrader 5 under the ALYAS brand, with a focus on clear visualization, simplicity, and ease of use.
My goal is to create reliable and useful trading tools that help traders analyze the market with greater clarity and efficiency. - Versão: 1.0
- Ativações: 5
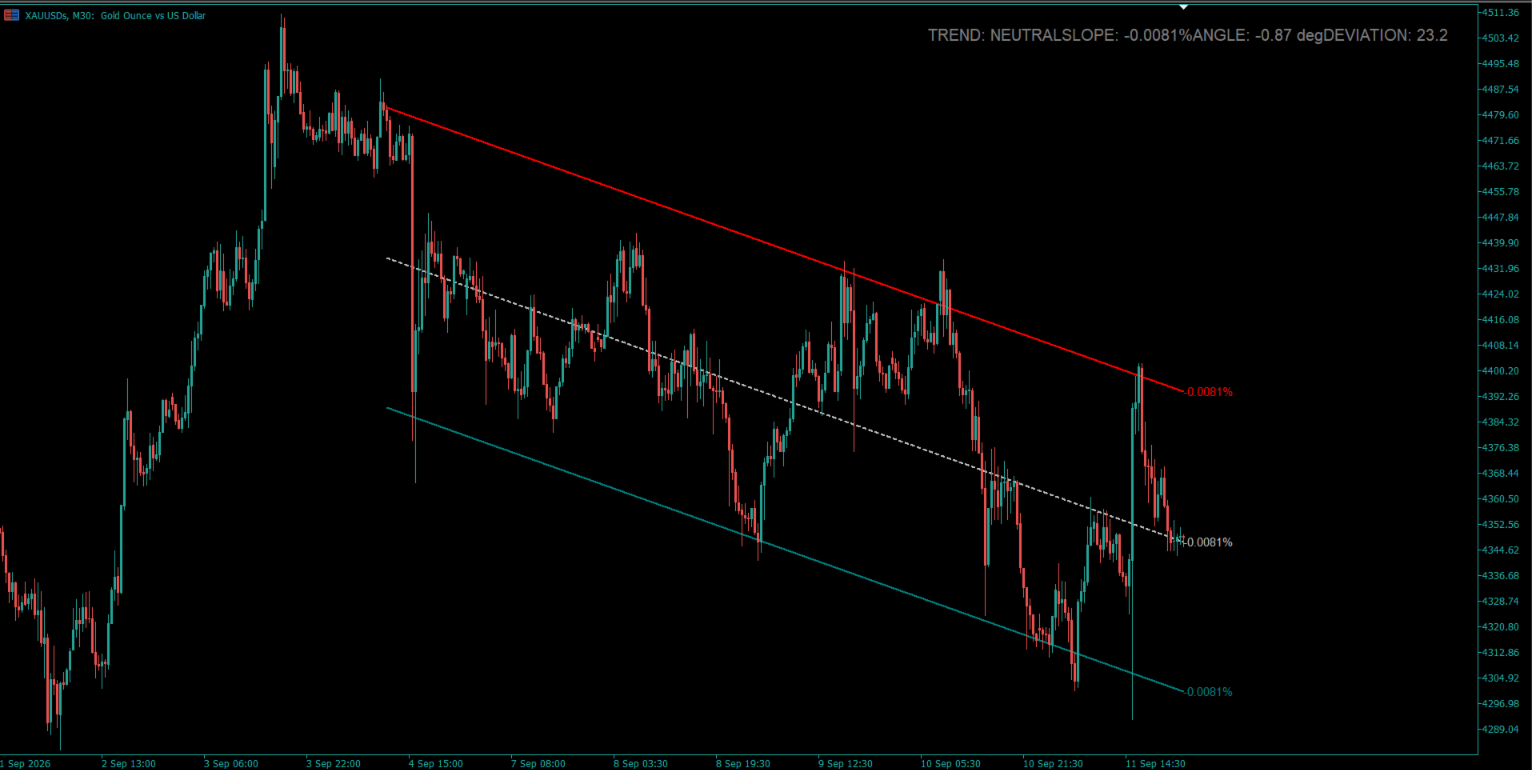
ALYAS Linear Regression Channel is a professional MetaTrader 5 analytical indicator designed to visualize price structure through a dynamic linear regression channel.
The indicator calculates a linear regression based on the closing prices of the selected number of bars and displays a three-line channel consisting of:
- Upper Regression Channel
- Middle Regression Line
- Lower Regression Channel
The channel width is dynamically calculated from the regression deviation and the selected Deviation Multiplier, allowing the channel to adapt to price variation within the selected regression period.
Channel Calculation
The linear regression is calculated using the closing prices of the current chart over the selected Regression Period.
The Middle Line represents the calculated linear regression.
The Upper and Lower channel lines are positioned around the regression line according to the calculated regression deviation multiplied by the selected Deviation Multiplier.
This provides a structured visual representation of the current price distribution around the regression line.
Trend Analysis
The integrated dashboard evaluates the current channel direction using two conditions:
- Regression slope direction
- Current price position relative to the regression middle line
The indicator displays one of three market states:
- UP TREND
- DOWN TREND
- NEUTRAL
UP TREND is displayed when the regression slope is positive and the current price is above the regression middle line.
DOWN TREND is displayed when the regression slope is negative and the current price is below the regression middle line.
When these conditions are not met, the dashboard displays NEUTRAL.
Slope & Normalized Angle
The indicator provides additional quantitative information about the regression structure.
Slope Percentage measures the regression slope relative to the regression end price.
Normalized Angle provides a normalized representation of the regression slope relative to the calculated channel deviation.
Both values can be displayed through the dashboard and optional slope labels, providing additional context for evaluating the direction and structure of the regression channel.
Professional Dashboard
The optional analytical dashboard provides a compact overview of the current regression structure, including:
- Current Channel Trend
- Slope Percentage
- Normalized Angle
- Regression Deviation
- Regression Period
- Deviation Multiplier
The dashboard position, corner, and font size can be customized directly from the indicator settings.
Slope Labels
Optional slope percentage labels can be displayed at the end of the upper, middle, and lower regression lines.
Each label uses the corresponding line color for clear visual identification.
Users can enable or disable the labels and adjust their font size according to their chart layout.
Visual Customization
Each regression channel line can be customized independently.
Available options include:
- Line Color
- Line Width
- Line Style
This allows the channel appearance to be adapted to different chart themes and trading environments.
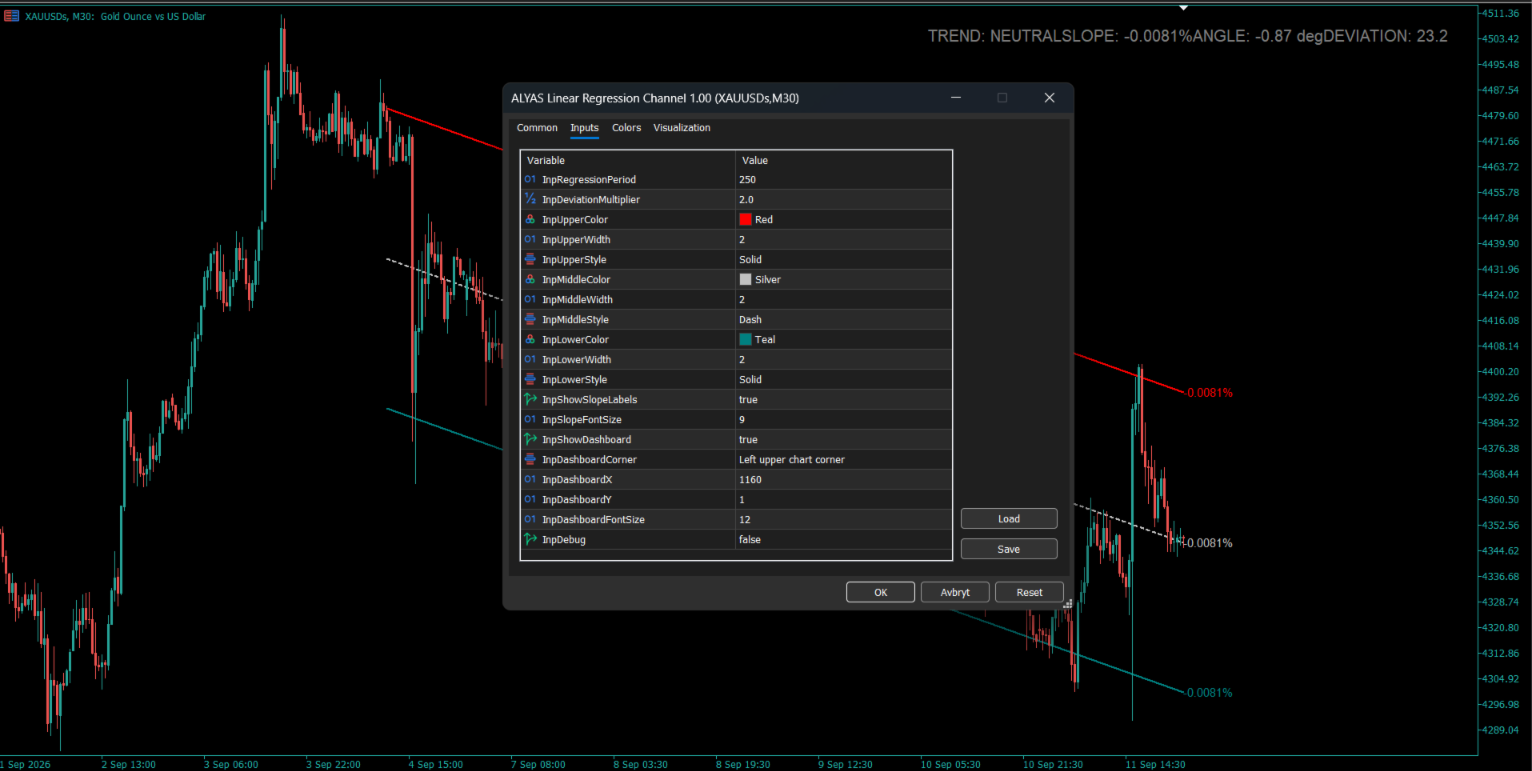
Inputs
Regression Settings
Regression Period
Defines the number of bars used for the linear regression calculation.
Deviation Multiplier
Defines the multiplier applied to the calculated regression deviation to determine the channel width.
Upper Line
Upper Line Color
Sets the color of the upper regression channel line.
Upper Line Width
Sets the width of the upper regression channel line.
Upper Line Style
Sets the style of the upper regression channel line.
Middle Line
Middle Line Color
Sets the color of the middle regression line.
Middle Line Width
Sets the width of the middle regression line.
Middle Line Style
Sets the style of the middle regression line.
Lower Line
Lower Line Color
Sets the color of the lower regression channel line.
Lower Line Width
Sets the width of the lower regression channel line.
Lower Line Style
Sets the style of the lower regression channel line.
Slope Labels
Show Slope Labels
Enables or disables the slope percentage labels displayed at the end of the channel lines.
Slope Font Size
Sets the font size of the slope labels.
Dashboard
Show Dashboard
Enables or disables the analytical dashboard.
Dashboard Corner
Selects the chart corner used as the dashboard reference position.
Dashboard X
Sets the horizontal position offset of the dashboard.
Dashboard Y
Sets the vertical position offset of the dashboard.
Dashboard Font Size
Sets the font size of the dashboard text.
Debug
Debug
Enables or disables debug output used for development and troubleshooting.
Usage
Attach ALYAS Linear Regression Channel to a MetaTrader 5 chart.
Select the desired Regression Period and Deviation Multiplier. The indicator automatically calculates the regression channel using the closing prices of the current chart and displays the channel together with the selected analytical information.
The indicator automatically follows the symbol and timeframe of the chart to which it is attached.
Important Information
ALYAS Linear Regression Channel is a chart-based analytical tool designed to help traders visually evaluate price structure, regression direction, channel deviation, and market conditions.
It does not execute trades, generate orders, or guarantee trading results.
Support & Feedback
Thank you for using this indicator.
If you find it useful in your market analysis, your feedback is greatly appreciated. A review helps other traders discover the product and provides valuable feedback for future improvements and updates.
For questions, suggestions, or technical support, please feel free to contact me through the MQL5 platform.
Thank you for your support.