Vitals
- Utilitários
- Allan Aparece Ninal
- Versão: 1.0
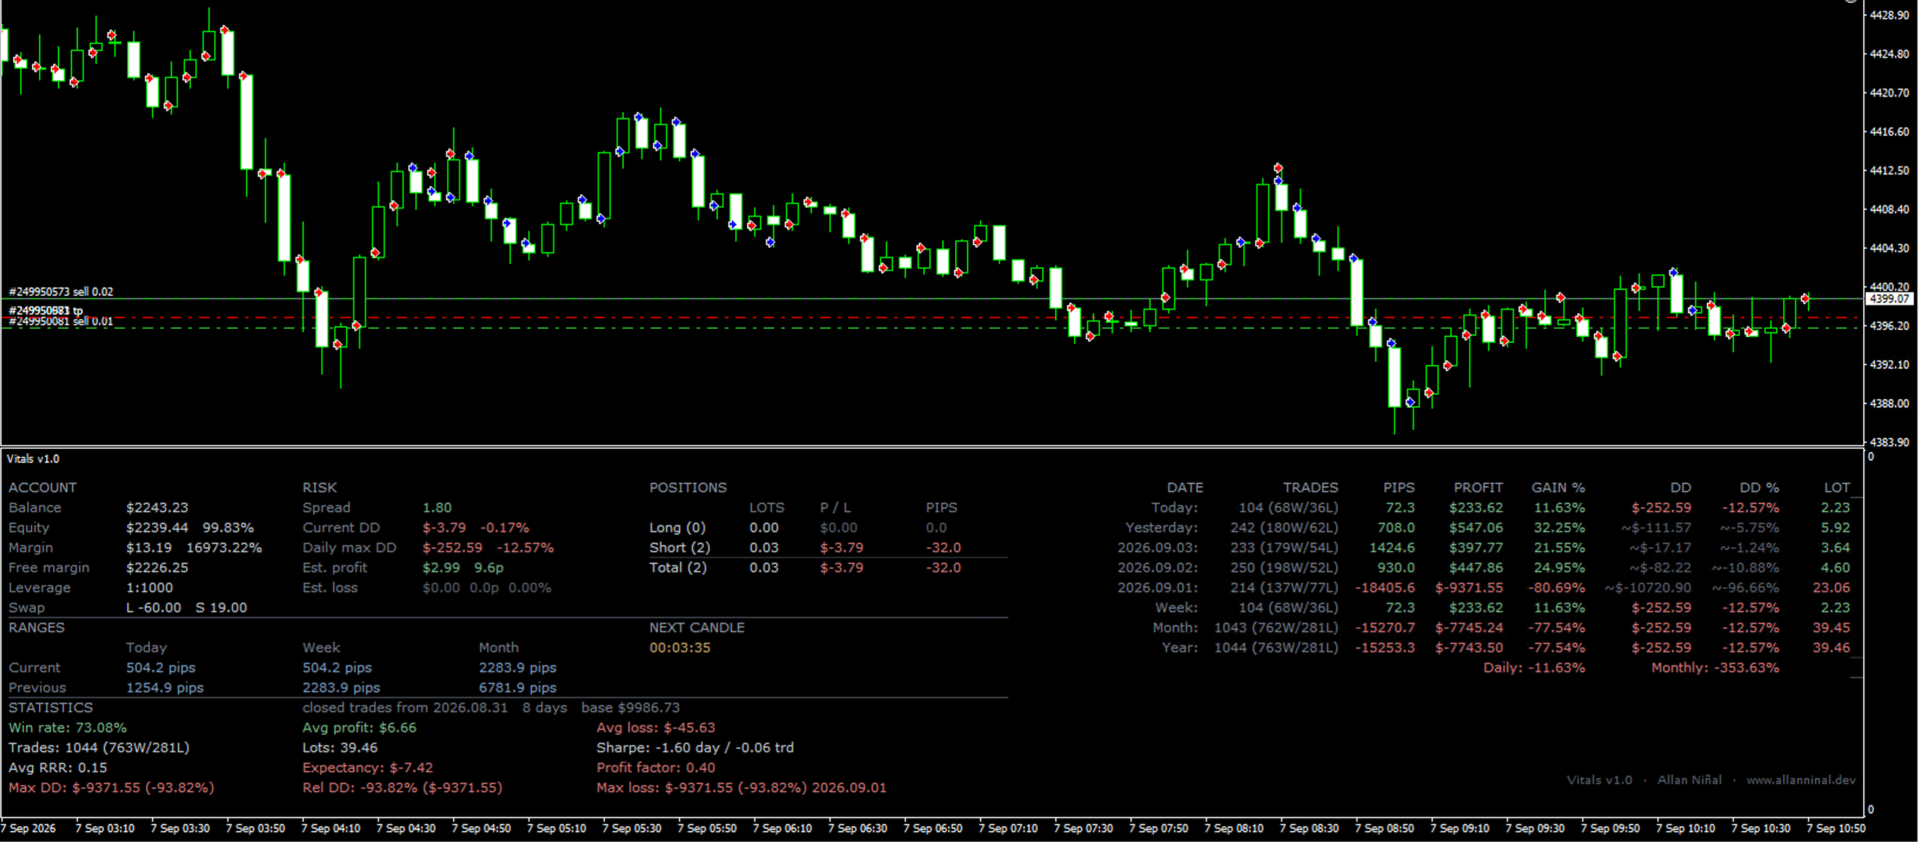
Vitals shows the state of your trading account on a single screen: balance and margin, current risk, open positions, market ranges, results by period, and a statistics panel, arranged on one grid so the figures can be read at a glance rather than gathered from several terminal windows.
Vitals is a display panel. It does not place, modify or close orders.
Floating drawdown
A history report records what a position earned. It does not record how far the account moved below its balance while that position was open, and that is the figure a daily loss limit measures at a proprietary trading firm.
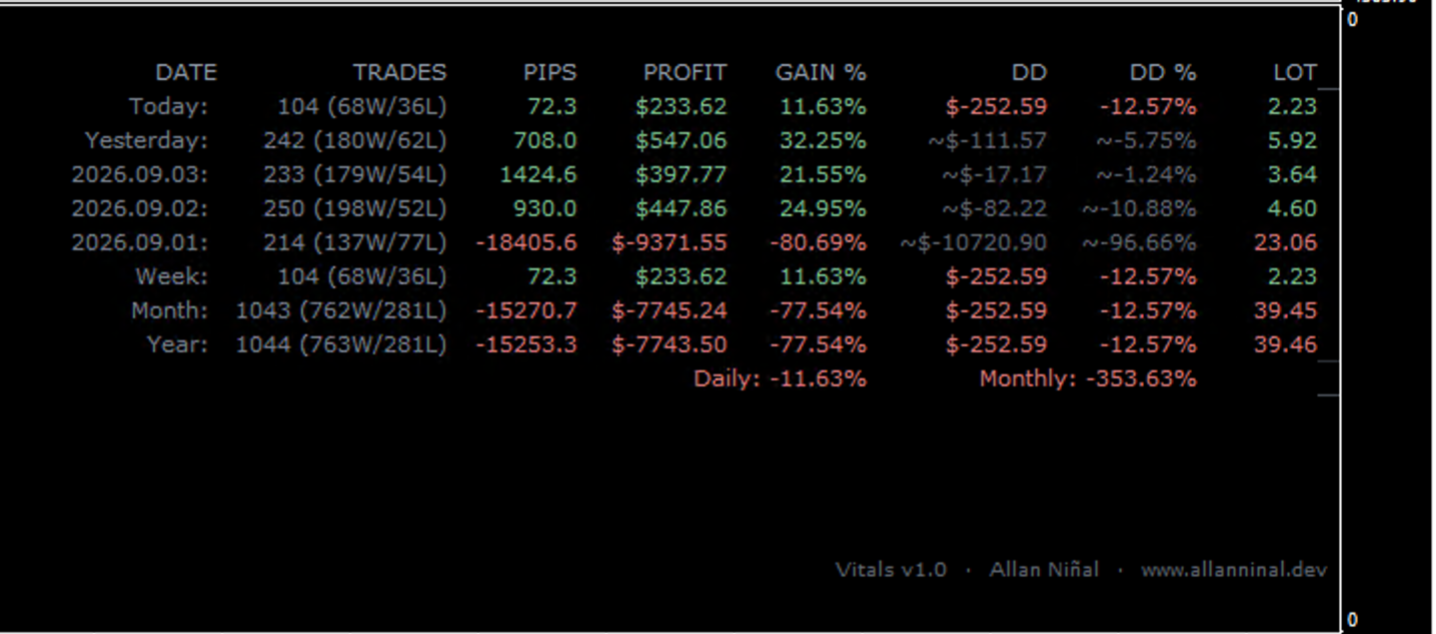
Vitals records it as it happens. The DD and DD % columns show the largest floating drawdown reached on each day: the lowest point equity fell below balance. Each value is written to a journal on disk as the day develops and is read back when the terminal restarts. The week, month and year rows show the deepest single day within that period, which is the figure a daily loss limit is compared against, rather than a total or an equity curve measurement.
Please note: MetaTrader does not store past floating equity, so this journal can only begin on the day the indicator is first attached. For earlier days the columns fall back to the drawdown of the closed trade curve, shown with a tilde and in a dimmed colour so the two measurements are not confused. Days with neither show a dash. No figure is estimated.
What the panel shows
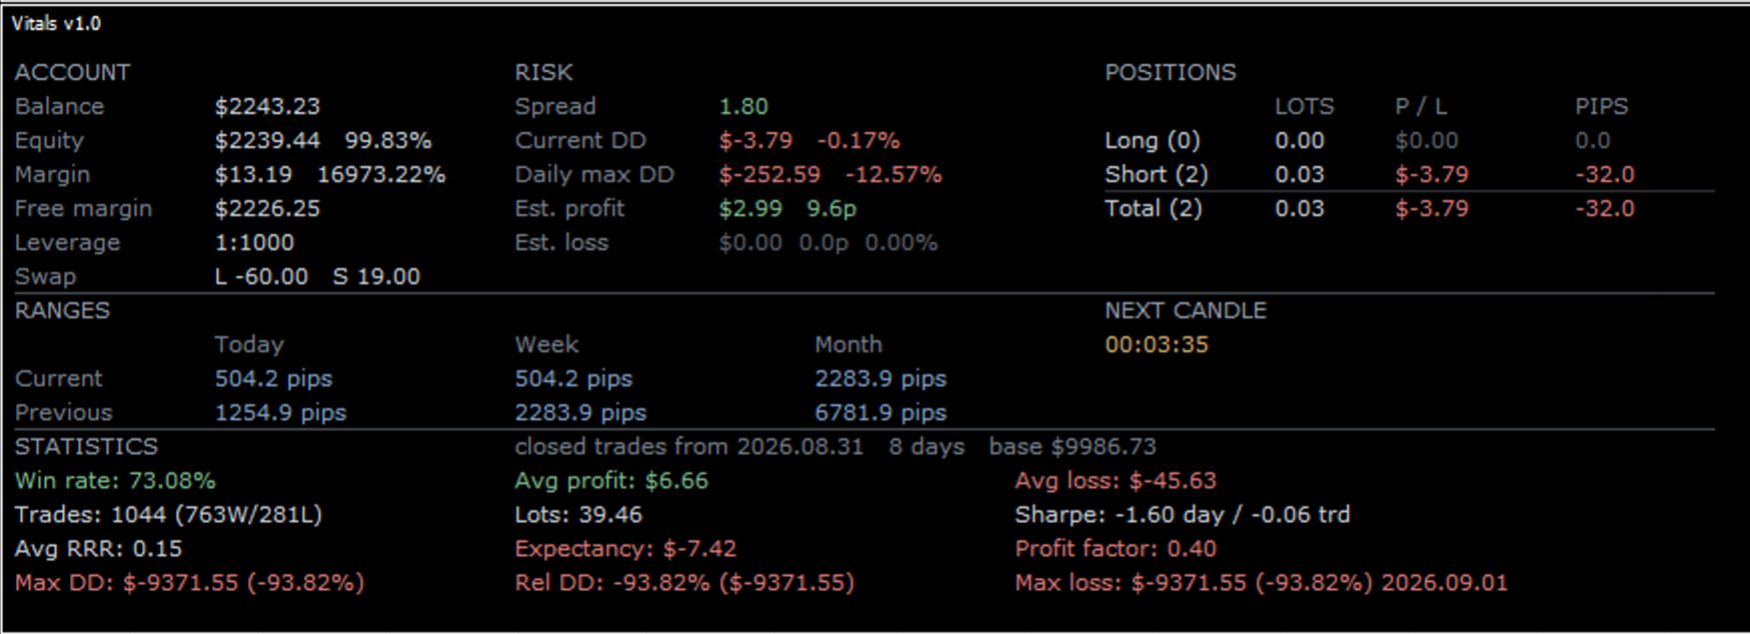
- Account — balance, equity and equity as a percentage of balance, margin and margin level, free margin, leverage, and swap for long and short positions
- Risk — spread, current floating drawdown, the largest floating drawdown so far today, and the value of the open stop losses and take profits in money, pips and percent
- Positions — long, short and total, each shown by lots, profit and loss, and pips
- Ranges — today, this week and this month against the preceding period, with a countdown to the next candle
- History — today, yesterday, the three preceding trading days, week, month and year, each with the number of trades and the split of winners and losers, pips, profit, gain in percent, drawdown and lots, followed by the average daily and monthly gain
- Statistics — win rate, average profit and average loss, number of trades and total lots, two Sharpe ratios, average risk to reward ratio, expectancy, profit factor, maximum and relative drawdown, and the worst single day with its date
Compact layout for small subwindows
With PanelDensity set to Auto, Vitals measures the height of its subwindow and selects a layout to match: the full panel where there is room, and a compact one where there is not. The compact layout retains the figures used while a position is open, which are equity, both drawdown values, position totals, and the today, yesterday, week, month and year rows. It omits the reference figures. The change is automatic, and a margin is applied so the layout does not alternate when the subwindow border rests near the boundary. The Full and Compact settings select one layout directly.
Colours
The colours are muted by design. The standard terminal colours are bright on a dark chart and can be tiring to read over a long session. Vitals keeps the same hues, so a gain and a loss are still distinguished immediately, at about half the intensity. Four levels of contrast separate headings, labels, values and inactive figures. The WhiteMode setting selects a separate palette prepared for white chart backgrounds.
Filters
Every figure on the panel can be restricted to a chosen set of orders: by the symbol of the chart, by magic number, by order comment, or from a starting date onwards. This allows one strategy to be measured on an account that runs several.
Inputs
- ShowAccountOrderInfo (true) — show the Account, Risk and Positions sections
- ShowProfitInfo (true) — show the history table
- ShowTodayRanges (true) — show the Ranges section and the countdown to the next candle
- ShowStatsPanel (true) — show the Statistics section
- ShowRiskInfo (false) — show the position size for each level of risk
- RiskStopLoss (0) — stop loss distance in pips used to calculate those position sizes
- RiskLevels ("1,5,10,20,40,50,60,80,100") — the risk levels, as percentages of balance, separated by commas
- PanelDensity (Auto) — Auto fits the layout to the height of the subwindow; Full and Compact select one directly
- TopMargin (26) — distance from the top of the subwindow, so the heading clears the name the terminal draws there
- FontSize (8) — sets the text size and the spacing of the whole layout
- WhiteMode (false) — palette for white chart backgrounds
- OnlyAttachedSymbol (false) — include only orders on the symbol of the chart
- MagicNumber (-1) — include only orders with this magic number; -1 includes all orders
- CommentFilter ("") — include only orders whose comment matches this text
- StartDateFilter ("") — ignore all history before this date
- RiskFreeRate (0.0) — annual risk free rate used in the Sharpe ratios
Notes
- Vitals reads account data only. It does not place, modify or close orders, and it does not require permission to trade.
- The statistics are calculated from the history the terminal has loaded. Set the account history to show all history for complete figures.
- The drawdown journal is stored for each account number in the Files folder of the terminal, and remains available after a restart.
- Attach the indicator to any chart. The panel opens in its own subwindow.