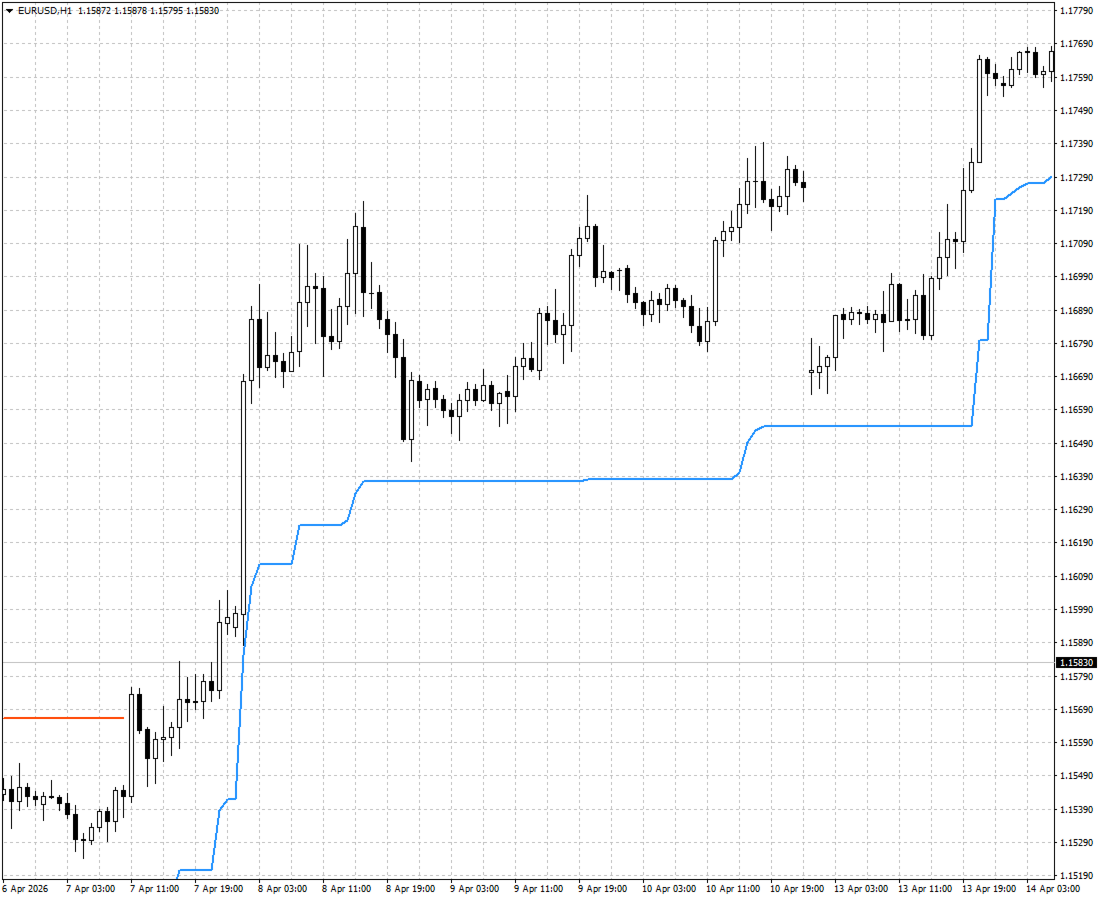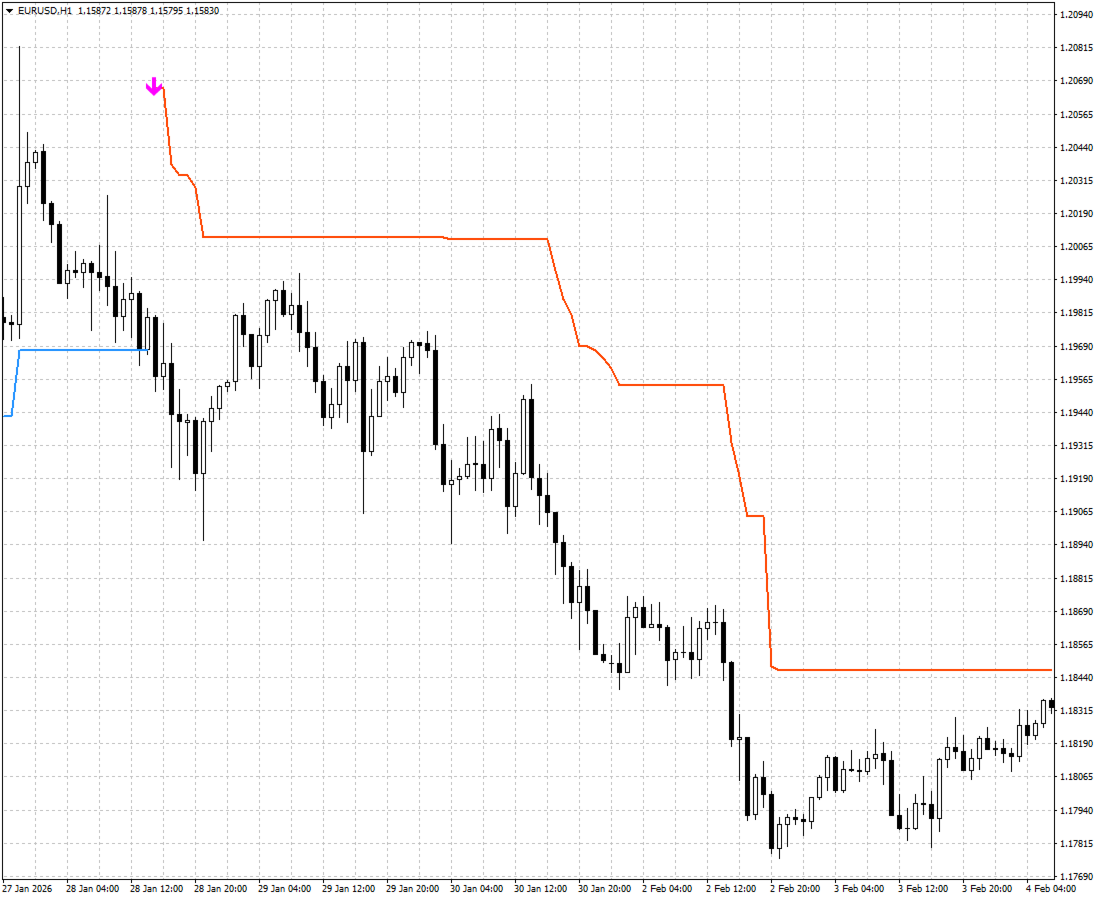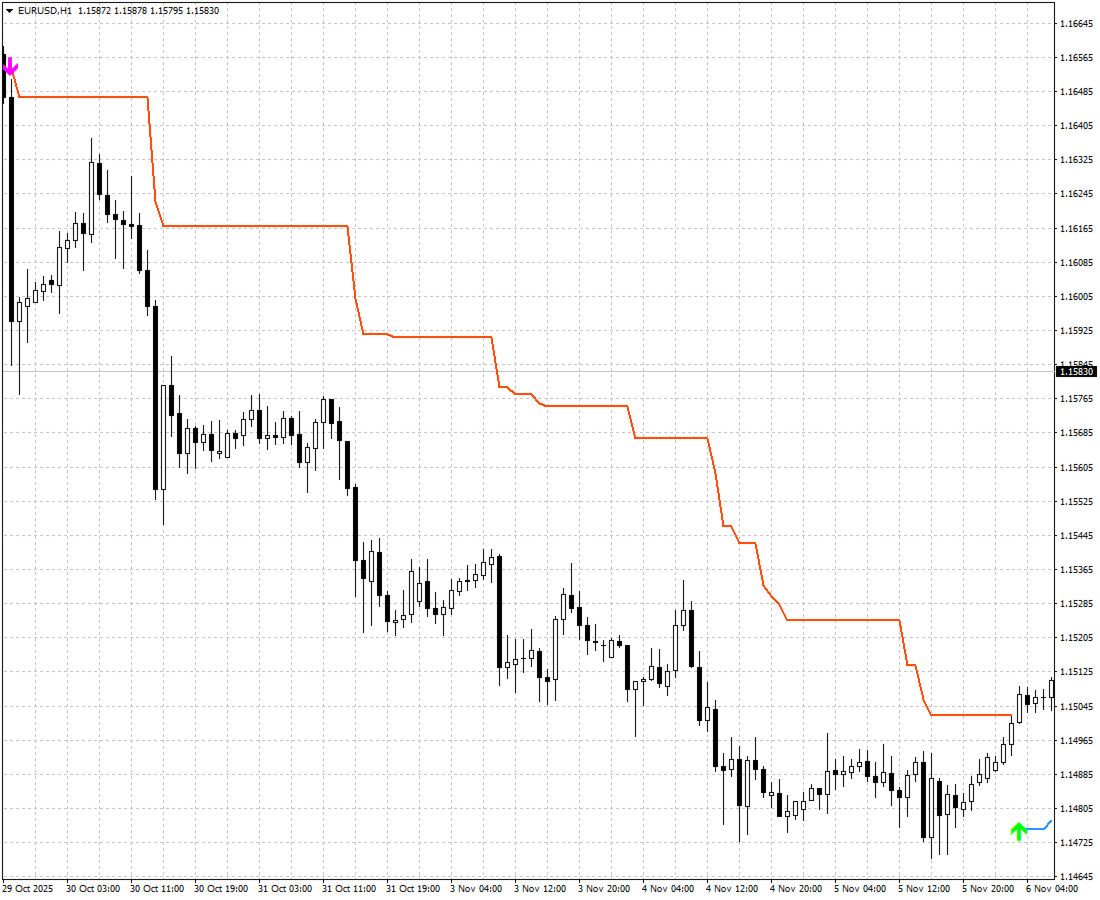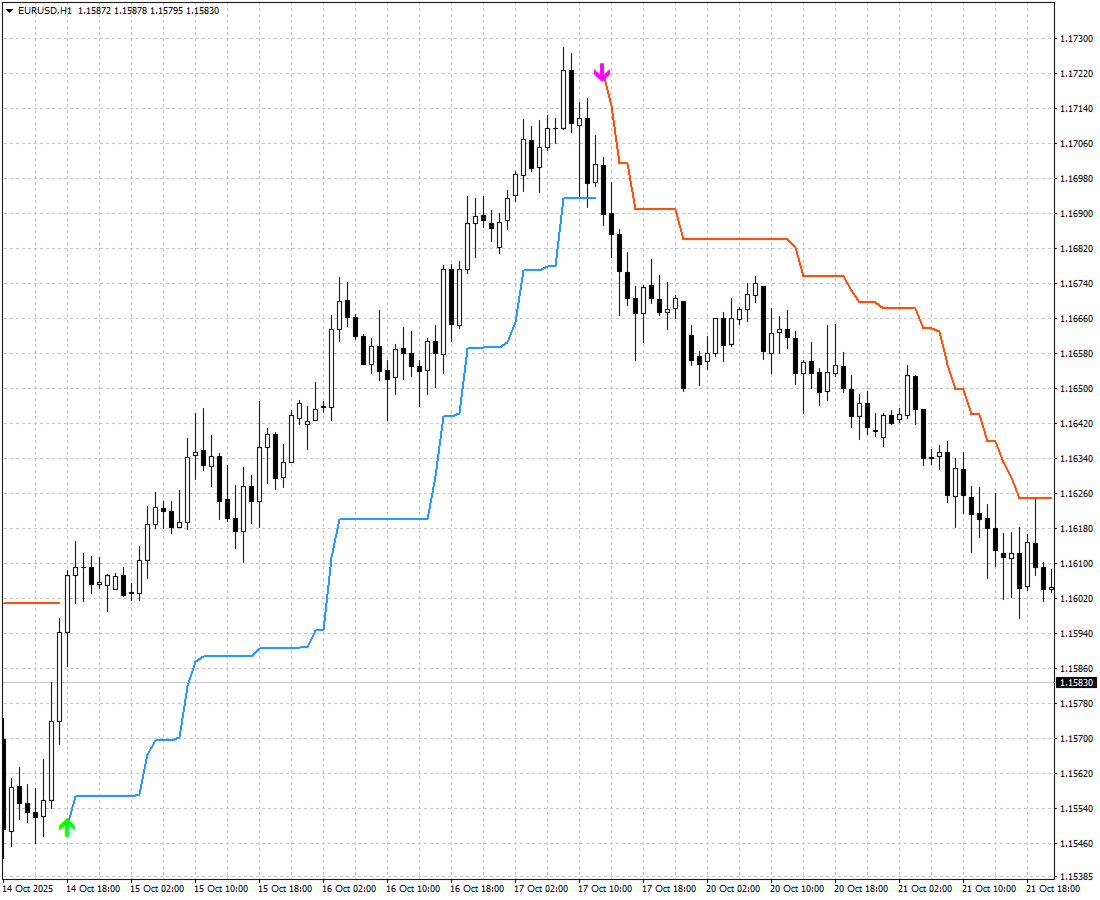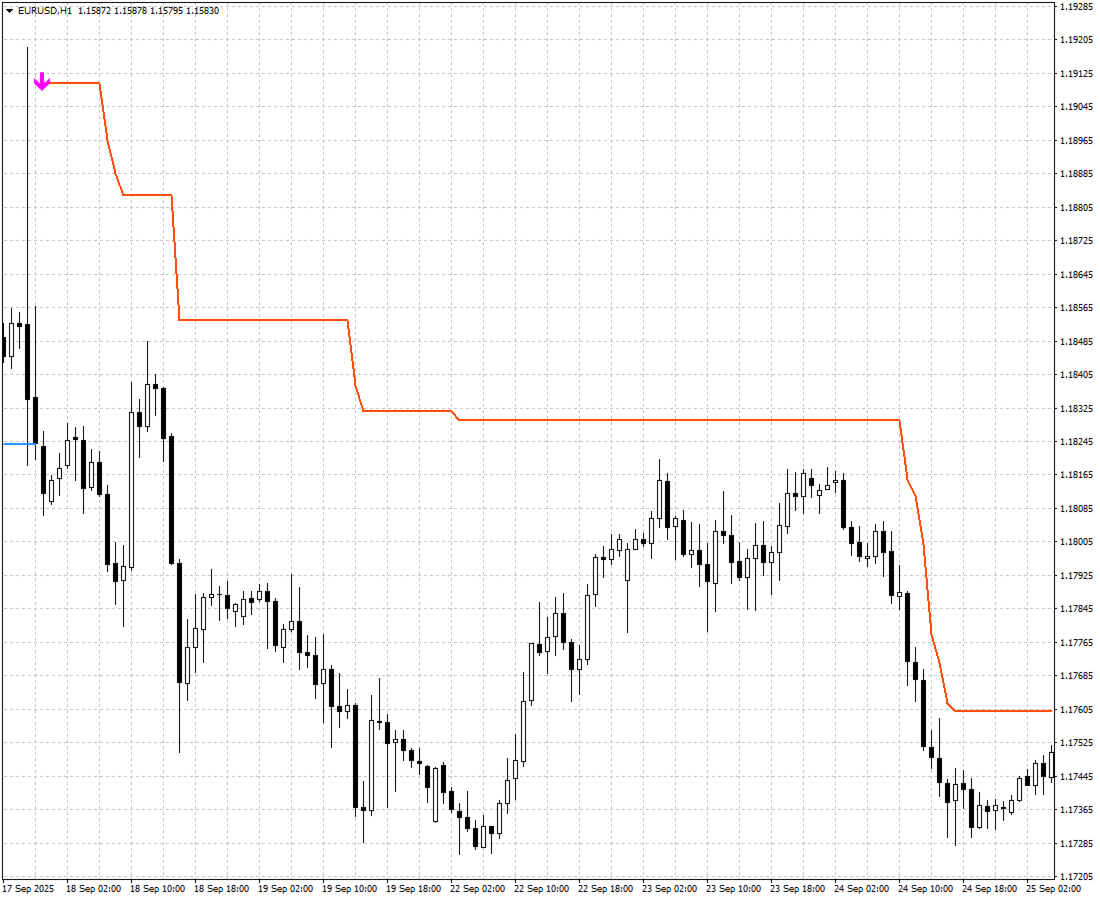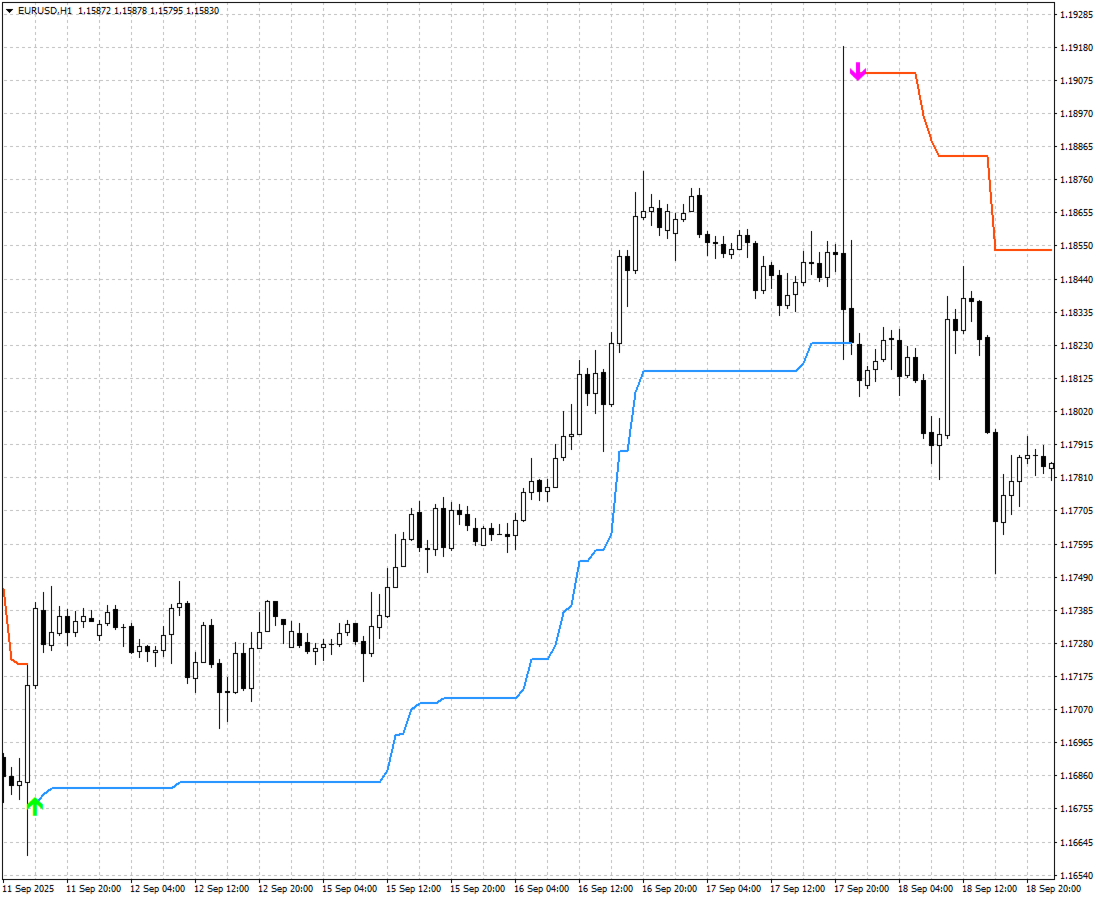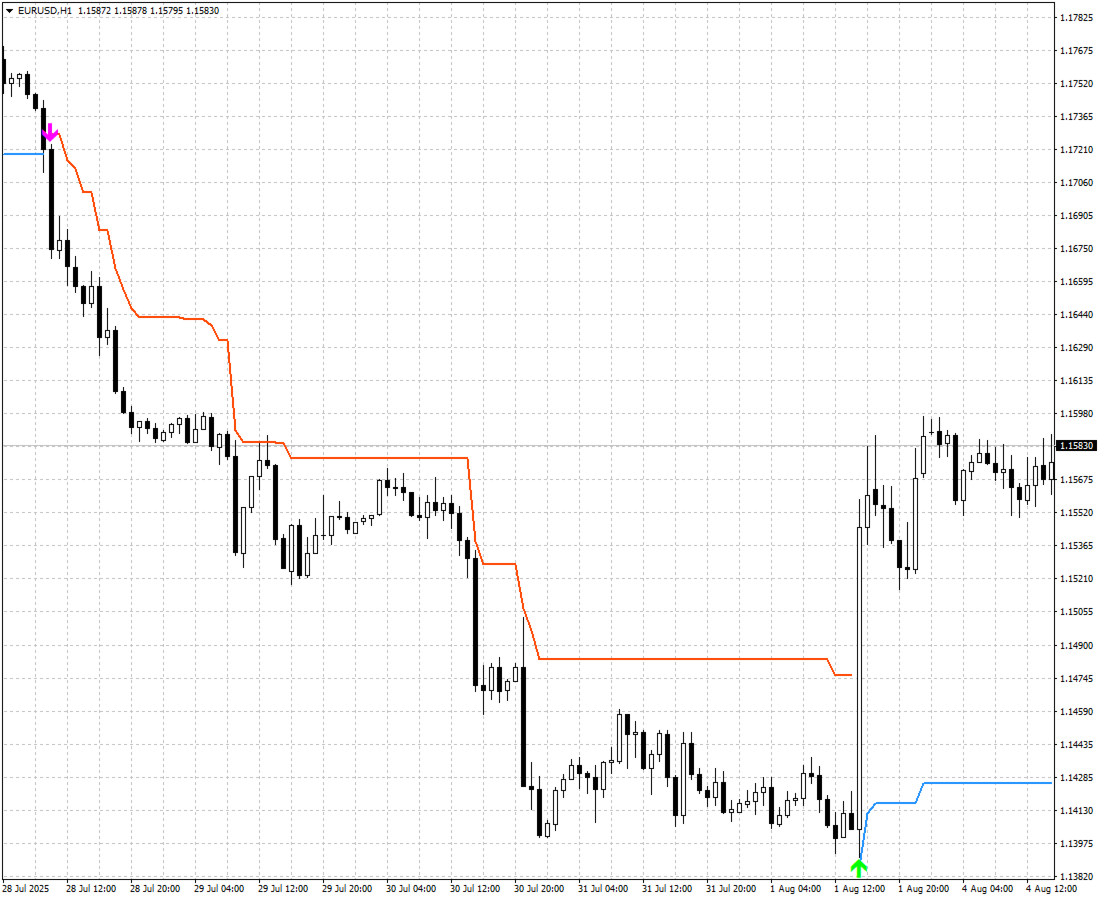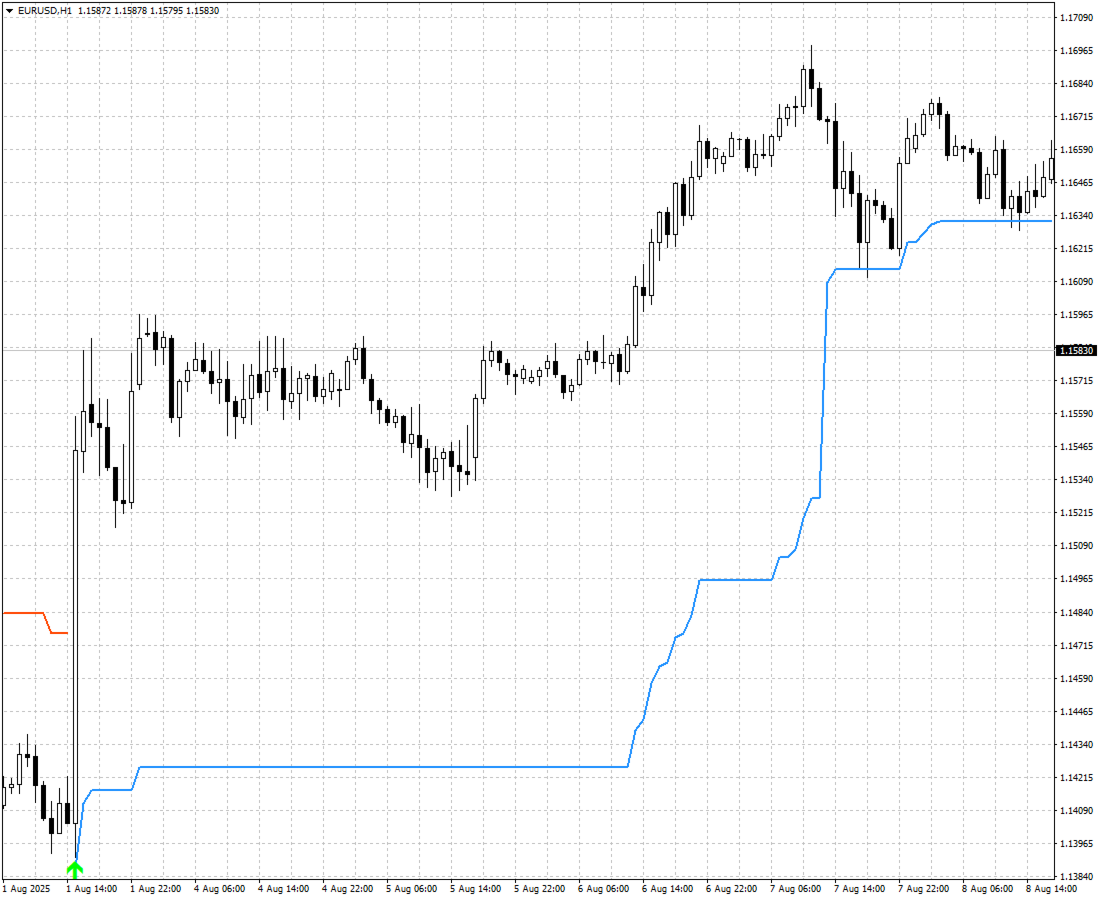
ThresholdDriftReversal
- Indicadores
- Versão: 1.10
- Ativações: 5

Adaptive Trend Reversal Indicator for MetaTrader 4
Overview
Threshold Drift Reversal is an adaptive trend-reversal indicator for MetaTrader 4 designed to identify directional transitions using a dynamic price threshold.
Instead of relying on fixed levels, the indicator measures how far price moves away from its current directional state. When the accumulated price drift exceeds the configured threshold, the indicator recalculates the active level, changes its directional state and generates a Long or Short signal.
The result is a structured and objective framework for monitoring potential trend transitions without relying on manually drawn levels or subjective chart interpretation.
How It Works
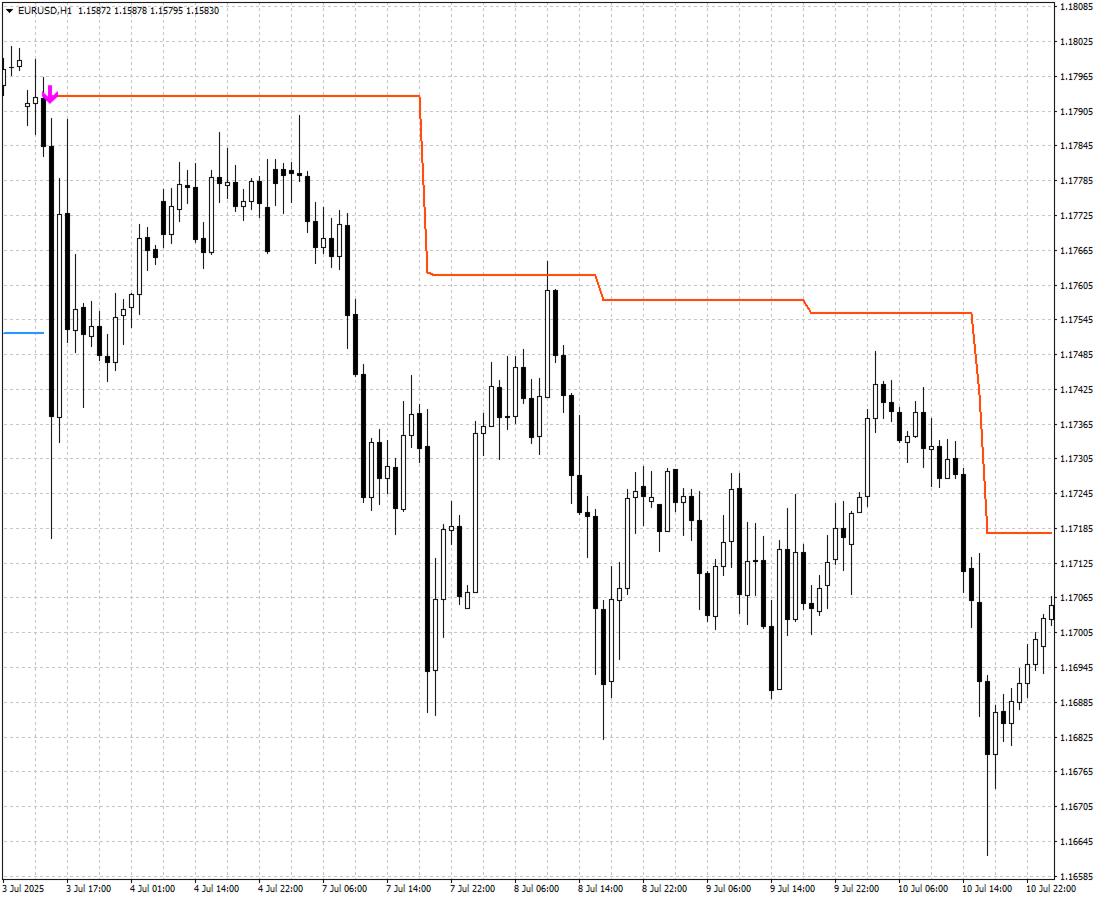
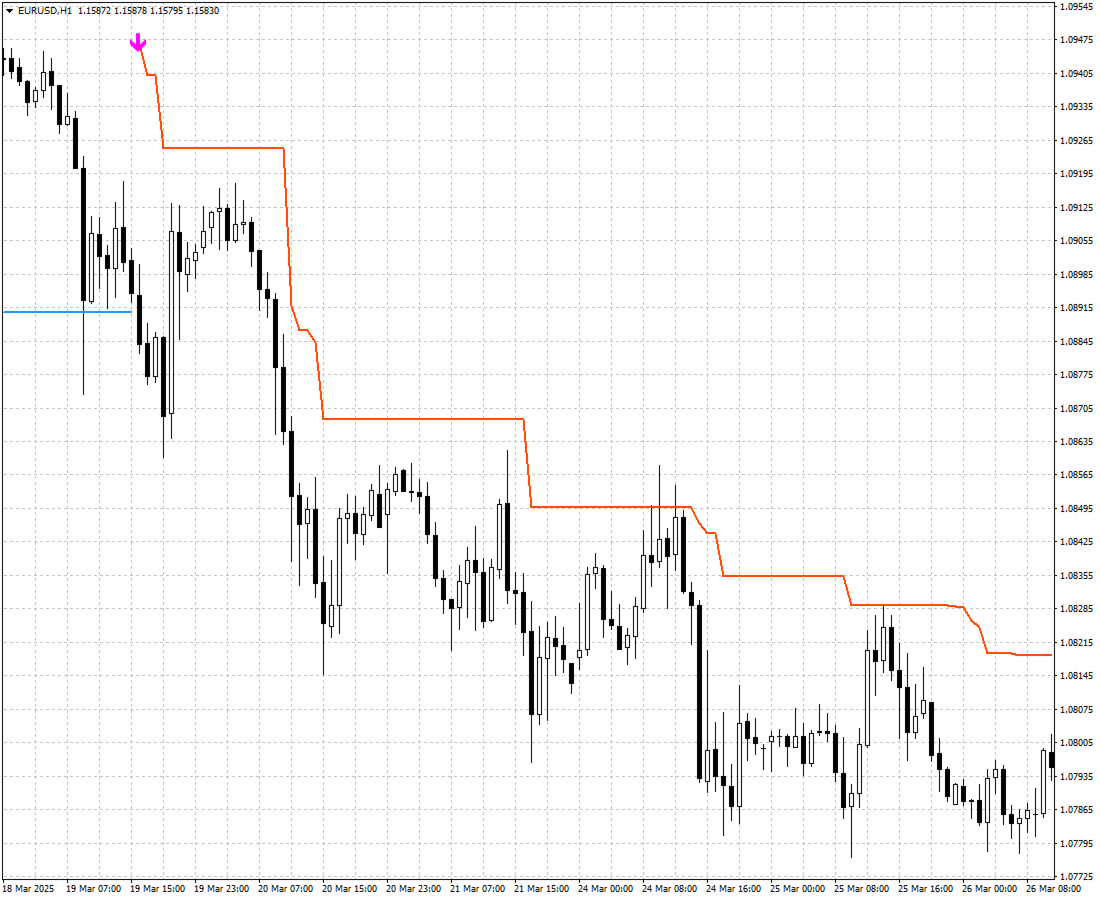
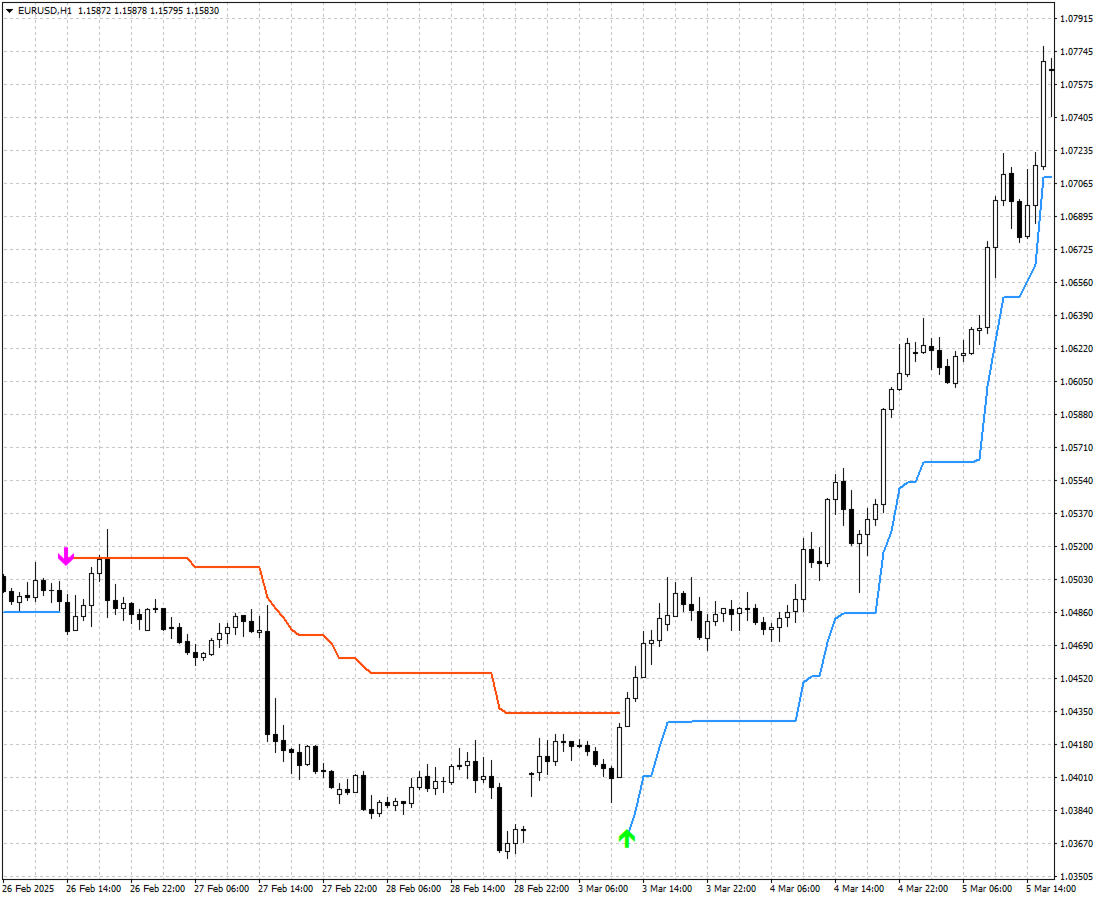
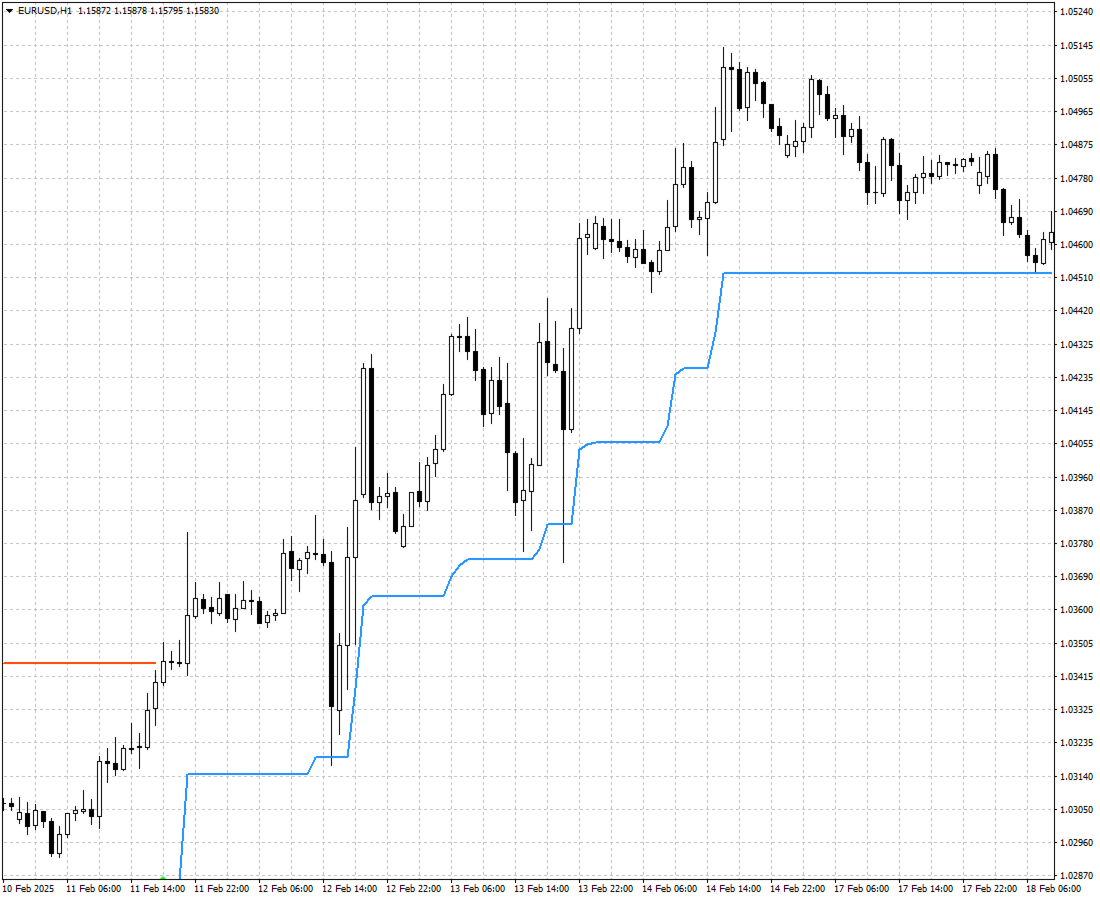
Threshold Drift Reversal builds a dynamic Floor / Ceiling corridor around the current price.
The corridor is calculated using the selected threshold window and drift sensitivity. Its distance can either be calculated automatically from recent price behaviour or defined using a fixed point-based step.
While price remains within the active threshold structure, the corresponding trend boundary remains active.
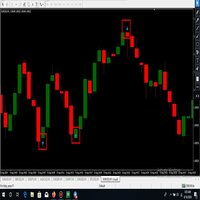
When price crosses the opposite threshold, the indicator recognizes a directional transition, recalculates the active level and places a directional arrow on the chart.
Long signals indicate an upward transition.
Short signals indicate a downward transition.
This creates a clear sequence of directional states that can be followed visually across the chart.
Key Features
Adaptive Reversal Threshold
The indicator dynamically adjusts its threshold according to recent price movement rather than using one static distance.
This allows the structure to respond differently during quieter and more active market conditions.
Non-Repainting Signal Structure
Long and Short arrows are generated from the indicator's directional transition logic and remain fixed on completed historical bars.
Adjustable Sensitivity
Drift Sensitivity controls how strongly the indicator reacts to deviations from the current directional state.
This allows the indicator to be configured for different trading styles and market conditions.
Automatic or Fixed Distance
The corridor distance can be calculated automatically or defined manually.
A value of 0 for Floor/Ceiling Step (pts) enables automatic calculation.
Flexible Visual Configuration
The indicator provides dedicated settings for:
-
Ceiling and Floor line colours;
-
Long and Short arrow colours;
-
line and arrow thickness;
-
Long and Short arrow symbols.
This makes it easy to integrate the indicator into virtually any chart template.
Four Independent Data Buffers
The indicator provides separate buffers for:
-
Ceiling;
-
Floor;
-
Long;
-
Short.
This structure makes the indicator convenient not only for discretionary analysis but also for integration into custom Expert Advisors, alert systems and other automated tools.
Input Parameters
Threshold Window
Defines the calculation period used to determine the adaptive reversal threshold.
Larger values generally create a smoother structure, while smaller values allow the indicator to react more closely to recent price movement.
Drift Sensitivity
Controls the sensitivity of the indicator to price deviation from the current directional state.
Floor/Ceiling Step (pts)
Defines a fixed distance for the Floor/Ceiling structure in points.
0 — enables automatic calculation.
Exposure Offset %
Applies an additional offset to the calculated level.
This parameter can be used to adjust the positioning of the threshold and experiment with earlier or later directional transitions.
Price Source Mode
Defines the price data used for the calculation.
Available modes include:
-
High / Low;
-
Close / Close.
Chart Shift
Controls the horizontal display position of the indicator on the chart.
Ceiling/Floor Line Color
Defines the colour of the Ceiling and Floor lines.
Long/Short Arrow Color
Defines the colour of the directional arrows.
Line/Arrow Thickness
Controls the visual thickness of the corridor lines and signal arrows.
Long/Short Arrow Symbol
Defines the symbols used to display Long and Short signals.
Recommended Usage
Threshold Drift Reversal can be used as a standalone directional reference or as one component of a broader trading methodology.
It can be combined with:
-
higher-timeframe trend analysis;
-
volume-based filters;
-
momentum indicators;
-
support and resistance analysis;
-
price-action confirmation;
-
custom automated strategies.
For different trading styles, experiment with the relationship between Threshold Window and Drift Sensitivity on historical data.
More reactive settings may respond faster to directional changes but can also produce more transitions. Smoother settings may reduce sensitivity to smaller price movements.
Because market behaviour varies between instruments and timeframes, parameter combinations should be evaluated separately for the symbol and timeframe being traded.
Built for Manual and Automated Analysis
Threshold Drift Reversal is designed with both chart-based analysis and integration in mind.
The clearly separated Ceiling, Floor, Long and Short buffers provide structured output that can be accessed by custom trading systems and Expert Advisors.
This makes the indicator suitable for traders who want a visual reversal tool as well as developers building their own automated logic around directional transitions.
Important Information
Threshold Drift Reversal is a technical analysis and decision-support tool. Its signals should not be interpreted as a guarantee of future market direction or trading performance.
Historical signals do not guarantee future results. Market conditions can change, and actual trading outcomes may be affected by spread, slippage, liquidity, execution quality and other factors.
Before using the indicator in live trading, test its behaviour on the instruments and timeframes you intend to trade and combine its signals with your own confirmation and risk-management rules.