Hidden Delta Flow
- Indicadores
-
Stanislav Konin
 I started my journey in Forex in 2017, and now I work in the stock market and futures.
I devote a lot of time to developing and testing effective trading systems. - Versão: 1.0
- Ativações: 7
Hidden - Delta - Flow is a professional trading system designed to detect hidden changes in market structure through comprehensive analysis of Hidden Divergence and Delta CVD Divergence, enhanced by normalized volume, an adaptive TP/SL model, and verifiable performance statistics.
Instead of simply displaying price direction, the system analyzes the relationship between price movement and internal volume activity, allowing it to identify situations where the external price structure begins to diverge from the actual underlying market pressure.
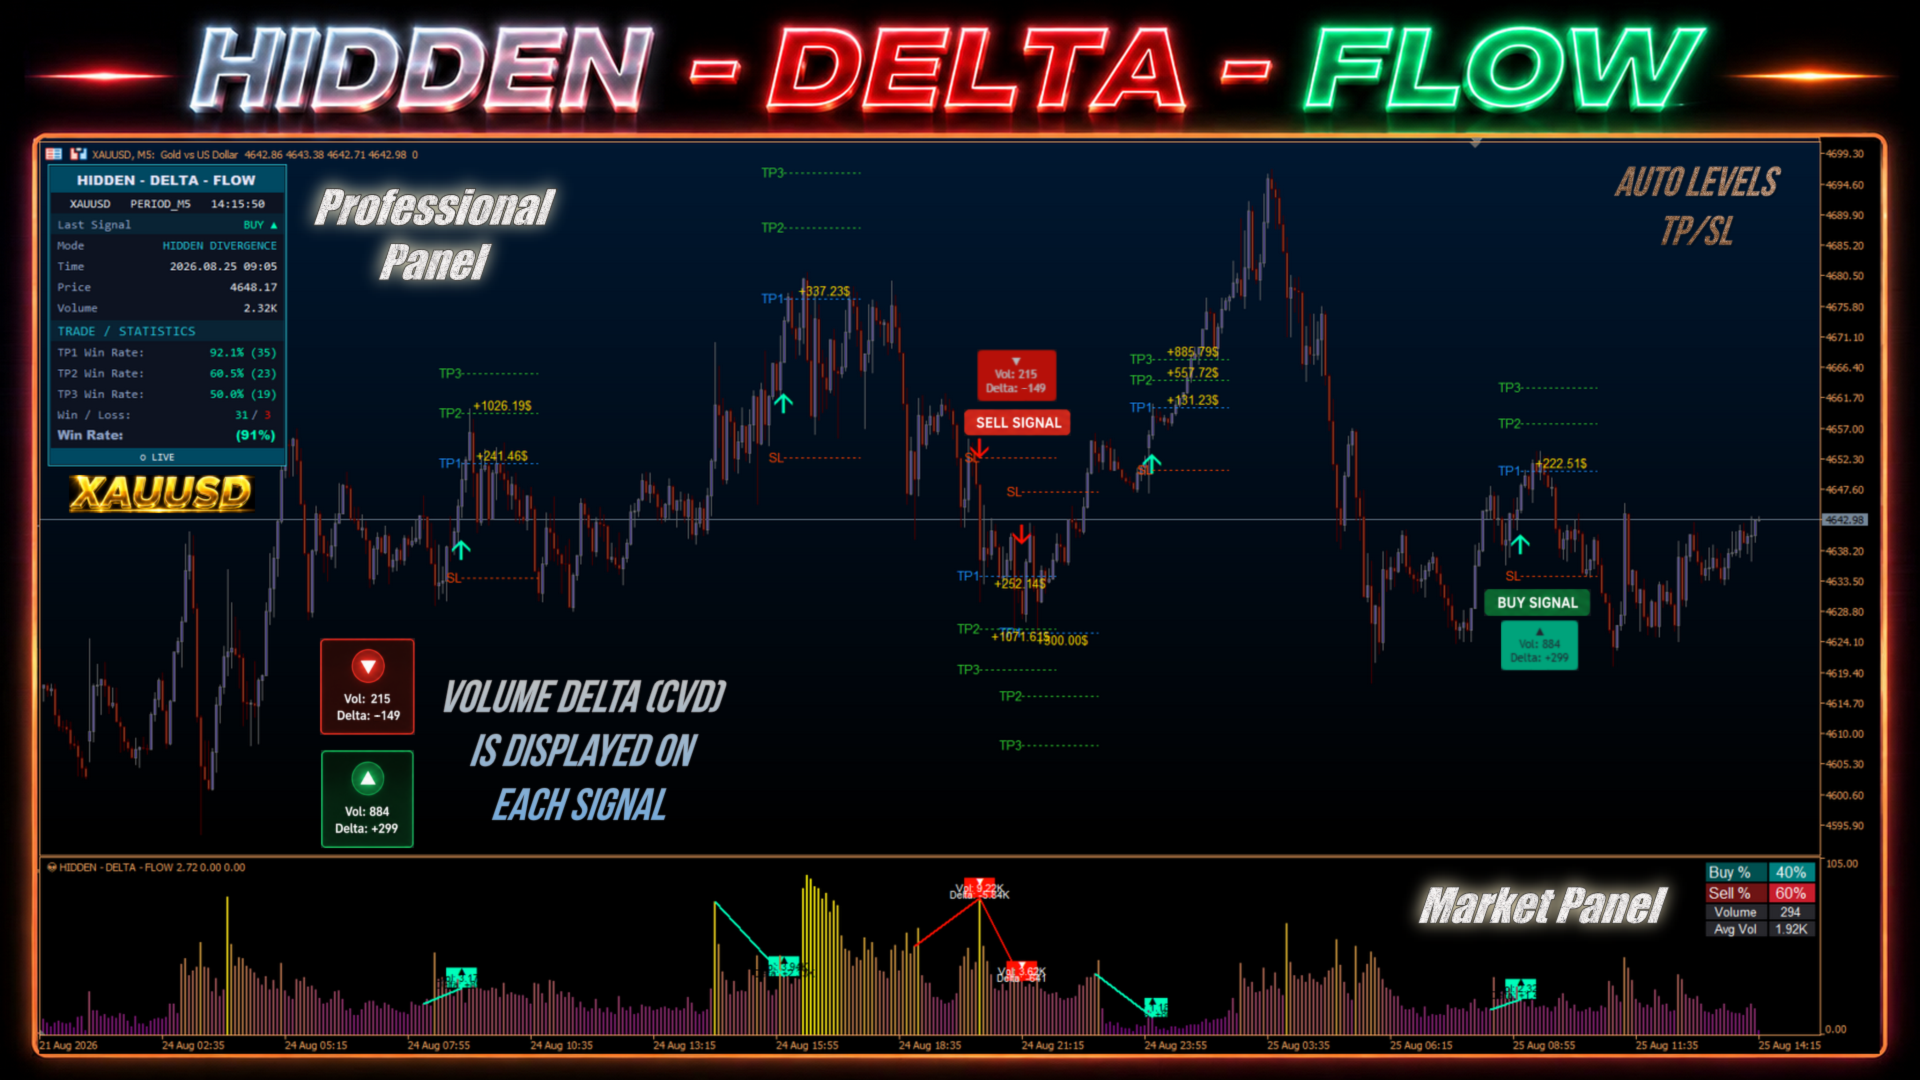
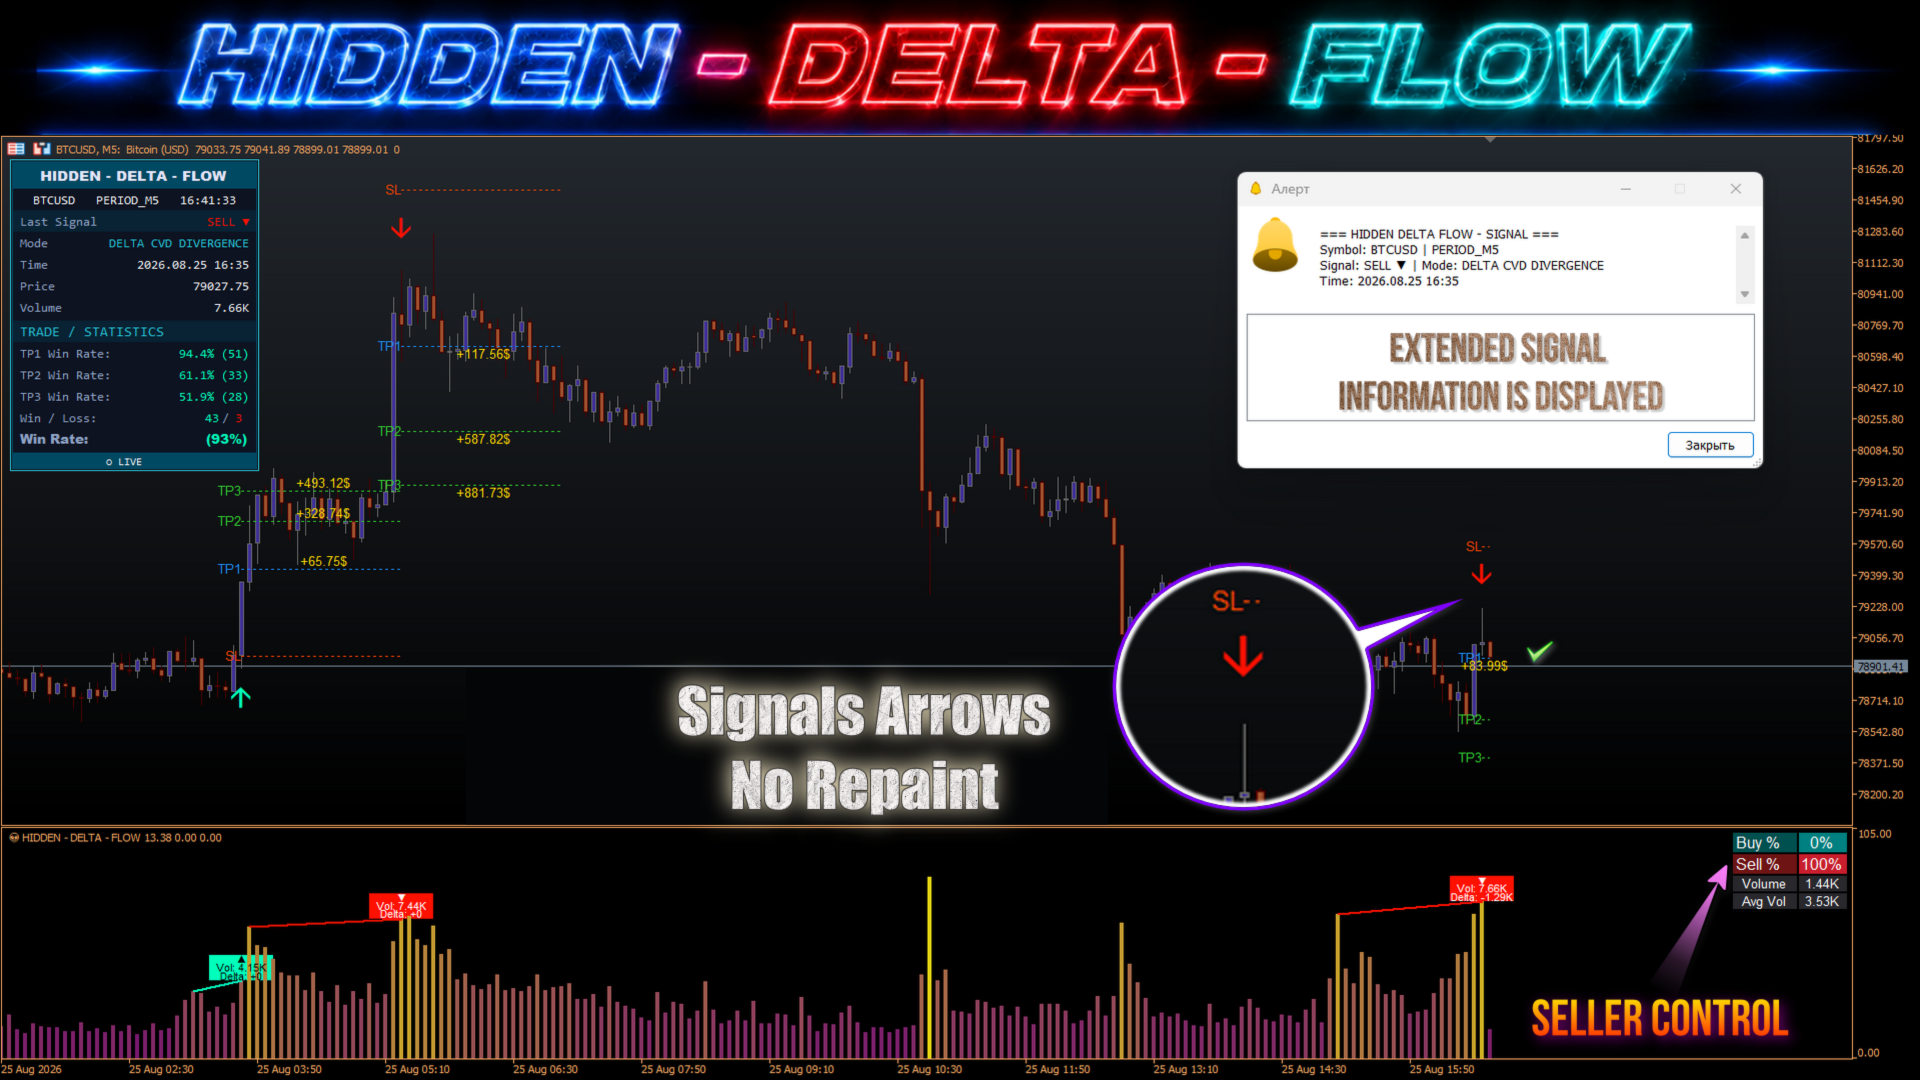
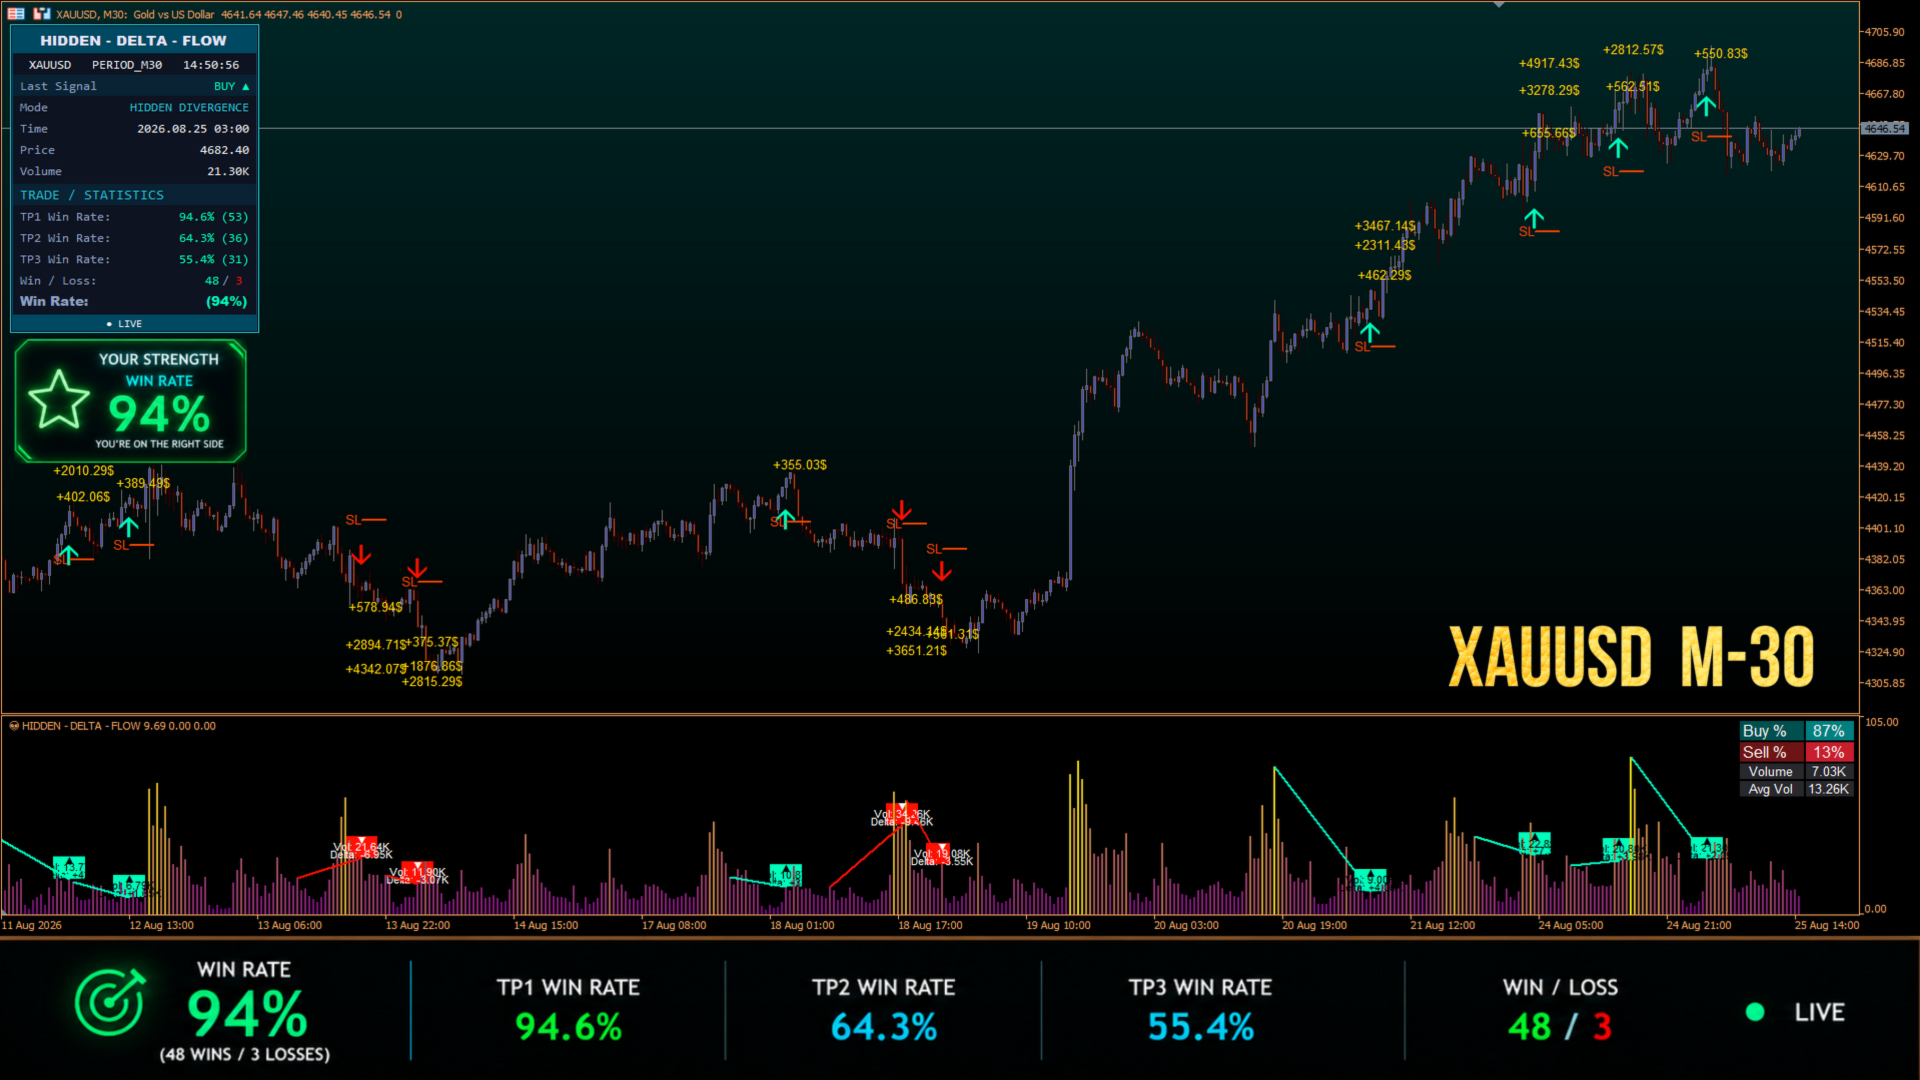
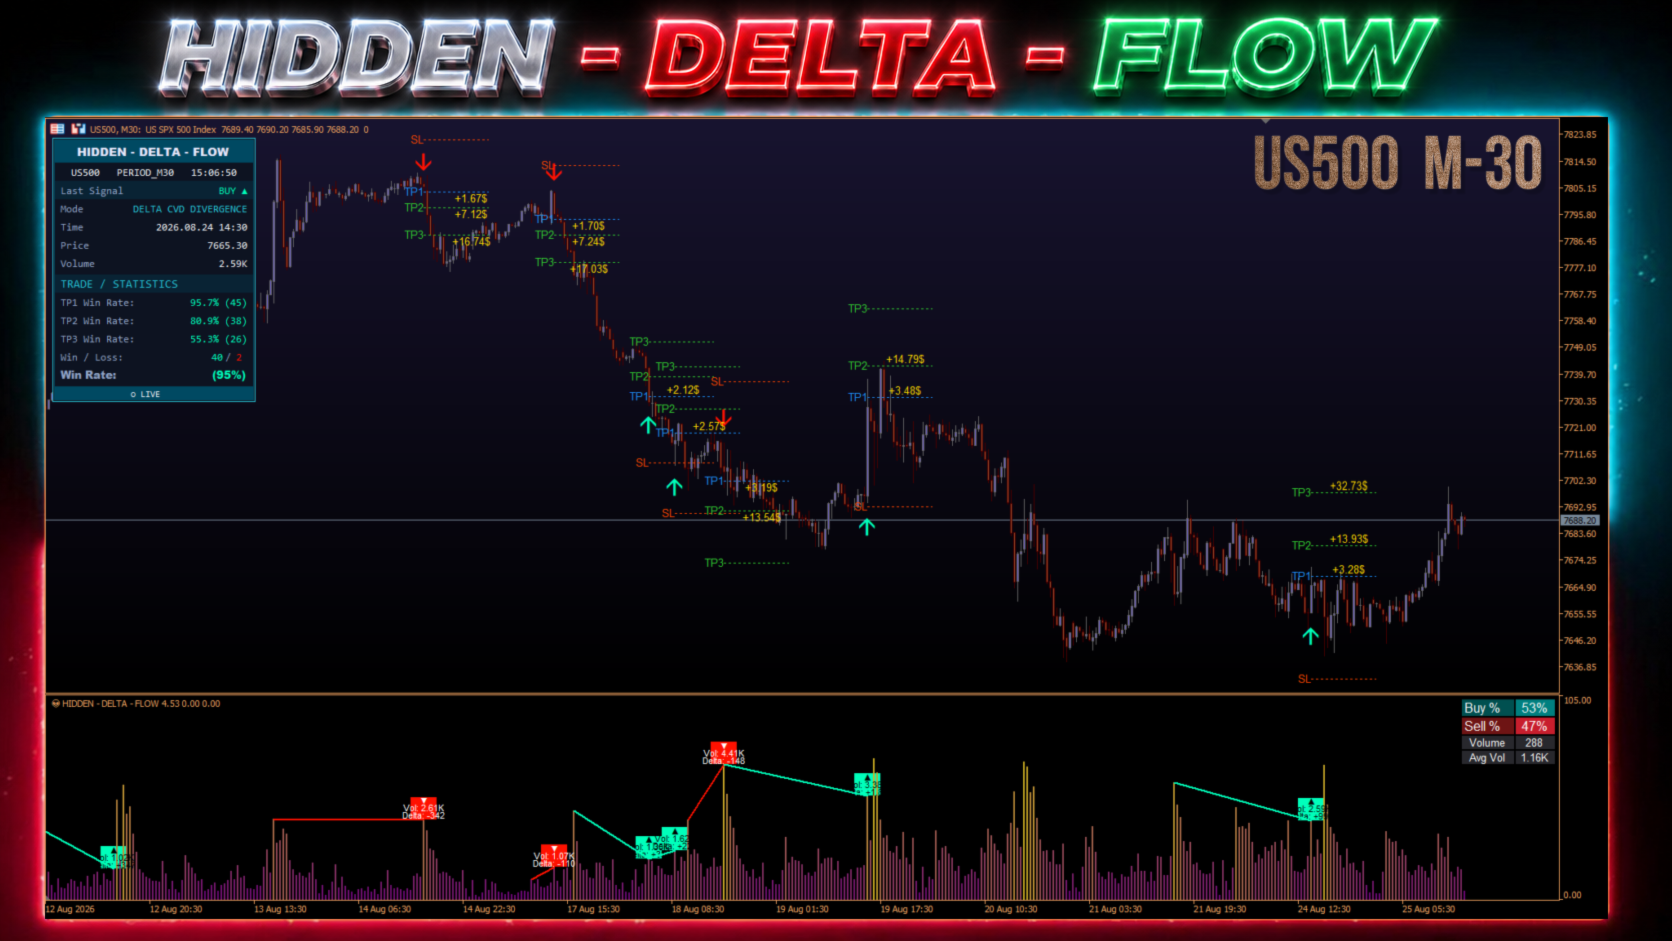
After a signal is generated, Hidden - Delta - Flow automatically calculates TP1, TP2, TP3, and SL levels, tracks their achievement in virtual mode, and collects performance statistics directly on the chart. This allows traders not only to receive signals, but also to objectively evaluate their effectiveness.
Key Advantages
-
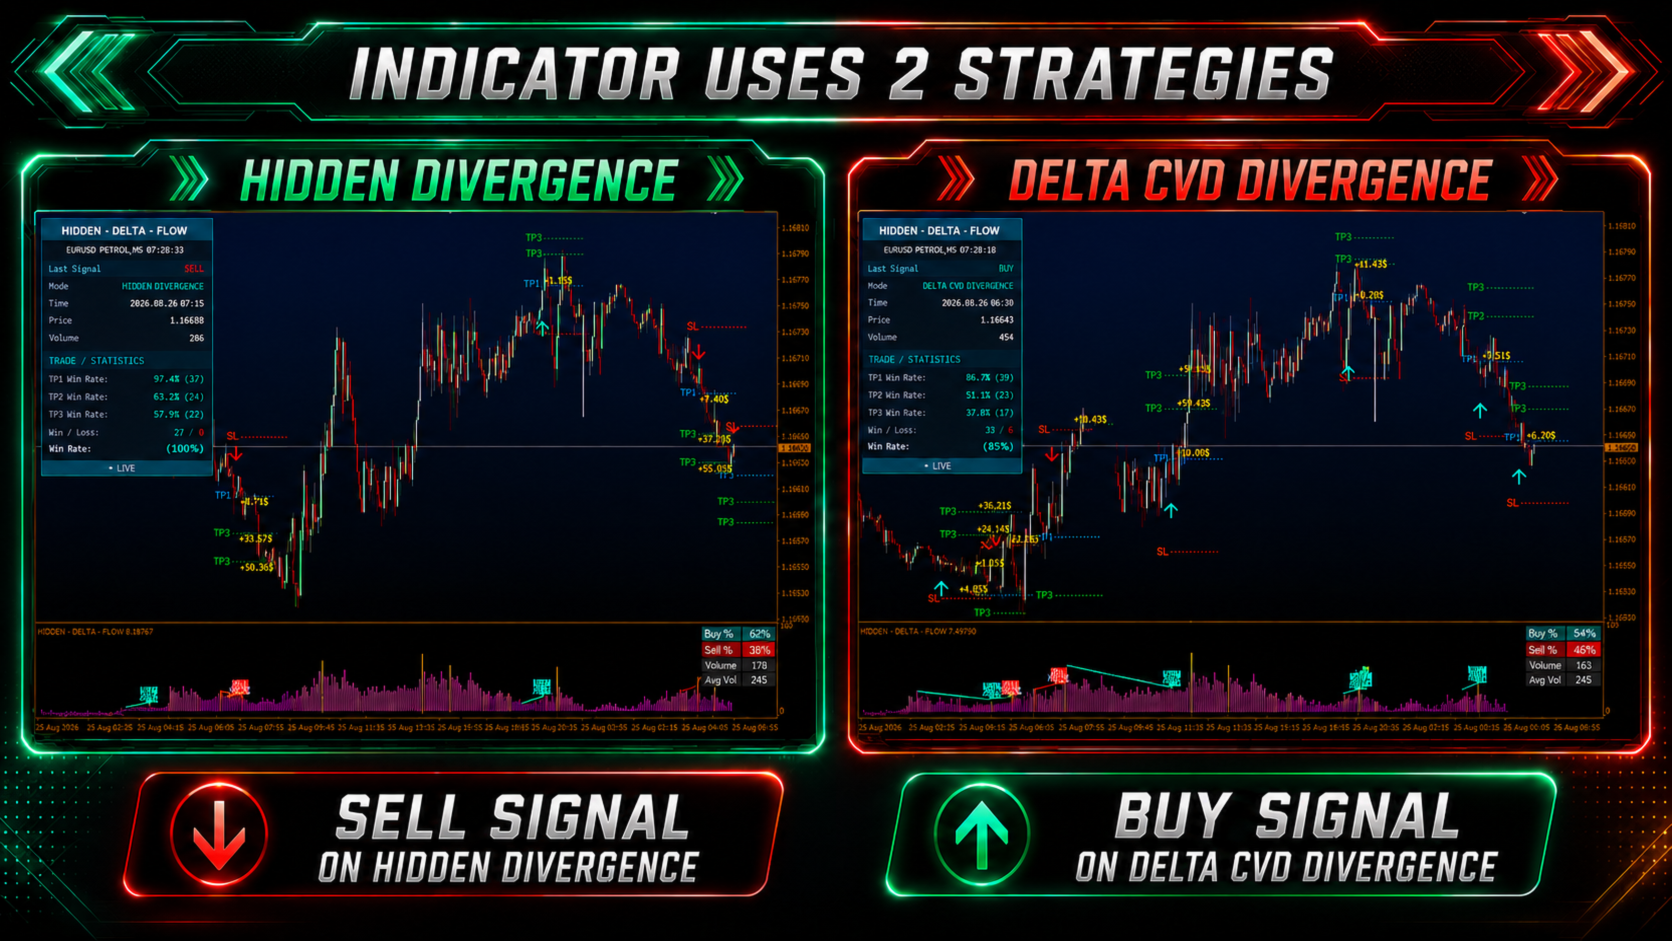
✅ Two Scanning Modes — users can choose between Hidden Divergence mode and Delta CVD Divergence mode.
-
✅ Multi-Level Signal Filtering — each mode uses a three-component validation process: price structure analysis (Hidden), volume delta (Delta), and flow dynamics (Flow), significantly reducing the number of false signals.
-
✅ Built-in Virtual Trading Module — automatic calculation of TP1/TP2/TP3 and SL levels based on ATR, with visual trade cards on the chart, touch statistics, and results displayed in monetary terms. This allows traders to objectively evaluate signal performance without risking their trading capital.
-
✅ Flexible Visualization Settings — gradient histogram of normalized volume, customizable arrows and labels, configurable color schemes, and the ability to disable any interface elements for a clean, minimalist display.
-
✅ Information Dashboards — two dashboards (main and indicator subwindow) display the current signal, operating mode, virtual trade statistics, Win Rate, number of TP1/TP2/TP3 touches, and Win/Loss ratio in real time.
-
✅ Automatic Object Management — a graphical object control system limits the maximum number of chart objects, preventing terminal overload and ensuring stable operation during extended use.
-
✅ MTF Delta — volume delta can be calculated from any selected timeframe independently of the chart timeframe, providing deeper market-flow analysis.
-
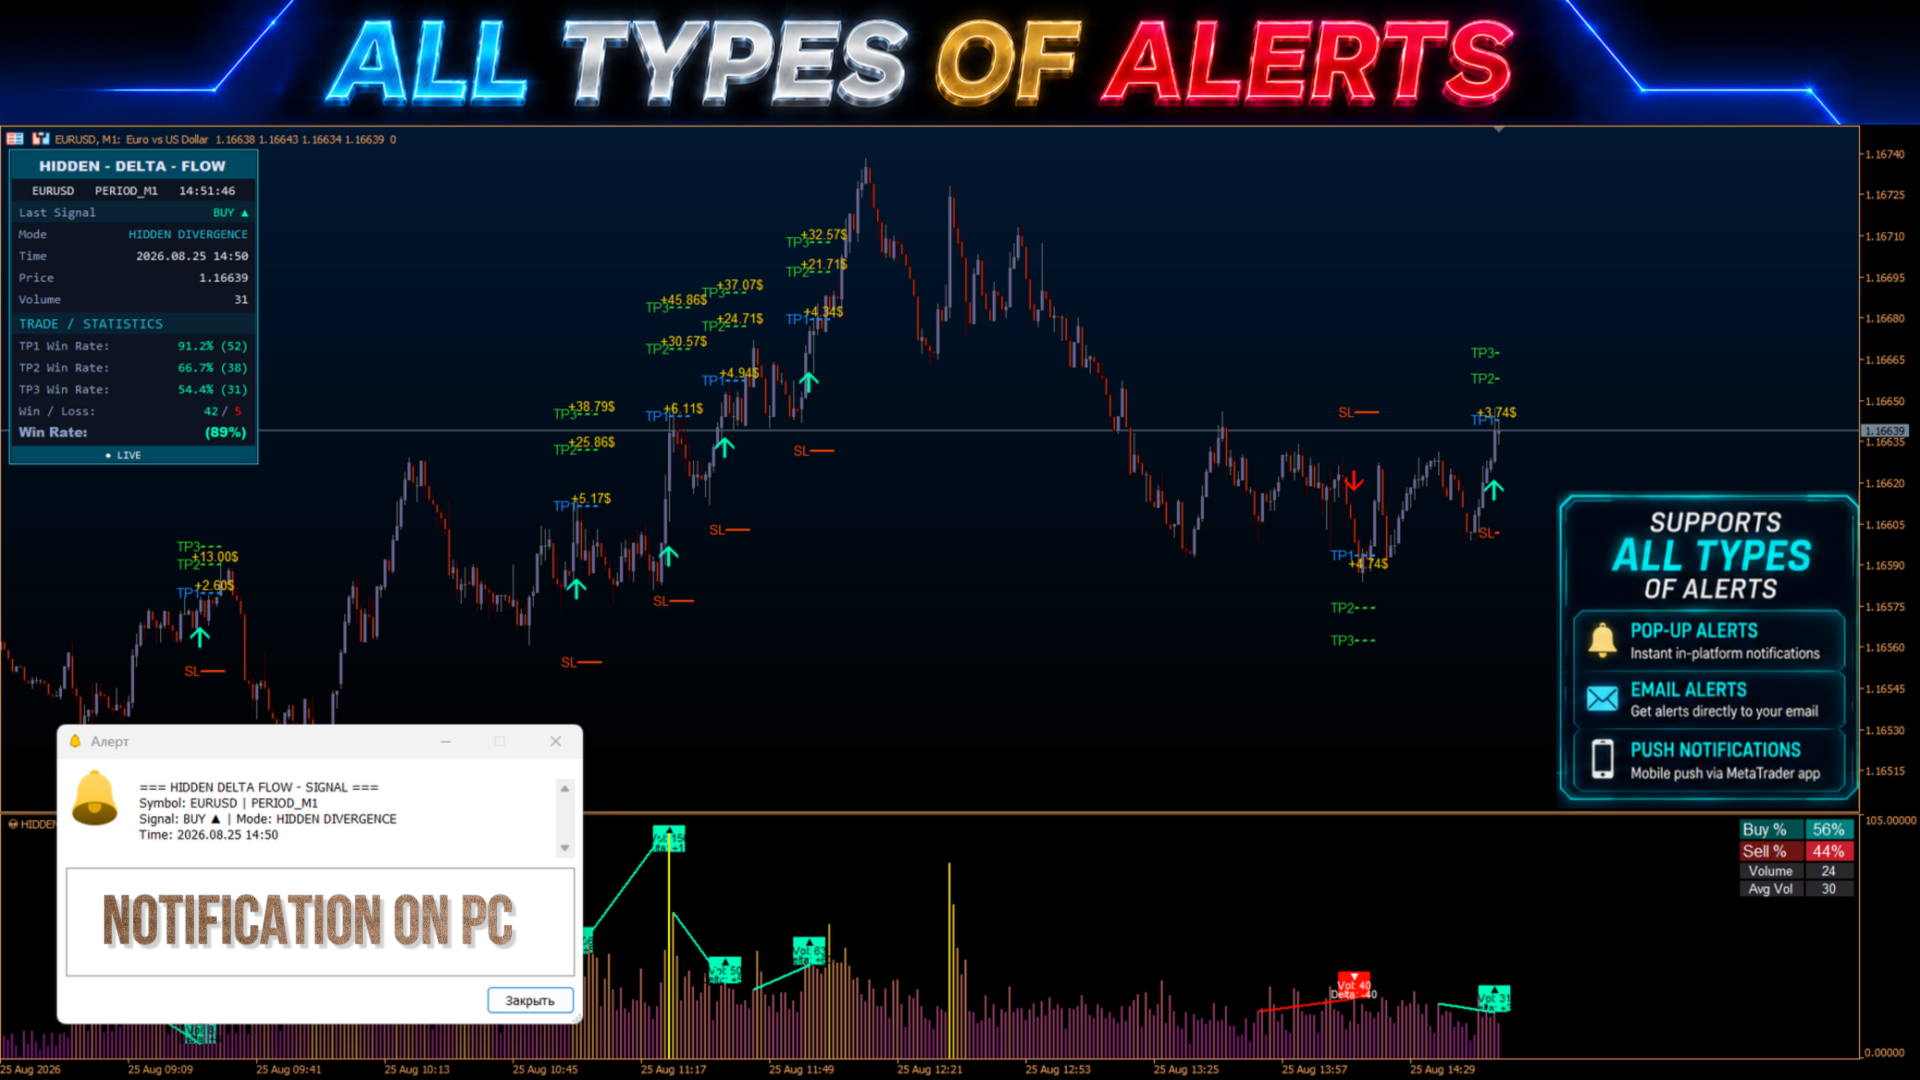
✅ Alerts & Notifications — built-in alert system with pop-up notifications, push notifications, and email alerts when new signals appear.
🟣 Hidden Divergence Engine
A proprietary algorithm that compares local price structure (Higher Low / Lower High) with changes in normalized volume at the corresponding points.The logic is based on identifying situations where a correction occurs with declining activity — price retraces, but the volume of the correction is weaker than during the previous comparable move. This helps distinguish weakening activity on the opposing side from a genuine trend reversal.
Hidden Bullish — price maintains an upward structure while the correction in volume forms a lower activity low. Weaker volume during the retracement may indicate that selling pressure is losing strength.
Hidden Bearish — price maintains a downward structure while the volume of the retracement decreases. This may indicate weakening buying activity within the correction.
🟣 Delta / CVD Divergence Engine
The algorithm works with directional volume flow calculated using lower-timeframe data relative to the active chart timeframe. This provides a more detailed view of which side was more active within each candle — buyers or sellers.A divergence is detected when a new price extreme is not confirmed by the corresponding Delta-flow extreme.
For example, price makes a new low, but selling volume at that point is lower than at the previous low. Price continues to decline while selling pressure weakens.
This brings the analysis closer to footprint logic — the way volume-based traders analyze market activity at the individual candle level — without requiring manual analysis of tick-by-tick data.
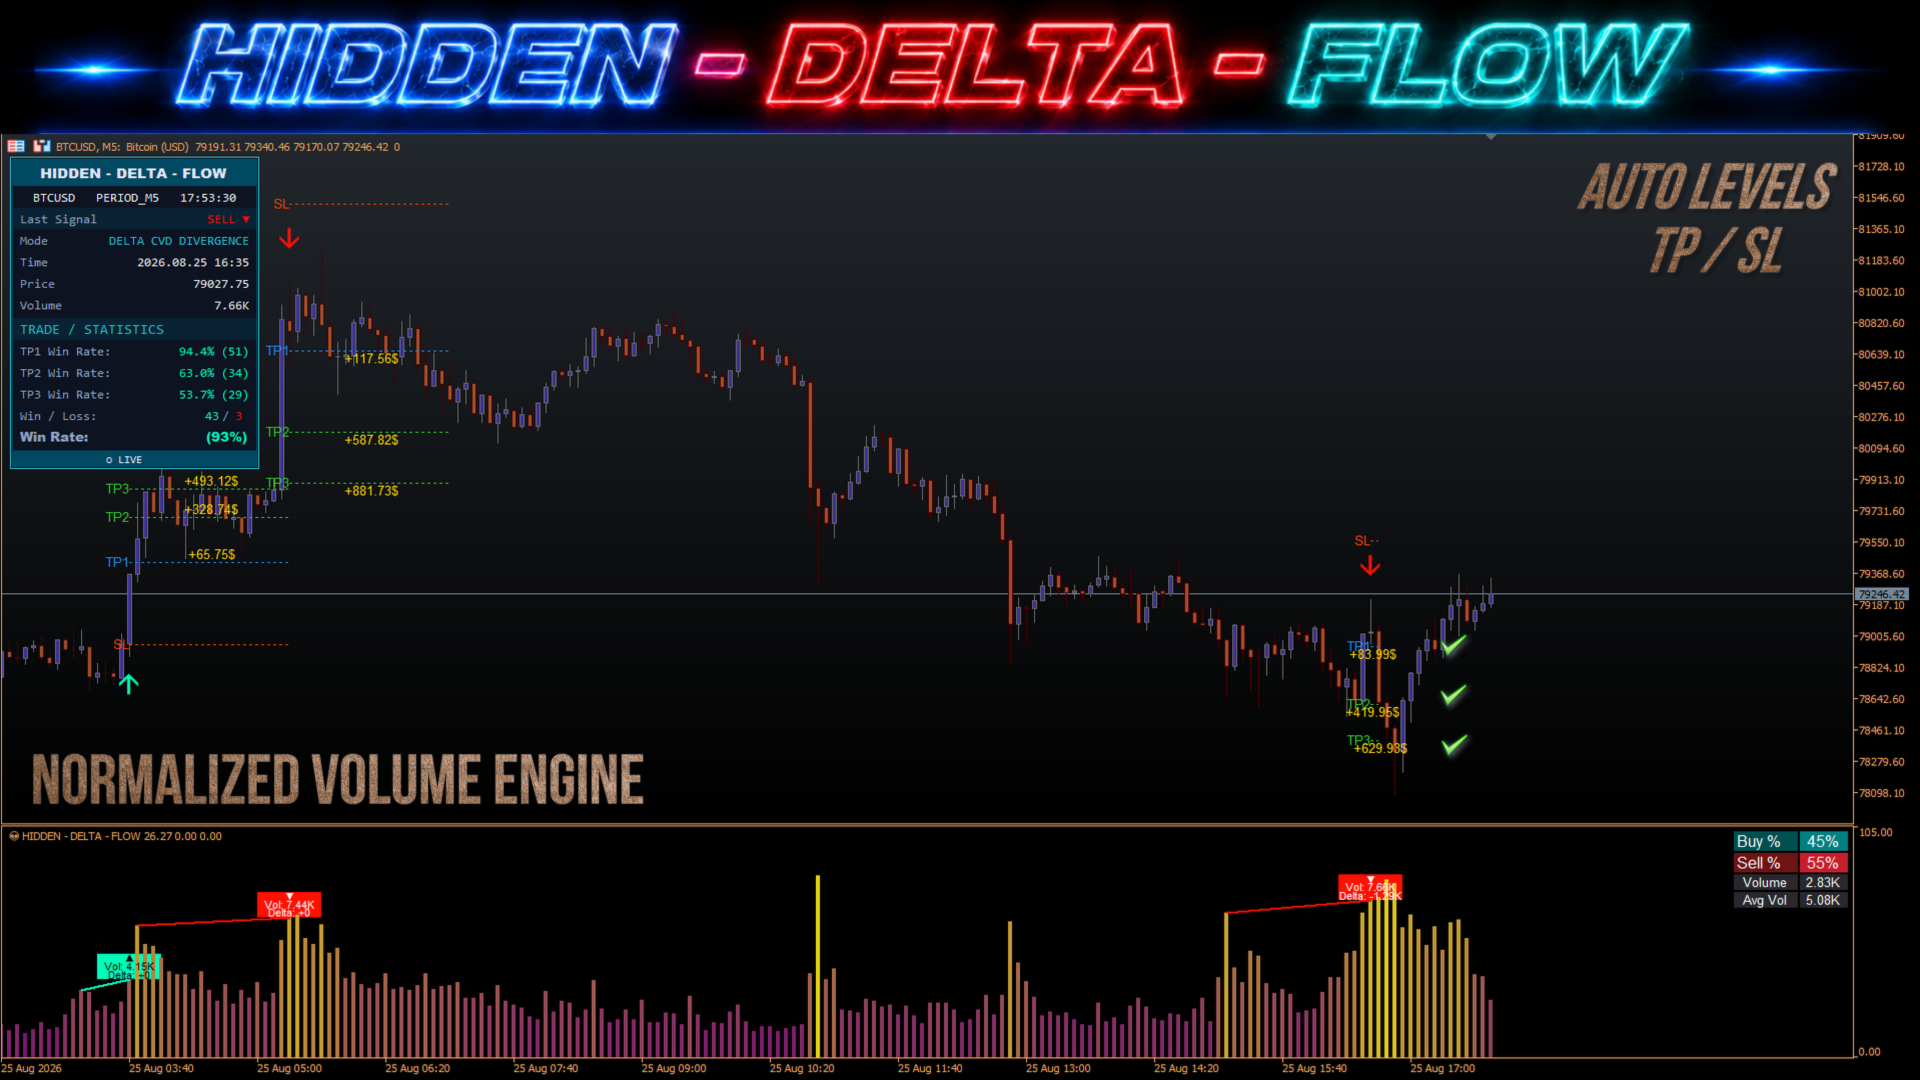
🟣 NORMALIZED VOLUME ENGINE
The system uses normalized volume to analyze the relative intensity of market activity.
Absolute volume can vary significantly depending on the instrument, time of day, and current volatility. Therefore, the algorithm evaluates volume relative to a historical sample.
This allows the system to identify:
- Increased activity
- Decreased activity
- Local volume extremes
- Changes in the character of price movement
- Divergences between price and volume
🟣 TP/SL OPTIMIZATION
After a signal is generated, the system creates a virtual trade with a complete set of levels:
TP1 → TP2 → TP3 → SL
Distances are calculated using ATR multiplied by an individual multiplier for each level.
This allows traders to build different risk/reward models — from more conservative configurations with a closer TP2 and wider SL to more aggressive configurations with an extended TP3 and tighter SL.
🟣 ADVANCED PERFORMANCE STATISTICS
The key difference between this system and a conventional signal indicator is its built-in statistics based on forward tracking.
Each virtual trade is tracked forward in time from the moment the signal appears until TP or SL is reached, with the result calculated in real time.
- Win Rate separately for TP1, TP2, and TP3
- Overall Win Rate across all closed trades
- Number of Wins and Losses
This transforms the indicator from a simple “arrow-watching” tool into a performance evaluation system.
Traders can change the TP/SL multipliers and immediately see how those changes affect the statistics.
This approach allows parameters to be optimized based on actual historical performance rather than guesswork — for a specific instrument, timeframe, and current market behavior.
🟣 PROFESSIONAL DASHBOARD — Everything Under Control
A unified dashboard displays the current operating mode, time and price of the latest signal, volume, number of BUY/SELL signals, and complete TP/SL statistics — without the need to switch between different analytical tools.
🟣 MARKET PANEL
An additional compact panel is located directly in the indicator subwindow next to the volume histogram.
It is designed for quick monitoring of the current market condition and provides an operational overview of the market flow.
🟣 MONEY RESULT
When the corresponding setting is enabled, the system can display the monetary value of the result based on the specified position size.
This allows traders to additionally evaluate the potential result of reaching TP or SL.
It provides a quick way to assess the current market-flow condition without taking attention away from the chart. This is especially useful during active scalping, when key information needs to be interpreted within seconds.
📢 Alerts & Notifications
Hidden - Delta - Flow supports all major notification types:
- 🔔 Pop-up alerts
- 🔔 Email alerts
- 🔔 Push notifications
🟠 RECOMMENDATIONS FOR USE GOLD / XAUUSD INDICES:
US30, NASDAQ, S&P500 and other highly liquid indices.
CRYPTO:BTCUSD, ETHUSD and other instruments with high trading activity.
FOREX:Major and highly liquid currency pairs.
Recommended timeframe range: M1 to H1.
For Delta CVD mode, it is recommended to use a lower timeframe relative to the active chart timeframe. This provides a more precise footprint-style view of the internal activity within each bar.
It transforms divergence analysis into a structured process — from detecting market discrepancies to evaluating their actual performance.
After your purchase, contact me via private message and receive the 🤖 HIDDEN DELTA FLOW EA completely FREE for 1 month.
This is an advanced trading robot based on the algorithms of the HIDDEN — DELTA — FLOW system.