Fair Value Gap Zones Multi Timeframe
- Indicadores
-
Sompop Jittrakul
 Trader since 2007 and owner of www.ThailandTraderClub.com - www.ThailandTradingSchool.com - www.TradingStat.me
 - Versão: 1.10
- Atualizado: 20 setembro 2026
- Ativações: 20
FVG Zones MTF
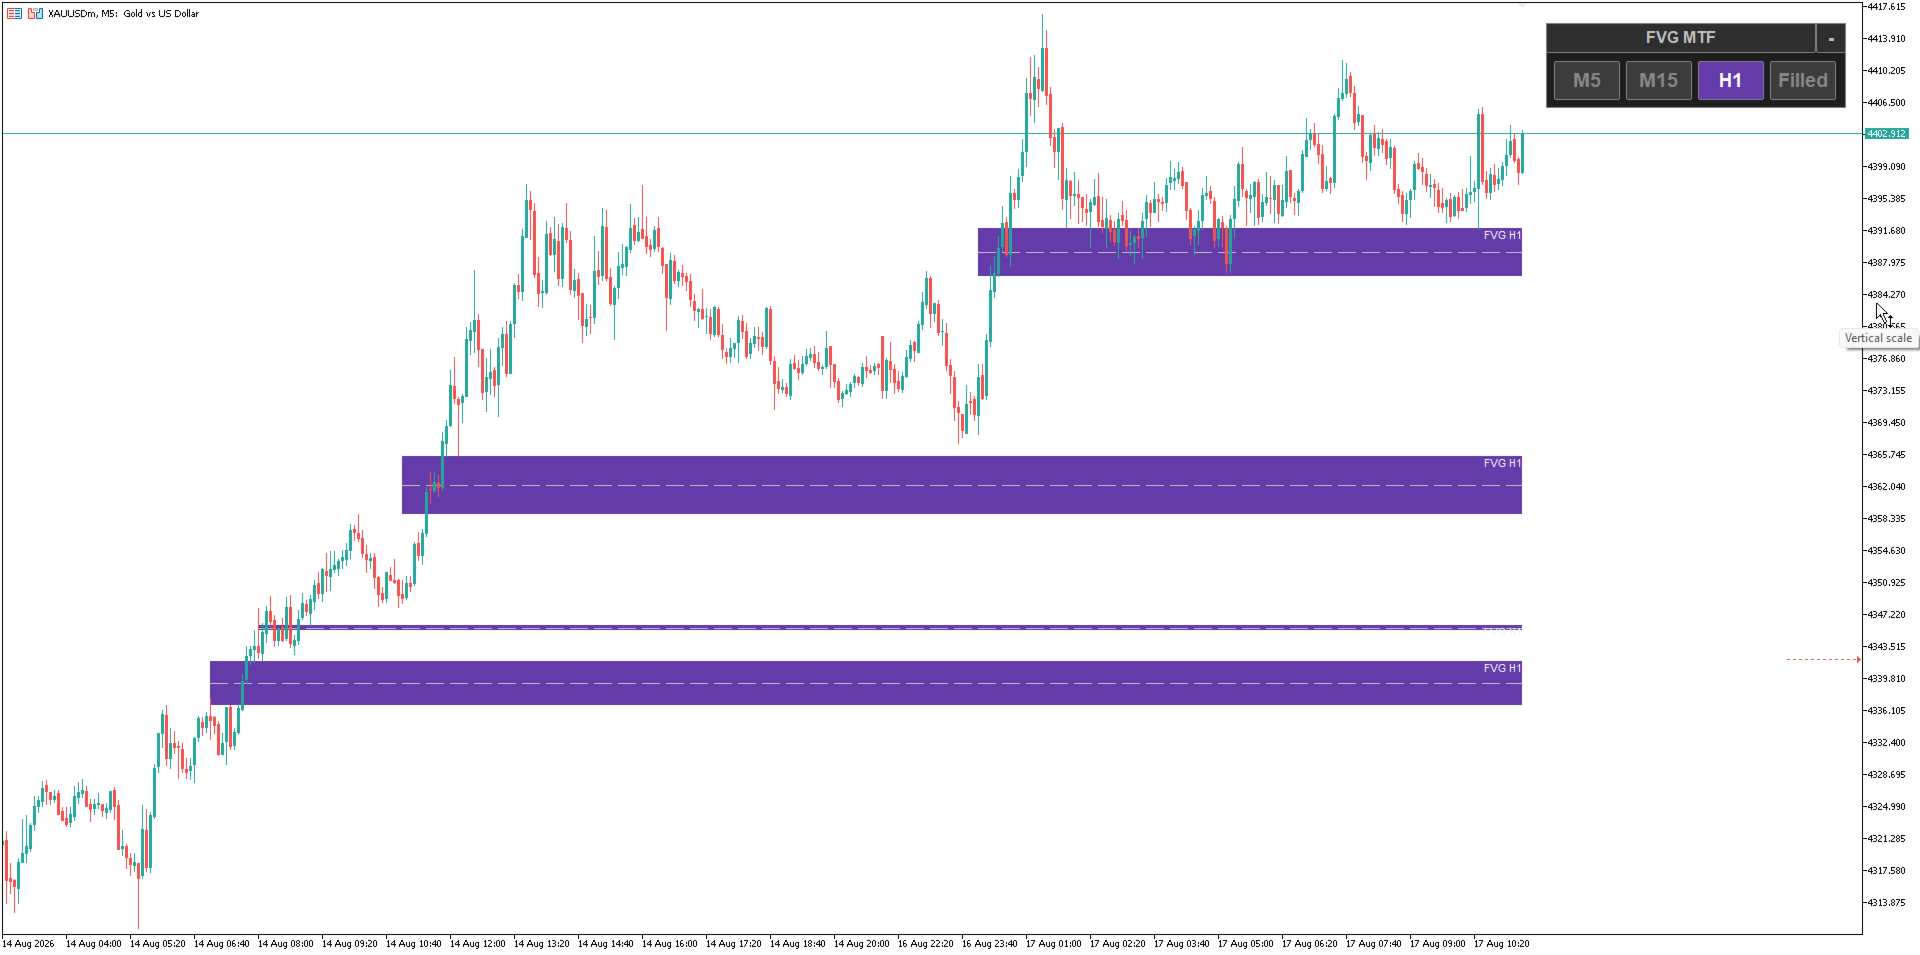
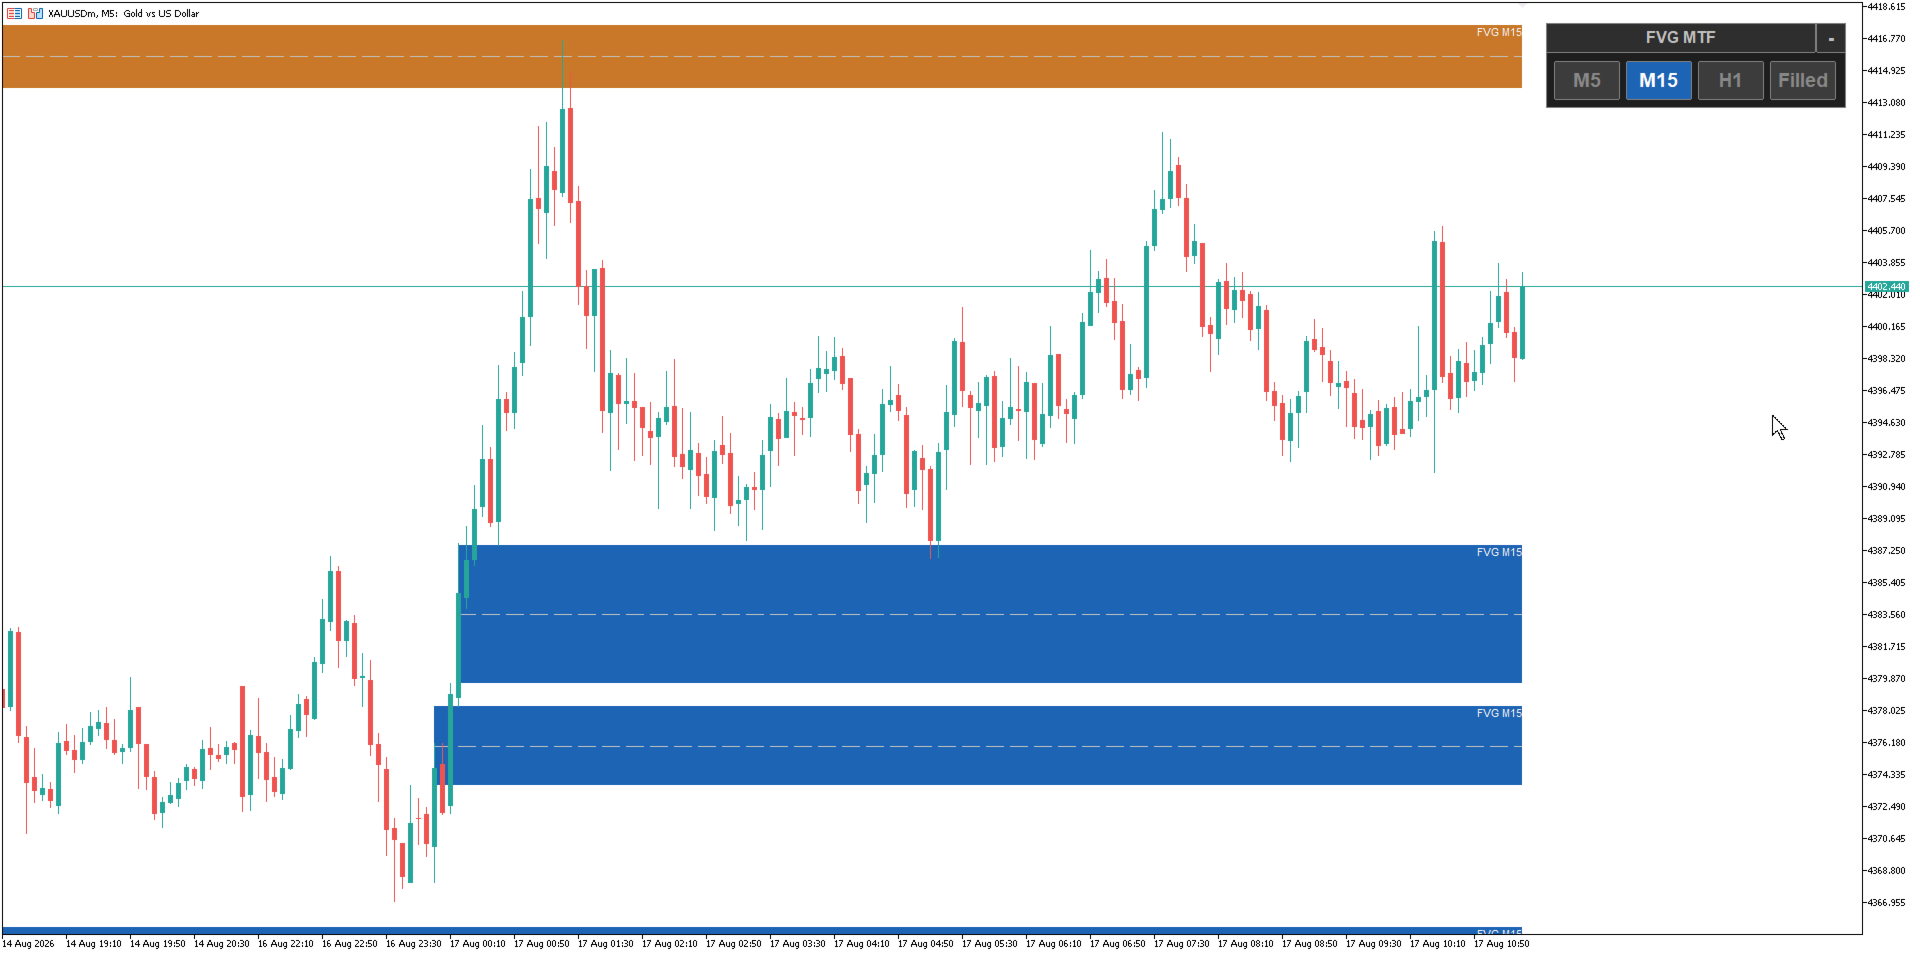
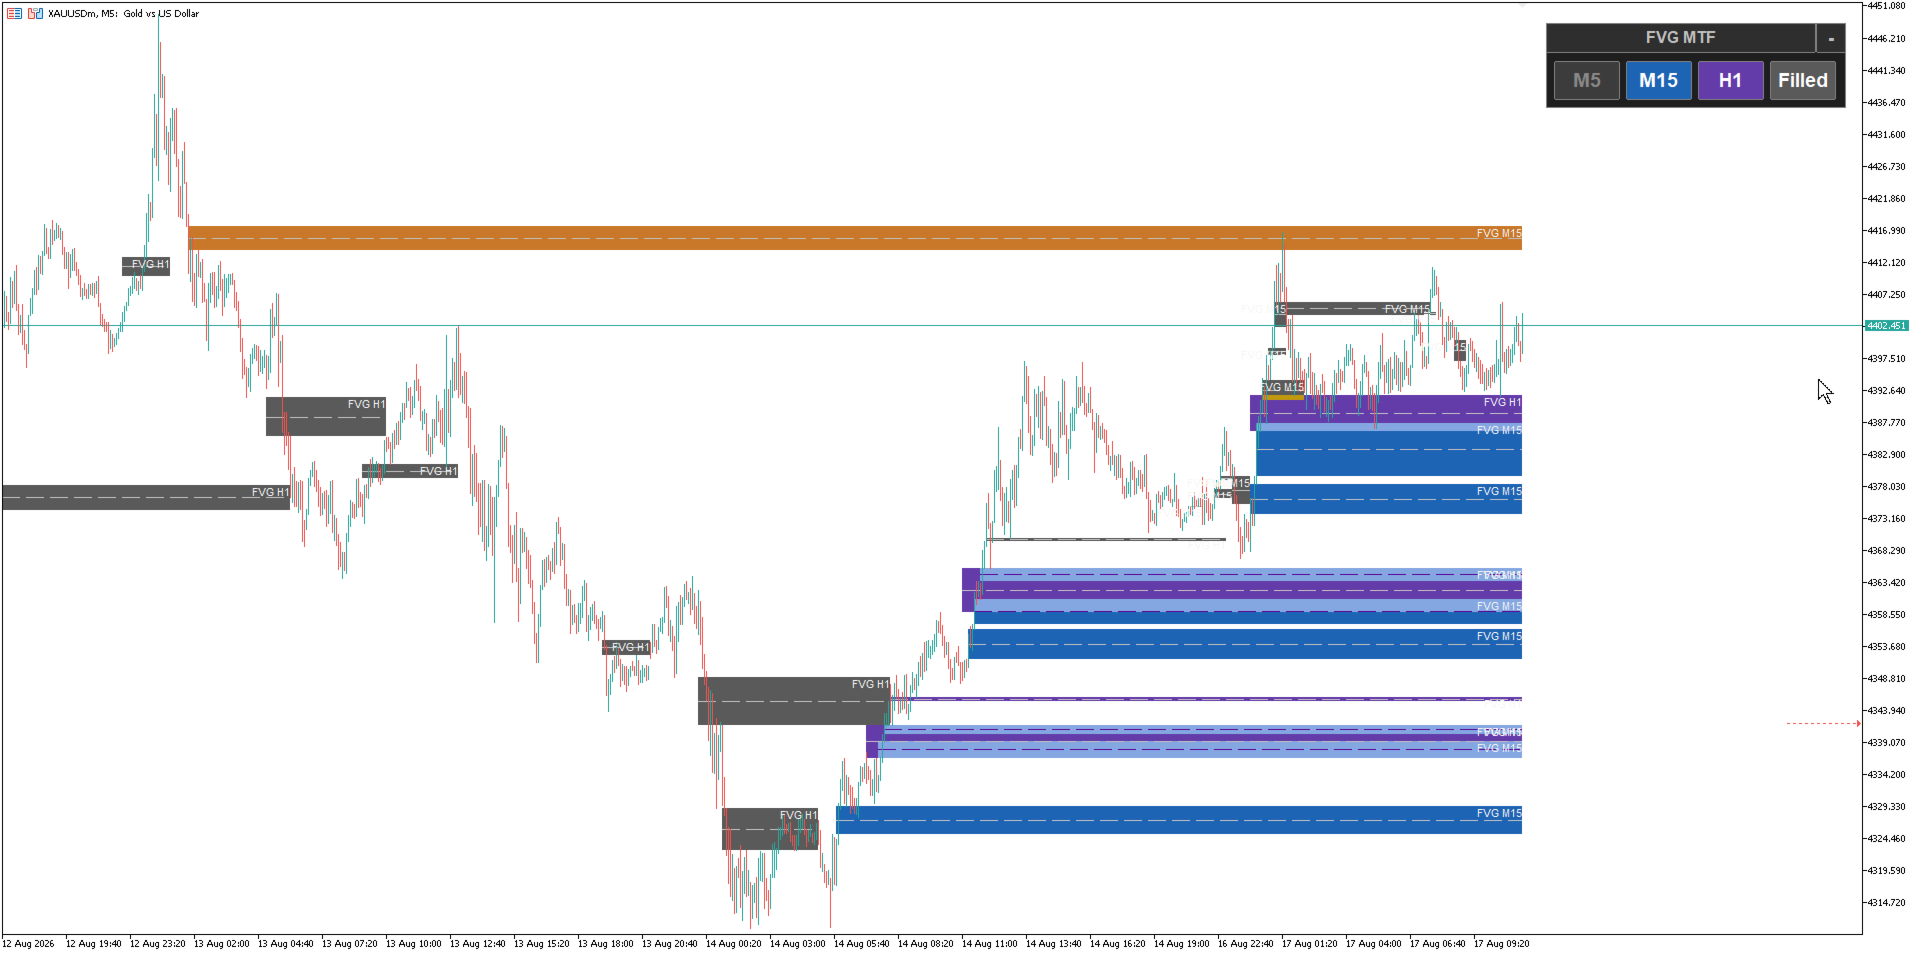
This indicator detects Fair Value Gaps (FVG) and draws them as zones on your chart, from up to three timeframes at the same time - the chart timeframe plus two higher timeframes of your choice. Each timeframe set has its own colours and label, so you always know which timeframe a zone came from.
Key Features
- Detects bullish and bearish FVG zones on the current timeframe plus two higher timeframes, all shown on one chart.
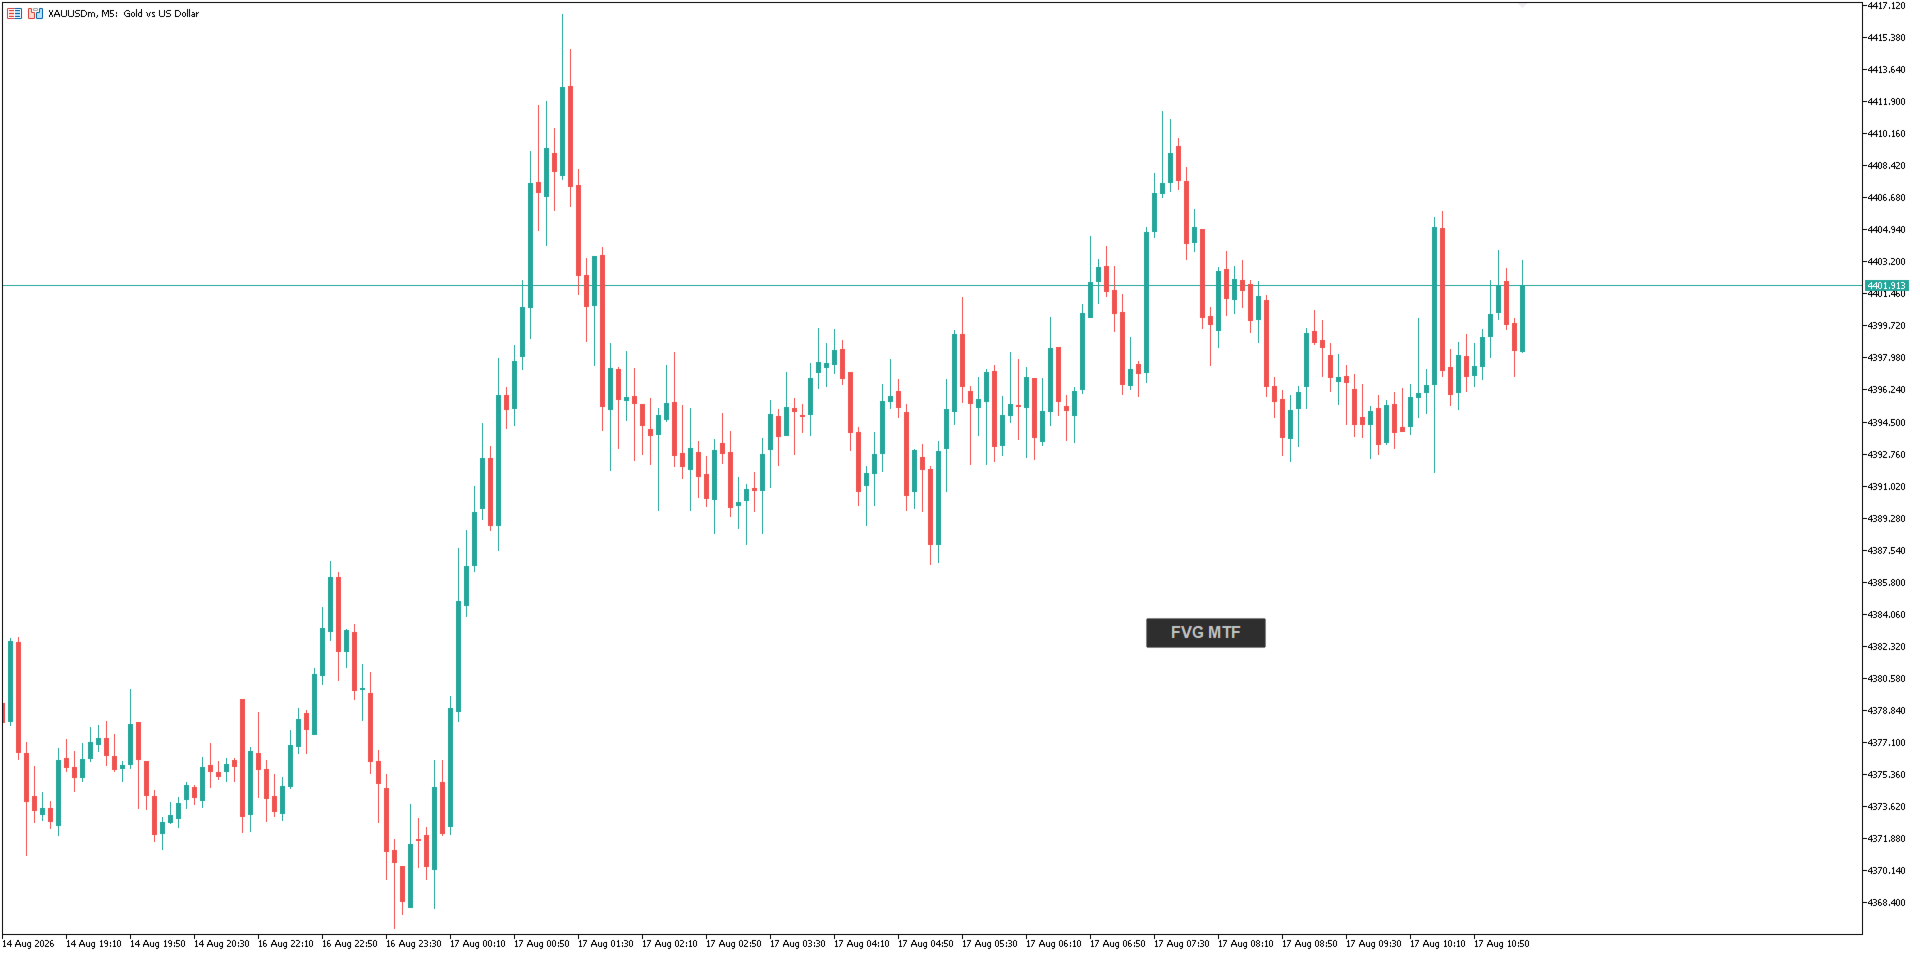
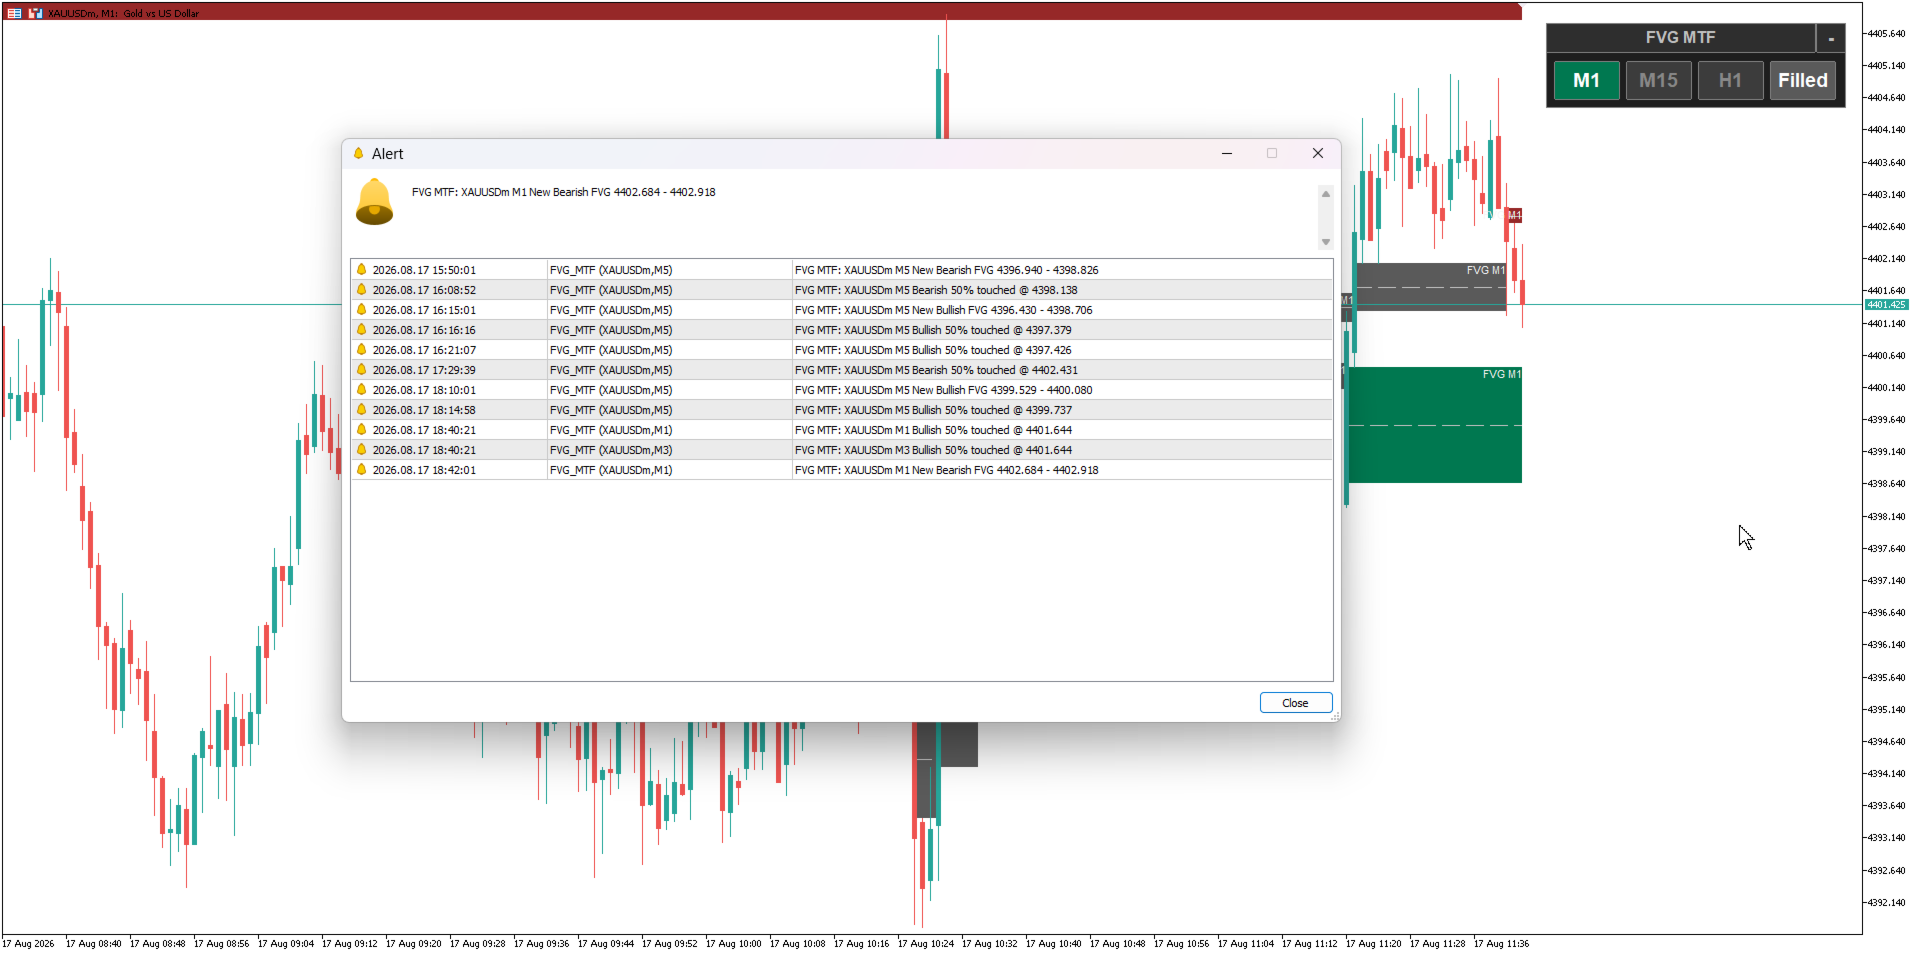
- Small control panel on the chart with one button per timeframe and a Filled button - show or hide any set with one click, without opening the settings.
- The panel can be dragged anywhere, minimized to a small bar, and its position, view mode and button states are kept when you switch timeframe.
- Two fill criteria: Full (price passes through the entire zone) or CE (price reaches 50% of the zone).
- Filled zones turn grey (or can be hidden), so unfilled zones stand out.
- Dashed 50% midline (Consequent Encroachment) in every zone, with adjustable colour.
- Minimum zone size filter removes small gaps that would clutter the chart.
- Separate display limits for unfilled and filled zones per timeframe.
- Zone labels show the source timeframe (for example "FVG H1"), or your own custom text, positioned left or right.
- Alerts: when a new FVG forms, and when price touches the 50% line of an unfilled zone. Channels: popup, push notification to mobile, sound.
- The 50% touch alert has a re-arm distance: after a touch it stays quiet until price moves away from the line by a set percentage of the zone height, then it can alert again on the next touch. Maximum one alert per bar per zone.
- Panel scale input for high resolution displays.
- Works on any symbol and any timeframe.
How It Works
A Fair Value Gap is a three candle pattern where the middle candle moves so strongly that a price gap is left between the first and third candle: a bullish FVG when the low of the third candle stays above the high of the first, and a bearish FVG when the high of the third candle stays below the low of the first. The indicator scans each selected timeframe, draws every gap as a rectangle with its 50% midline, and extends unfilled zones up to the current price. When price comes back and fills a zone according to the chosen criteria, the zone turns grey and stops at the filling bar. Higher timeframe sets must be equal to or higher than the chart timeframe; a set below the chart timeframe is hidden and a note is shown on the chart.
Input Parameters
Detection
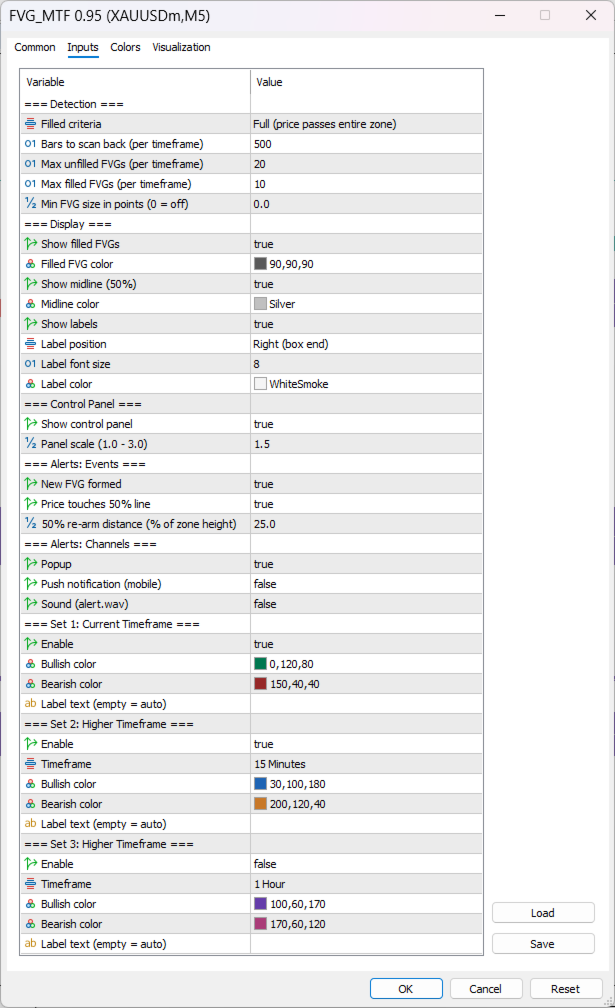
- Filled criteria - Full (entire zone) or CE (50% of the zone).
- Bars to scan back - history depth per timeframe.
- Max unfilled / Max filled FVGs - display limits per timeframe.
- Min FVG size in points - zones smaller than this are ignored (0 = off).
Display
- Show filled FVGs and Filled FVG color.
- Show midline (50%) and Midline color.
- Show labels, Label position (left / right), Label font size, Label color.
Control Panel
- Show control panel and Panel scale (1.0 - 3.0).
Alerts
- New FVG formed - alert when a new gap appears on any enabled timeframe.
- Price touches 50% line - alert on touch of the midline of an unfilled zone.
- 50% re-arm distance - percent of zone height price must retreat before the same zone can alert again.
- Channels - popup, push notification (mobile), sound.
Set 1 (current timeframe), Set 2 and Set 3 (higher timeframes)
- Enable, Timeframe (sets 2 and 3), Bullish color, Bearish color, Label text (empty = automatic).
Notes
This is a visual analysis tool. It does not send trading signals or open orders.