Fair Value Gap Zones Multi Timeframe

FVG Zones MTF

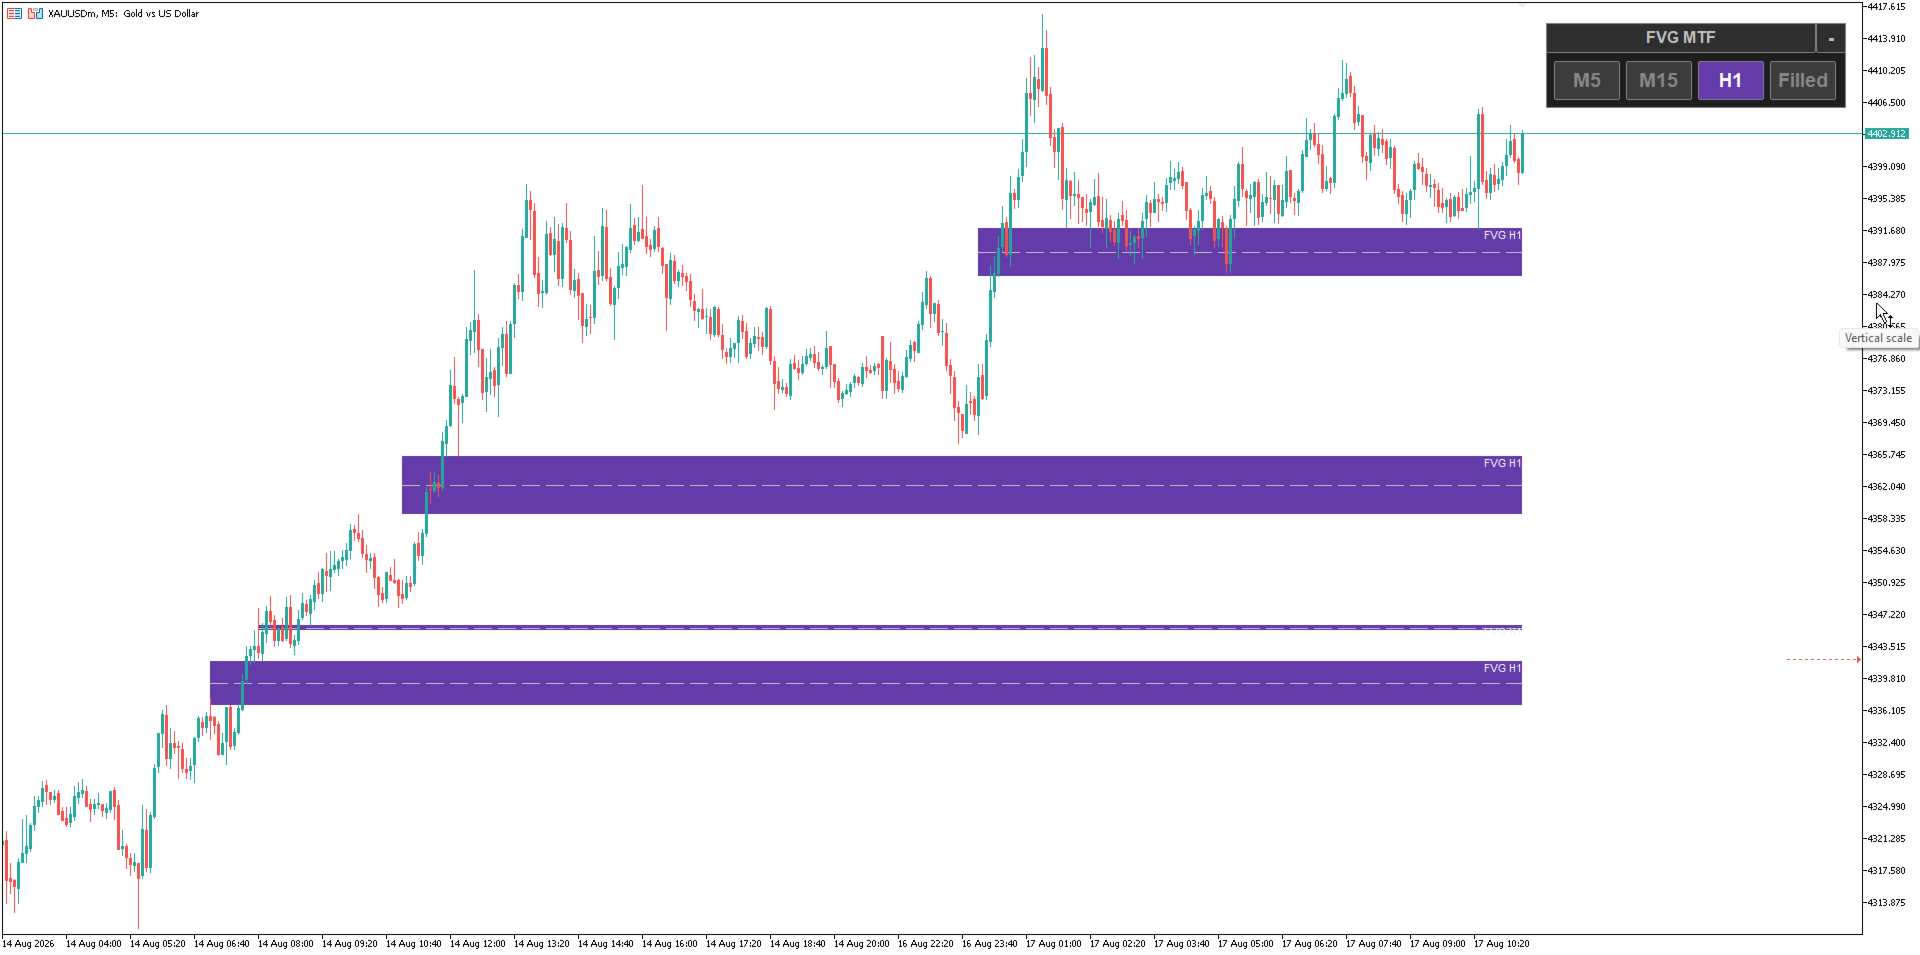
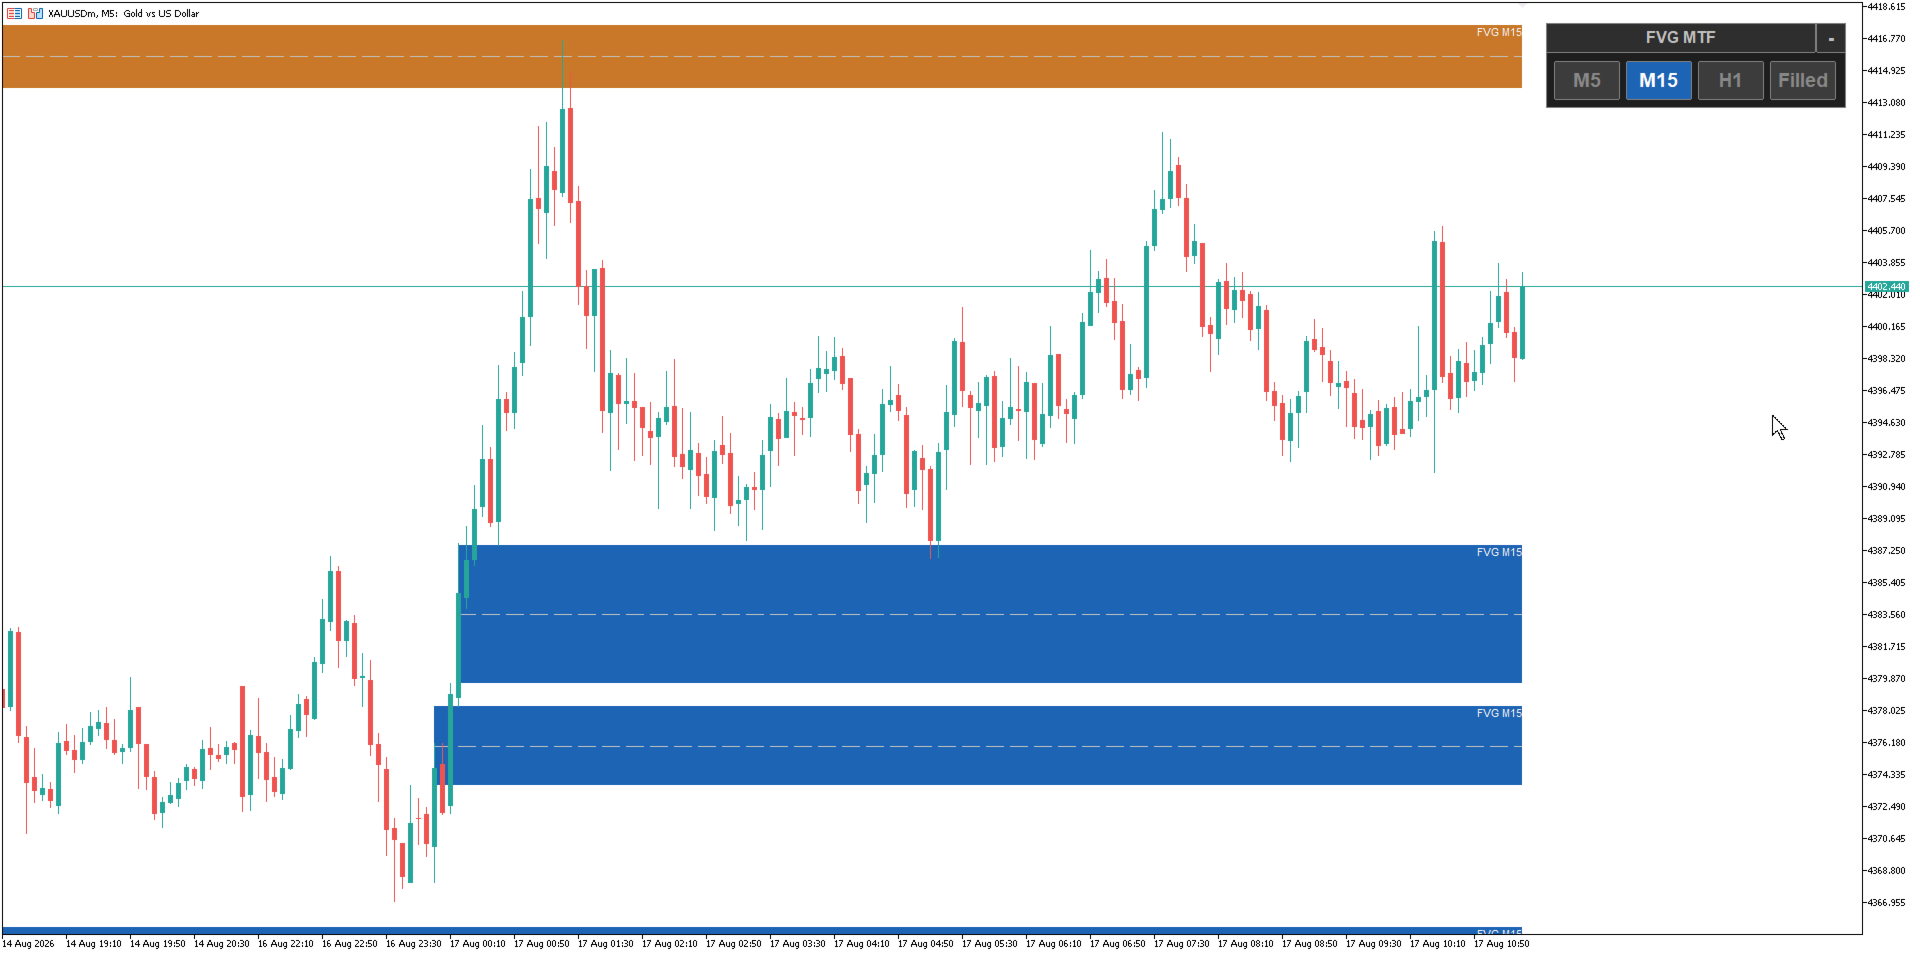
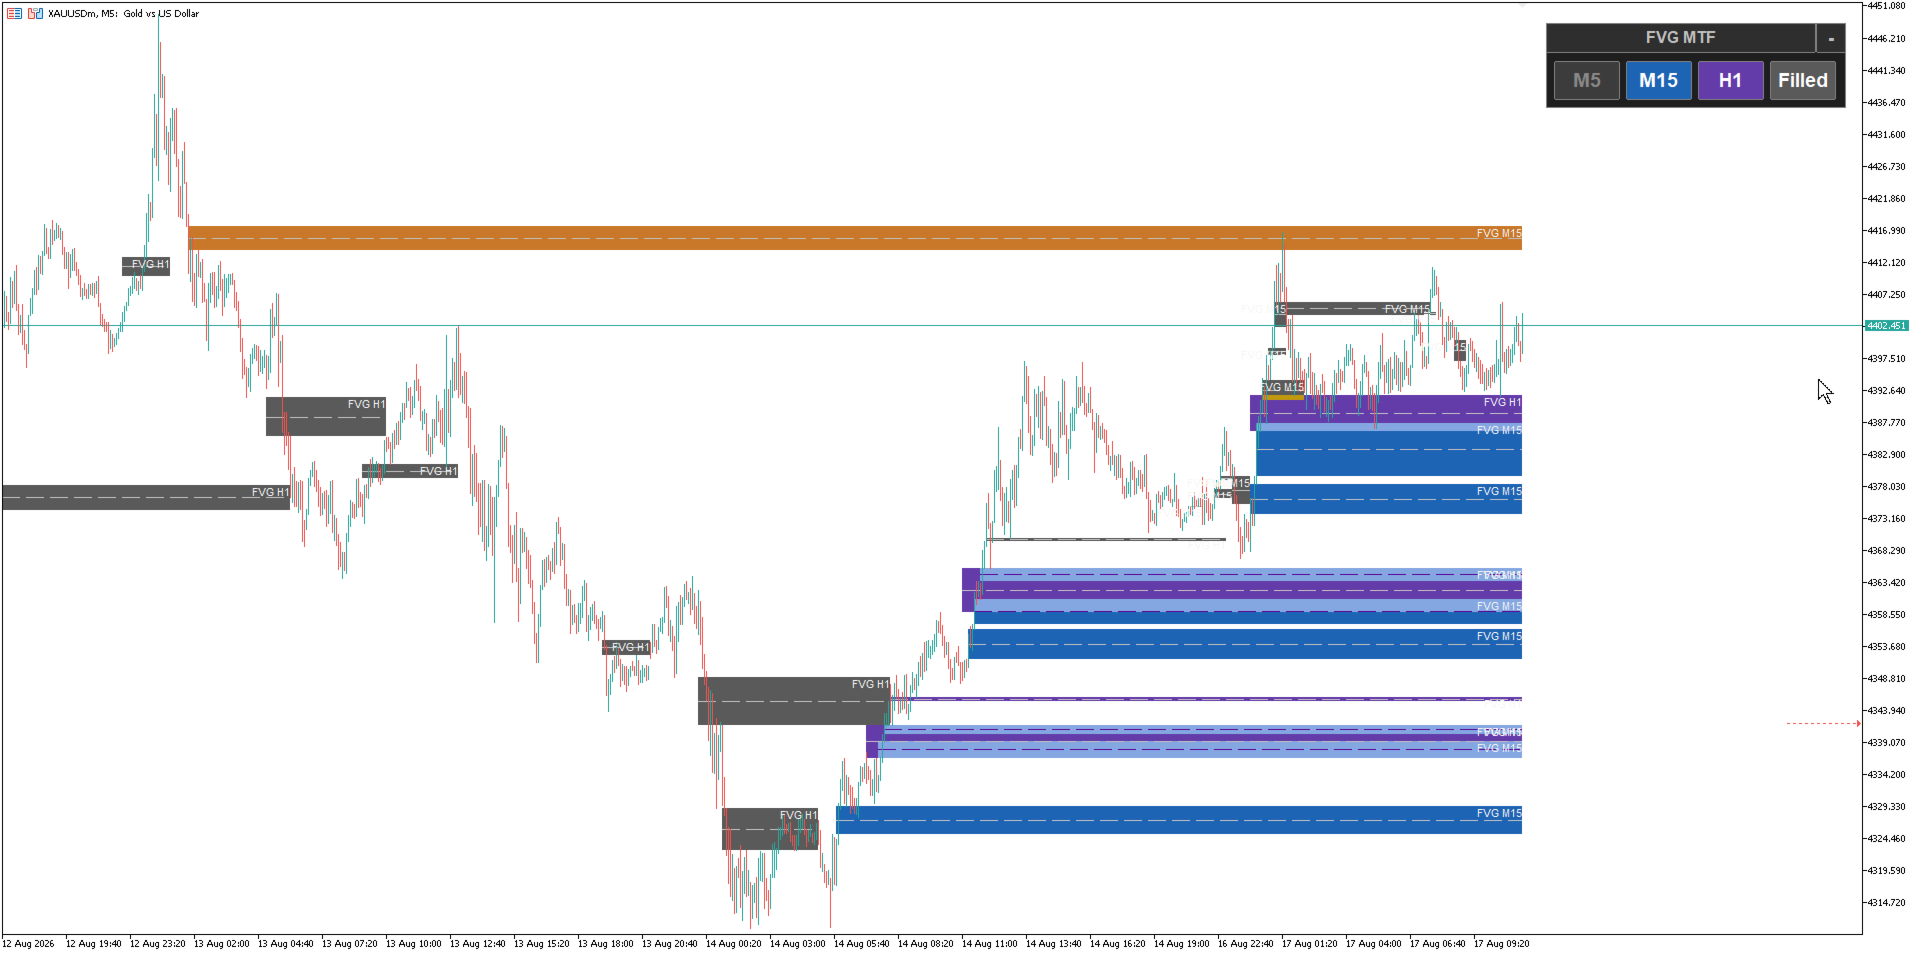
This indicator detects Fair Value Gaps (FVG) and draws them as zones on your chart, from up to three timeframes at the same time - the chart timeframe plus two higher timeframes of your choice. Each timeframe set has its own colours and label, so you always know which timeframe a zone came from.

Key Features

  • Detects bullish and bearish FVG zones on the current timeframe plus two higher timeframes, all shown on one chart.
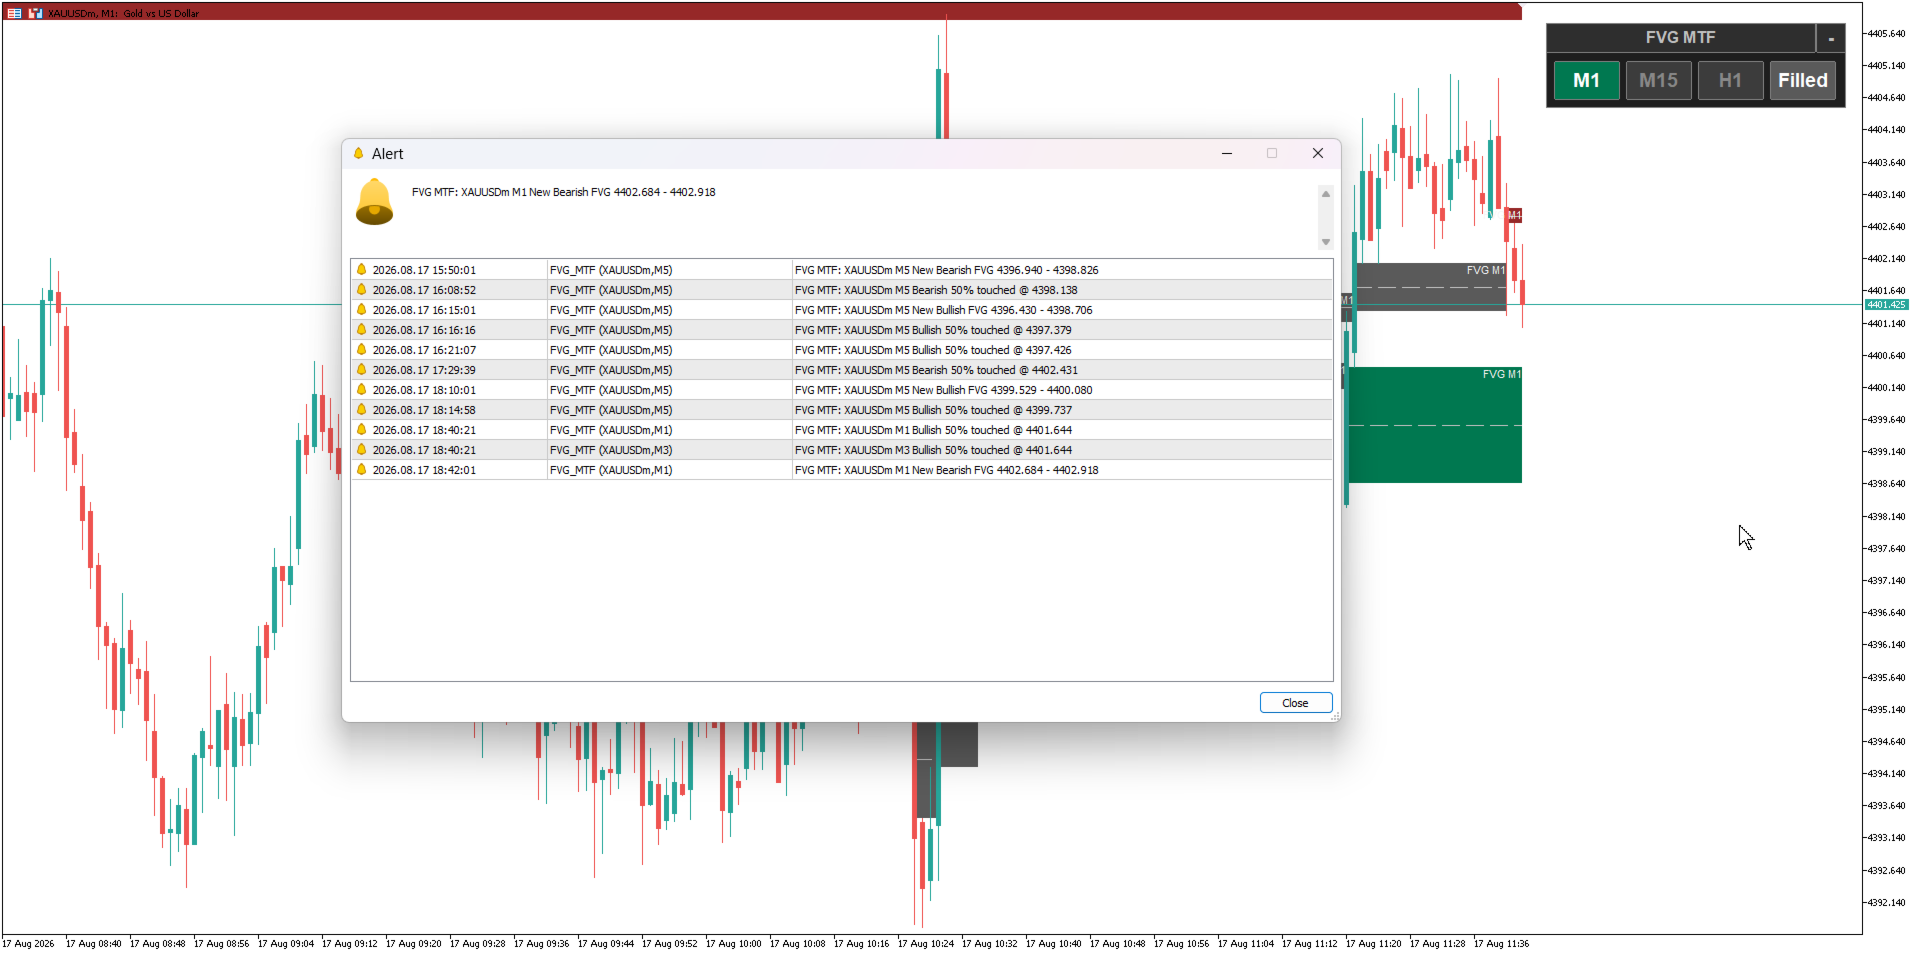
  • Small control panel on the chart with one button per timeframe and a Filled button - show or hide any set with one click, without opening the settings.
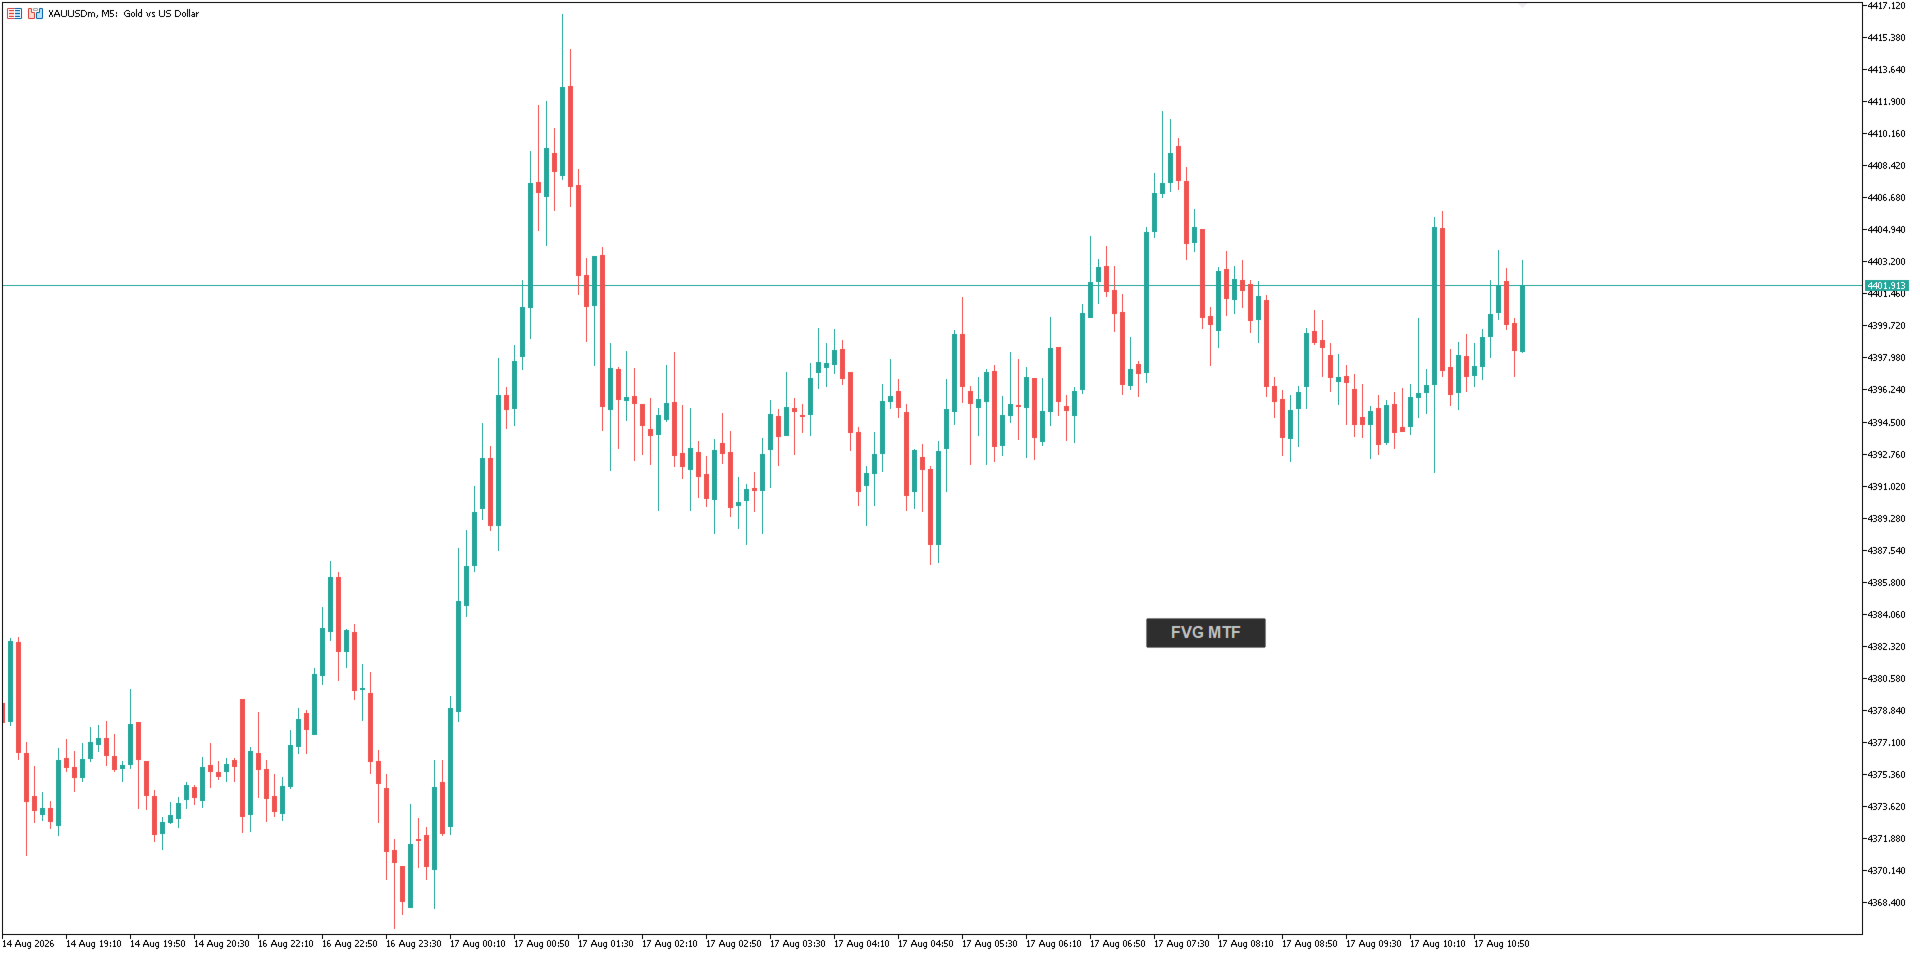
  • The panel can be dragged anywhere, minimized to a small bar, and its position, view mode and button states are kept when you switch timeframe.
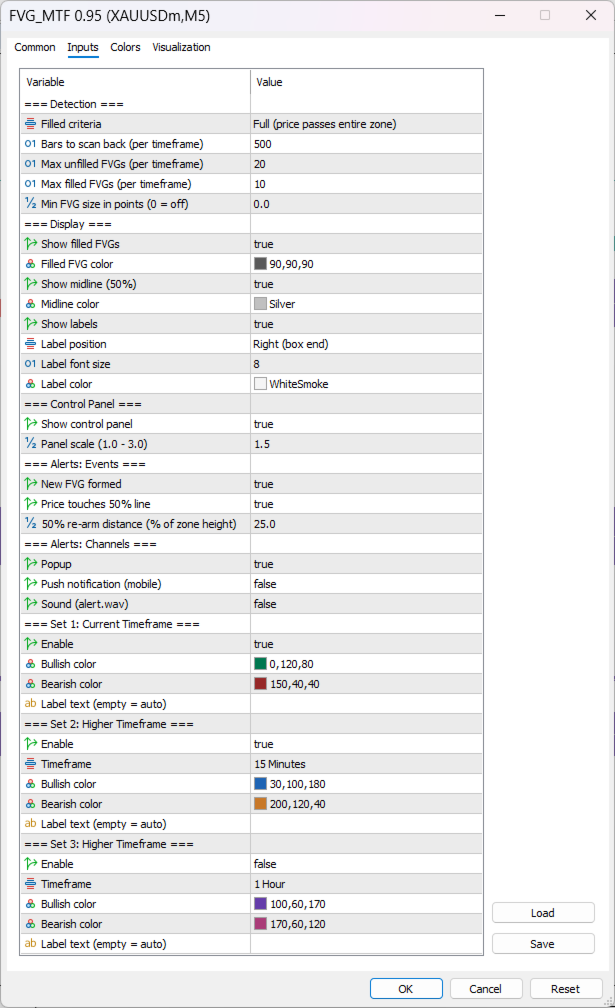
  • Two fill criteria: Full (price passes through the entire zone) or CE (price reaches 50% of the zone).
  • Filled zones turn grey (or can be hidden), so unfilled zones stand out.
  • Dashed 50% midline (Consequent Encroachment) in every zone, with adjustable colour.
  • Minimum zone size filter removes small gaps that would clutter the chart.
  • Separate display limits for unfilled and filled zones per timeframe.
  • Zone labels show the source timeframe (for example "FVG H1"), or your own custom text, positioned left or right.
  • Alerts: when a new FVG forms, and when price touches the 50% line of an unfilled zone. Channels: popup, push notification to mobile, sound.
  • The 50% touch alert has a re-arm distance: after a touch it stays quiet until price moves away from the line by a set percentage of the zone height, then it can alert again on the next touch. Maximum one alert per bar per zone.
  • Panel scale input for high resolution displays.
  • Works on any symbol and any timeframe.

How It Works

A Fair Value Gap is a three candle pattern where the middle candle moves so strongly that a price gap is left between the first and third candle: a bullish FVG when the low of the third candle stays above the high of the first, and a bearish FVG when the high of the third candle stays below the low of the first. The indicator scans each selected timeframe, draws every gap as a rectangle with its 50% midline, and extends unfilled zones up to the current price. When price comes back and fills a zone according to the chosen criteria, the zone turns grey and stops at the filling bar. Higher timeframe sets must be equal to or higher than the chart timeframe; a set below the chart timeframe is hidden and a note is shown on the chart.

Input Parameters

Detection

  • Filled criteria - Full (entire zone) or CE (50% of the zone).
  • Bars to scan back - history depth per timeframe.
  • Max unfilled / Max filled FVGs - display limits per timeframe.
  • Min FVG size in points - zones smaller than this are ignored (0 = off).

Display

  • Show filled FVGs and Filled FVG color.
  • Show midline (50%) and Midline color.
  • Show labels, Label position (left / right), Label font size, Label color.

Control Panel

  • Show control panel and Panel scale (1.0 - 3.0).

Alerts

  • New FVG formed - alert when a new gap appears on any enabled timeframe.
  • Price touches 50% line - alert on touch of the midline of an unfilled zone.
  • 50% re-arm distance - percent of zone height price must retreat before the same zone can alert again.
  • Channels - popup, push notification (mobile), sound.

Set 1 (current timeframe), Set 2 and Set 3 (higher timeframes)

  • Enable, Timeframe (sets 2 and 3), Bullish color, Bearish color, Label text (empty = automatic).

Notes

This is a visual analysis tool. It does not send trading signals or open orders.

추천 제품
All in One Multi Indicator
Teerathad Booranawisedkul
Overview Comprehensive technical analysis indicator combining 20+ essential trading tools in a single chart display. Moving Averages EMA (Exponential Moving Average): 9, 21, 50, 200 periods SMA (Simple Moving Average): configurable period Customizable colors and line widths Price position indicators (above/below) Oscillators & Momentum RSI (Relative Strength Index): adjustable overbought/oversold levels MACD (Moving Average Convergence Divergence): customizable fast/slow/signal periods Stochasti
Candle Timer Zakirulbd
Mohammad Zakirul Haque
Zakirulbd Candle Timer V7   Professional trader utilities. Minimal design. Maximum clarity. Zakirulbd Candle Timer V7 is a professional MT5 indicator designed to display the remaining time of the current candle directly on your chart in a clean, distraction-free format. One of the most common frustrations among traders is not knowing exactly how much time remains before a candle closes. Many traders moving from other platforms actively look for a reliable candle countdown timer before fully ado
FREE
Analista de Tendencia
Juan Guillermo Marulanda Mesa
El Analista de Tendencia es un indicador para MetaTrader 5 que combina análisis técnico con un enfoque estadístico adicional. Su función es mostrar de manera sencilla la dirección del mercado y evaluar la consistencia de cada movimiento de precio. En la práctica, esto significa que el indicador no solo dibuja líneas o colores, sino que interpreta el comportamiento del precio desde distintos ángulos. Por un lado, utiliza herramientas técnicas como las medias móviles exponenciales y el ADX para d
Multiple TimeFrame MACD Confluency Tool
Kelvin Souza Da Costa Oliveira
Multiple Timeframe MACD indicator. This indicator was built for making multiple timeframe analysis possible in MT5 using MACD Indicator. MACD Indicator traditionally shows two lines and one histogram. MACD Line(Yellow) is calculated by subtracting 12period EMA(fast) from 26period EMA (slow). Signal Line(Blue) is created by a 9period EMA from MACD Line. Histogram is just the difference between MACD and Signal lines. Histogram is colored based on the difference between its value and the previous h
Optimized Trend Tracker OTT
Mohammad Taher Halimi Tabrizi
Optimized Trend Tracker (OTT) Indicator The Optimized Trend Tracker (OTT) is a custom indicator designed to visualize trend direction and potential changes based on a configurable moving average and dynamic support/resistance levels. It provides multiple visualization and signal options, making it suitable for discretionary analysis or integration into automated systems. Key Features Configurable Moving Average Types Supports SMA, EMA, WMA, TMA, VAR, WWMA, ZLEMA, and TSF for flexible calculatio
SMC Structural Edge
Daniel Mukururo Muthee
Institutional Grade Price Action Engine SMC Structural Edge is a high-performance trading tool built for traders who demand precision and professional risk management. This EA moves away from traditional lagging indicators, focusing instead on market structure shifts and institutional liquidity zones . Designed to identify high-probability turning points, SMC Structural Edge automates the heavy lifting of chart analysis while leaving the final strategic control in your hands through its intuitiv
Cybertrade Auto Fibonacci
Emanuel Andriato
4.9 (10)
Cybertrade Auto Fibonacci retraction and projection  - MT5 Auto Fibonacci is an indicator that automatically plots the Fibonacci retracement and projection based on the number of bars you select in the indicator setting. You can customize nine different levels of retraction and three levels of projection. It works on periods longer than the period visible on the chart. All values ​​are available in the form of buffers to simplify possible automations. This indicator is the same one we use in ou
FREE
Multi Divergence MT5을 소개합니다. 이는 여러 지표에서 발산을 감지하여 시장 분석을 향상시키도록 설계된 고급 거래 지표입니다. 이 도구는 가격 추세에서 잠재적인 반전 및 지속을 식별하여 진입 및 퇴출 전략을 개선하려는 트레이더에게 이상적입니다. Multi Divergence MT5을 사용하면 시장 모멘텀의 변화를 나타내는 발산 신호를 신속하게 해석하여 거래에서 상당한 우위를 점할 수 있습니다. 경험이 풍부한 트레이더든 이제 막 시작하는 트레이더든, 이 지표는 실시간 시장 상황에서 정보에 기반한 결정을 내리는 데 도움이 되는 귀중한 통찰력을 제공합니다. MQL 제품 설치 가이드 | MT4/MT5에서 구매한 MQL 제품 업데이트 | 일반 문제 해결 가이드 | 지표 설정 / 가이드 주요 기능 다양한 지표 지원: RSI, CCI, MACD 등 다양한 지표를 활용하여 시장 모멘텀을 측정합니다. 매수/매도 신호 트리거: 발산 조건에 따라 명확한 신호를 생성하여 트레이더가 잠재적
Perfect Entry planer
Israr Hussain Shah
Key Features Visual Risk/Reward Planning Spawns interactive rectangles on the chart for Buy and Sell setups. Pink Box:   Represents your Risk (Entry to Stop Loss). Green Box:   Represents your Reward (Entry to Take Profit). The Green box automatically adjusts its size based on your preferred Reward Ratio (e.g., 1:2). Auto-Lot Calculation Automatically calculates the correct   Lot Size   based on your Account Balance and defined Risk Percentage. Takes into account the symbol's Tick Value and Cont
HiLo Activator Plus
Rodrigo Galeote
5 (1)
HiLo Activator is one of the most used indicators to determine trend. Find it here with the ability to customize period and colors. This indicator also plots up and down arrows when there is a change on the trend, indicating very strong entry and exit points. HiLo fits well to different types of periods for day trading. You can easily understand when it is time to buy or sell. It works pretty good also for other periods like daily and monthly signalizing long-term trends. The use of the indicato
YENFORGE USDJPY v1.10 Adaptive Fusion 5 YENFORGE USDJPY is a discretionary signal indicator for MetaTrader 5. It evaluates confirmed M5 and M15 bars and displays BUY/SELL candidates together with reference target, stop and time-exit levels. This product is designed and validated primarily for Japanese traders using USDJPY data from the OANDA Japan MT5 Tokyo server. It can start on other broker feeds, but signal timing, prices, spread filtering and historical reconstruction may differ. The interf
Elliott Wave MT5
Sathit Sukhirun
5 (1)
자동 엘리어트 파동 이론 (Automated Elliott Wave) 1. 자동 파동 카운팅 및 편향 감소 (객관성) 보통 엘리어트 파동 카운팅은 개인적인 "상상"이나 주관이 많이 개입됩니다. 이 보조지표는 다음과 같이 도와줍니다: 충격 파동(Impulse Wave 1-2-3-4-5) 탐지: 엄격한 규칙(예: 3파는 가장 짧을 수 없음, 4파는 1파와 겹칠 수 없음)을 사용하여 이론적으로 정확한 가격 구조를 보여줍니다. 조정 파동(Corrective Wave A-B-C) 탐지: 추세에 따라 재진입할 기회를 찾기 위해 가격 조정 구간을 포착합니다. 2. 다중 등급 분석 (Multi-Degree Analysis) 하나의 시간 프레임만 보는 것이 아니라 3가지 깊이 수준을 동시에 분석하여 시장을 입체적으로 보여줍니다: Minor (단기): 빠른 움직임 확인용. Intermediate (중기): 주요 추세 확인용. Primary (장기): 시장의 큰 흐름 확인용. 장점: 트레이딩 스
Anchored Linear Regression Channel
Jorge Adalberto Do Valle Junior
English: Anchored Linear Regression Channel (ALRC) Description: The Anchored Linear Regression Channel (ALRC) is an advanced technical analysis tool that enhances the traditional linear regression channel by allowing it to be anchored to a confirmed pivot point. This provides a more accurate and reliable reading of price behavior in relation to key structural points on the chart. Key Features: Anchoring to Confirmed Pivots: Manually select a significant pivot to fix the channel, ensuring t
FibExtender
Syed Oarasul Islam
This Indicator draws Fibonacci Extension levels in two different ways. You can select whether to draw Fibonacci Extension levels based on your favourite ZigZag settings or you can let the indicator to draw Fibonacci Extension  level based on given number of Bars or Candles.  You can also set Mobile and Email notification for your favourite Extension  levels individually. With this indicator you will not have to feel lonely as the it can generate Voice alerts, which will keep you focused on your
Indicator MA ATR channel
Alexey Smirnov
5 (1)
I present the well-known Moving Average indicator connected to the ATR indicator. This indicator is presented as a channel, where the upper and lower lines are equidistant from the main line by the value of the ATR indicator. The indicator is easy to use. The basic settings of the moving average have been saved, plus the settings for the ATR have been added. Moving Average Parameters: MA period Shift MA Method Moving Average Parameters: ATR TF - from which timeframe the values are taken A
FREE
Probability Advanced Indicator
Dioney De Jesus Batista Alves
ProbabilityAdvancedIndicator 는 스캘핑(scalping) 및 데이 트레이딩(day trading)을 위해 설계된 정교한 트렌드 확률 분석 도구입니다. 여러 기술 지표와 다중 시간대 분석을 결합하여 매수/매매 확률을 시각적으로 명확하게 표시합니다. ProbabilityAdvancedIndicator 는 다음과 같은 트레이더를 위한 종합 솔루션입니다: 확률 기반 의사 결정 통합 기술 분석 다양한 트레이딩 스타일 적용 가능 직관적이고 사용자 정의 가능한 인터페이스 전문가 팁:   특히 지지/저항 구역에서 신호 확인률을 높이려면 가격 행동 분석(price action)과 함께 사용하는 것이 효과적입니다. (참고: '스캘핑'과 '데이 트레이딩'은 한국어로도 동일한 용어로 통용됩니다)
GDS Renko Entry Helper - Free Renko Price Interaction Indicator for MetaTrader 5 GDS Renko Entry Helper is a free Renko price interaction indicator for MetaTrader 5. It helps traders highlight important areas where price reacts, slows down, returns to a zone or changes behavior around support and resistance. The tool is designed for manual Renko analysis. It does not generate buy or sell signals and does not tell the trader when to enter the market. Its purpose is to help focus attention on area
Quantum Trend Monitor Indicator for MT5
QUANTUM TRADING SOFTWARE LIMITED
Currency pairs never go up or down in a straight line. They rise and fall constantly, creating pullbacks and reversals. And with each rise and fall, so your emotions rise and fall. Hope, then fear, then hope. This is when the market will try to frighten you out of a strong position. It is when you are most vulnerable. But not if you have the Quantum Trend Monitor. And here, you even get two indicators for the price of one! The Quantum Trend Monitor has been designed to absorb these temporary pau
Pattern Trader No Repaint Indicator MT5 Version Indicator searches for 123 Pattern, 1234 Pattern, Double Top, Double Bottom Patterns , Head and Shoulders, Inverse Head and Shoulders, ZigZag 1.618 and Father Bat Pattern. Pattern Trader indicator uses Zig Zag Indicator and Improved Fractals to determine the patterns. Targets and Stop Loss Levels are defined by Fibonacci calculations.  Those levels must be taken as a recommendation. The trader may use different tools like Moving Avarages,
ICT Enter Here Pro
Nawal Kishor Yadav
ICT Enter Here V1.1 — 깔끔하고 간단한 ICT 신호 초보자도 쉽게 사용할 수 있는 전문 ICT 인디케이터입니다. 차트를 복잡하게 만들지 않고 명확한 매매 신호를 제공합니다. 주요 기능: Order Block 숨김 — 오더블록 구역을 자동으로 숨겨 차트를 깔끔하게 유지합니다. 명확한 매수・매도 화살표: 녹색 화살표 = 매수(BUY) 신호 ("Enter Here") 빨간색 화살표 = 매도(SELL) 신호 ("Enter Here") 유동성 스위프 신호 (SSL/BSL) — 가격이 고점이나 저점을 쓸어갈 때 강력한 "Enter Here (LS)" 화살표 표시. 강・약 Order Block 화살표 — 녹색은 상승 OB, 빨간색은 하락 OB. 자동 손절점 표시 — 추천 SL(스탑로스) 위치를 명확하게 보여줍니다. 트레이드 추적 라인 — 진입부터 청산까지 경로와 손익을 표시. 실시간 대시보드 — 현재 신호, 진입 가격, SL, 거래 상태를 한눈에 확인. 실시간 손익(P&L) 표시
FREE
Weis Wave Volume Indicator for MT5
Mohammad Taher Halimi Tabrizi
Weis Wave Volume Indicator for MetaTrader 5 (MT5) Check all of our products here: All Products Specifications Platform: MetaTrader 5 (MT5) Type: Custom Technical Trading Indicator Level: Intermediate Timeframes: All Timeframes (Multi-Timeframe Support) Trading Styles: Scalping, Day Trading, Swing Trading, Position Trading Markets: Forex, Stocks, Commodities, Indices, and Cryptocurrencies What Does This Indicator Do? The Weis Wave Volume Indicator for MT5 is a powerful Price Action + V
Three Dragons Genestra
Renato Genestra Martins
The THREE DRAGONS is a technical indicator that portrays three mystical Chinese dragons flying through the price chart: 1. The Green Dragon (SeaGreen): - The most agile and fastest of the three - Reacts quickly to market direction changes - Usually leads the movements 2. The Red Dragon (Tomato): - Moves with balance between speed and caution - Confirms movements initiated by the Green Dragon - Its interactions with the Green Dragon may indicate opportunities 3. The Black Dragon (Black): - Th
FREE
Contact me for instruction, any questions! Introduction V Bottoms and Tops  (or Fibonacci Retracement)  are popular   chart patterns   among traders due to their potential for identifying trend reversals. These patterns are characterized by sharp and sudden price movements, creating a V-shaped or inverted V-shaped formation on the   chart . By recognizing these patterns, traders can anticipate potential shifts in market direction and position themselves accordingly.  V pattern is a powerful bul
Multi Timeframe Chart
Bekono Owona Roger Blaise
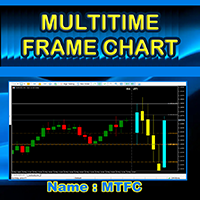
MTFC (Multi Timeframe Chart) – See 2 Timeframes on ONE Chart! "Trade Smarter, Not Harder – Eliminate Timeframe Switching Forever!" Imagine having the power to see any higher timeframe (M5, M15, H1, H4, D1, MN1, etc.) directly on your current chart.   No more flipping between charts, no more guesswork—just   pure trading clarity   in one place. That’s exactly what the   MTFC Indicator   delivers! 1. The Problem It Solves As traders, we know   context is king . But constantly switching between c
Dynamic Trend Visualizer: Momentum and Direction Indicator The Dynamic Trend Visualizer is an advanced flow analysis tool designed to translate the complexity of price movements into a clear and objective visual map. Through an internal trend-tracking algorithm, the indicator continuously scans price action and identifies who is in control of the market — bulls, bears, or indecision. Instead of cluttering your chart with lines and oscillators, it directly colors the candles in real-time, allowin
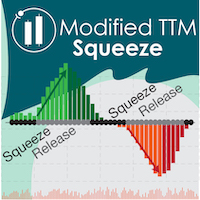
"The Squeeze indicator attempts to identify periods of consolidation in a market. In general the market is either in a period of quiet consolidation or vertical price discovery. By identifying these calm periods, we have a better opportunity of getting into trades with the potential for larger moves. Once a market enters into a "squeeze," we watch the overall market momentum to help forecast the market direction and await a release of market energy." The Modified TTM Squeeze Indicator is a modi
Matrix indicator for MT5 by ITC
Renaud Herve Francois Candel
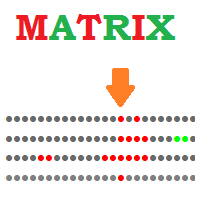
Matrix Indicator Matrix Indicator is a simple but effective indicator. Matrix indicator displays usual oscillators indicators in a user friendly color coded indicator. This makes it easy to identify when all indicators are aligned and spot high probability entries. Inputs of indicator are: Indicator: RSI, Stochastic, CCI, Bollinger Bands Param1/Param2/Param3: usual settings for the indicator ValueMin: Oversold level for oscillator ValueMax: Overbought level for oscillator The indicator can
This indicator is based on a classic  DeMarker indicator. Multi TimeFrame indicator MTF-DeMarker shows data from the 4 timeframes by your choice. By default this indicator has external parameters: TF1 = 1; TimeFrame2b = true; TF2 = 5; TimeFrame3b = true; TF3 = 15; TimeFrame4b = true; TF4 = 60; InpPeriod = 14; You can change TF1-TF4 in the next limits: TF1 from M1 (1) to H4 (240) TF2 from M5 (5) to D1 (1440) TF3 from M15 (15) to W1 (10080) TF4 from M30 (30) to MN1 (43200) All chosen TFs should be
Elliott Wave Trend MT5
Young Ho Seo
4 (4)
Elliott Wave Trend was designed for the scientific wave counting. This tool focuses to get rid of the vagueness of the classic Elliott Wave Counting using the guideline from the template and pattern approach. In doing so, firstly Elliott Wave Trend offers the template for your wave counting. Secondly, it offers Wave Structural Score to assist to identify accurate wave formation. It offers both impulse wave Structural Score and corrective wave Structure Score. Structural Score is the rating to sh
Using ATR to judge the trend, the dotted line is a short-term trend, and the solid line is a stable trend Set different parameters according to different products. In most cases, please use the default parameters Time cycle 5 minutes 15 minutes 1 hour This indicator performs well in monetary products and gold Index without future function The entity part of the K line exceeds the entity trend part, which represents the trend conversion. Please wait for the K line to finish
이 제품의 구매자들이 또한 구매함
SMART TREND TRADING SYSTEM — 특별 혜택 트레이딩 시스템, 자동매매 EA, 교육과 지원을 하나로. MT5용 Smart Trend Trading System을 99 USD에 구매하고, 시스템의 신호를 자동매매에 활용할 수 있는 Smart Universal Expert Advisor를 무료로 받으세요 . STTS는 추세 방향, 진입·청산 신호, 반전 구간, 주요 가격 수준을 차트에 모아 보여줍니다. 시스템을 참고해 수동으로 거래하거나, 포함된 EA를 연결하여 선택한 설정에 따라 자동으로 거래를 실행할 수 있습니다. 현재 가격인 99 USD는 앞으로 이루어지는 30건의 구매에 적용됩니다. 이후 가격은 149 USD로 인상됩니다. 전체 패키지 구성 구매 시 다음 항목이 포함됩니다. • MT5용 Smart Trend Trading System. • Smart Universal Expert Advisor — 무료. • 전체 STTS PDF 사용자 설명서. • STTS
Trend Sniper X
Sarvarbek Abduvoxobov
4.9 (39)
Trend Sniper X 는 트레이더가 추세 방향과 잠재적 반전 지점을 명확하고 정확하게 포착할 수 있도록 도와주는 MetaTrader 5용 멀티 타임프레임 추세 추종 지표입니다. MT4용: https://www.mql5.com/en/market/product/193245 가격 정보: 현재 가격은 프로모션 할인가이며, 향후 업데이트 및 새로운 기능이 출시됨에 따라 변동될 수 있습니다. 보너스 혜택: 본 지표 전용 무료 자동매매 Assistant EA를 받으시려면 구매 후 작성자에게 메시지를 보내주시기 바랍니다. Code2Profit 채널 멀티 타임프레임 분석으로 시장을 마스터하세요! Trend Sniper X로 승률을 극대화하는 방법: 핵심 규칙 및 세션 팁 기술 사양 플랫폼 MetaTrader 5 지표 유형 멀티 타임프레임 추세 지표 운용 타임프레임 모든 차트 타임프레임 지원, 독립적으로 선택 가능한 상위 타임프레임(M1–MN1) 주요 상품 외환, 금(XAUUSD) 및 기타 C
ARIPoint
Temirlan Kdyrkhan
1 (4)
ARIPoint is a powerful trading companion designed to generate high-probability entry signals with dynamic TP/SL/DP levels based on volatility. Built-in performance tracking shows win/loss stats, PP1/PP2 hits, and success rates all updated live. Key Features: Buy/Sell signals with adaptive volatility bands Real-time TP/SL/DP levels based on ATR Built-in MA Filter with optional ATR/StdDev volatility Performance stats panel (Success, Profit/Loss, PP1/PP2) Alerts via popup, sound, push, or email Cu
SuperScalp Pro
Van Minh Nguyen
4.66 (35)
SuperScalp Pro - Professional Multi-Layer Confluence Scalping System SuperScalp Pro는 클래식 Supertrend에 여러 지능형 확인 필터를 추가한 고급 스캘핑 지표입니다. 더 높은 확률의 Buy/Sell 거래 기회를 식별하는 데 도움을 주며, 잘못된 신호를 크게 줄이는 데 도움을 줍니다. 명확한 Buy 및 Sell 화살표가 차트에 직접 표시되며, ATR 기반 Stop Loss 및 Take Profit 수준이 실시간으로 자동 계산됩니다. 구매 후 설정 방법 및 권장 구성에 대한 안내가 필요하시면 저에게 문의해 주세요. SuperScalp Pro Auto Trader를 사용하여 신호를 쉽게 자동화할 수 있습니다: [Auto Trader] 권장 설정 파일 다운로드: [Set File] 전체 문서는 제품 블로그에서 확인할 수 있습니다: [User Guide] 업데이트를 확인하려면 공식 채널에 참여하세요: [Official C
SMC Intraday Formula
VividMind Digital Solutions
5 (25)
먼저 솔직하게 말하겠습니다. 어떤 인디케이터도 단독으로 당신을 수익성 있게 만들어주지 않습니다. 누군가 그렇게 말한다면, 그는 당신에게 꿈을 파는 것입니다. 완벽한 매수/매도 화살표를 보여주는 모든 인디케이터는 완벽하게 보이도록 만들 수 있습니다 — 단지 올바른 과거 구간을 확대하고 승리한 거래만 캡처하면 됩니다. 우리는 그렇게 하지 않습니다.  SMC Intraday Formula는 도구입니다. 시장 구조를 읽고, 가장 높은 확률의 가격 구간을 표시하며, 현재 스마트 머니의 흐름이 어떻게 보이는지 아주 단순한 언어로 보여줍니다. 최종 결정은 여전히 당신이 합니다. 실행도 당신이 합니다. 하지만 이제는 희망이 아니라 정확성으로 거래하게 됩니다. 우리는 이 인디케이터를 지난 약 3년 동안 골드(XAUUSD) 및 주요 외환 통화쌍의 데이 트레이딩 스캘핑에 사용해 왔습니다. M1, M5, M15, M30에서 우리의 핵심 도구입니다. 이 도구는 미래를 예측하려 하지 않습니다 — 지금 형성
Gann Made Easy MT5
Oleg Rodin
5 (10)
Gann Made Easy 는 mr.의 이론을 사용하여 최고의 거래 원칙을 기반으로 하는 전문적이고 사용하기 쉬운 Forex 거래 시스템입니다. W.D. 간. 이 표시기는 Stop Loss 및 Take Profit Levels를 포함하여 정확한 BUY 및 SELL 신호를 제공합니다. PUSH 알림을 사용하여 이동 중에도 거래할 수 있습니다. 구매 후 거래 방법 안내 및 유용한 추가 지표를 무료로 받으시려면 저에게 연락주세요! 아마도 Gann 거래 방법에 대해 이미 여러 번 들었을 것입니다. 일반적으로 Gann의 이론은 초보자 거래자뿐만 아니라 이미 거래 경험이 있는 사람들에게도 매우 복잡한 것입니다. Gann의 거래 방식은 이론적으로 적용하기 쉽지 않기 때문입니다. 나는 그 지식을 연마하고 Forex 지표에 최고의 원칙을 적용하기 위해 몇 년을 보냈습니다. 표시기는 적용하기가 매우 쉽습니다. 차트에 첨부하고 간단한 거래 권장 사항을 따르기만 하면 됩니다. 지표는 지속적으로 시장 분석
Neuro Poseidon MT5
Daria Rezueva
4.75 (52)
Neuro Poseidon is a new indicator by Daria Rezueva. It combines precise trading signals with adaptive TP/SL levels - creating best possible trades as a result! Message me and get  Neuro Poseidon Assistant  as a gift to automize your trading process! What makes it stand out? 1. Proven profitability on all assets and timeframes 2. Only confirmed BUY and SELL signals present on the chart 3. Adaptive TP & SL levels generated by the software for each trade 4. Easy to understand - suitable for al
M1 Sniper MT5
Oleg Rodin
5 (7)
M1 SNIPER 는 사용하기 쉬운 거래 지표 시스템입니다. M1 시간대에 맞춰 설계된 화살표 지표입니다. 이 지표는 M1 시간대 스캘핑을 위한 단독 시스템으로 사용할 수 있으며, 기존 거래 시스템의 일부로도 사용할 수 있습니다. 이 거래 시스템은 M1 시간대 거래용으로 특별히 설계되었지만, 다른 시간대에도 사용할 수 있습니다. 원래는 XAUUSD와 BTCUSD 거래를 위해 이 방법을 설계했지만, 다른 시장 거래에도 유용하다는 것을 알게 되었습니다. 이 지표의 신호는 추세 방향과 반대로 거래될 수 있습니다. 저는 지표의 신호를 활용하여 양방향으로 거래할 수 있도록 돕는 특별한 거래 기법을 알려드립니다. 이 방법은 특별한 동적 지지선과 저항선 가격 영역을 활용하는 것을 기반으로 합니다. 구매하시면 M1 SNIPER 화살표 지표를 바로 다운로드하실 수 있습니다. 또한, 아래 스크린샷에 표시된 Apollo Dynamic SR 지표는 M1 SNIPER 도구를 사용하는 모든 사용자에게 무료로
Entry Points Pro for MT5
Yury Orlov
4.52 (151)
전설이 돌아왔습니다: Entry Points Pro 10. MQL5 마켓 Top-3 자리를 3년간 지켜온 전설적인 지표의 재출시입니다. 수백 개의 호평 리뷰(두 버전 합산 589개), 매일 이 지표로 거래하는 수천 명의 트레이더, 31,000회 이상의 데모 다운로드   MT4+MT5 . 지난 5년간 여러분이 남긴 리뷰를 하나도 빠짐없이 읽었고, 약속 대신 그 답을 버전 10에 담았습니다. 1999년부터 시장에서 활동하며 정직함과 자신의 평판, 그리고 고객을 소중히 여기는 개발자가 만들었습니다. Entry Points Pro의 진입 시그널은 절대 리페인팅되지 않습니다. 그리고 이번에는 개발자의 말뿐이 아니라 검증 가능한 사실입니다: 확정 시그널은 캔들 종가에서만 표시되며, 자동화 테스트에서 리페인팅 0건 이 확인되었습니다(EURUSD, XAUUSD, BTCUSD에서 2,486,568회의 불변조건 검사 — 위반 0건). 검증 방법은 공개되어 있으니 전략 테스터에서 직접 재현해 보실 수
Unix Scalper
Issam Kassas
4 (4)
UNIX SCALPER — 특별 혜택 매매 기회를 찾고, 거래 계획을 확인하고, 실행 방법을 선택하세요. MT5용 UNIX Scalper를 99 USD에 구매하면 신호 자동매매에 사용할 수 있는 Smart Universal Expert Advisor를 무료로 받으실 수 있습니다. UNIX Scalper는 시장 분석, BUY/SELL/WAIT 판단, Entry, Stop Loss, TP1 및 TP2 가격 수준을 하나의 정돈된 패널에 제공합니다. 거래 계획에 따라 수동으로 매매하거나, 포함된 EA를 연결하여 선택한 설정에 따라 자동으로 실행할 수 있습니다. 현재 가격인 99 USD는 앞으로 30건의 구매에 적용됩니다. 이후 가격은 149 USD로 인상됩니다. 전체 패키지 구성 구매 시 다음 항목이 포함됩니다. • MT5용 UNIX Scalper. • Smart Universal Expert Advisor — 무료. • UNIX Scalper 전체 PDF 사용자 매뉴얼. • UNIX
새로운 왕의 등장 - 인디케이터 + 주문 관리 표시(TP1 + TP2 + TP3) + 선택형 텔레그램 시그널 전송 기능 포함 (무료) (완전한 트레이딩 및 시그널 시스템) 골드를 위한 최고의 EA: Gold Slayer 이 인디케이터는 고급 전략, 사용자 지정 가능한 주문 관리 시스템, 그리고 엔벨로프 확장을 결합한 평균 회귀(mean reversion) 시스템을 포함하고 있습니다. 또한 RSI와 같은 여러 지능형 확인 필터를 통해 높은 확률의 반전 진입 구간을 포착하여 BUY 및 SELL 시그널을 제공합니다. 단순히 거래 방법만 배우는 것이 아니라, 여러 포지션을 효과적으로 관리하고 이전에 수익 중인 오픈 포지션으로 손실 거래를 커버하는 방법까지 익힐 수 있습니다. M5 전용으로 설계 및 최적화되었으며, 유동성이 풍부해 시그널이 더 깔끔하고 신뢰도 높은 BTCUSD와 XAUUSD에서 뛰어난 성능을 발휘합니다. 이 인디케이터는 ATR 기반으로 자동 계산된 진입가, 손절가, 익절가와
Auto Optimized SpeedAngle 은 지속적인 워크포워드 최적화(Walk-Forward Optimization, WFO)를 통해 곡선 적합(curve-fitting)을 제거한 기관 수준의 모멘텀 벡터화 시스템입니다. 시장 체제가 바뀔 때 성능이 떨어지는 정적 입력에 의존하는 대신, 이 지표는 표본 외(Out-of-Sample, OOS) 검증을 사용하여 매개변수를 동적으로 재보정하며, 표시되는 신호가 과거의 우연이 아닌 진정한 통계적 우위를 나타내도록 보장합니다. 핵심 기관용 프레임워크 워크포워드 최적화 엔진: 핵심 알고리즘은 수천 가지의 룩백(lookback) 및 임계값 조합을 지속적으로 스캔하며, 데이터를 인샘플(in-sample)과 표본 외(out-of-sample) 세트로 엄격하게 분리합니다. 미지의 데이터 환경에서 수학적 우수성이 증명된 경우에만 새로운 매개변수 구성을 채택합니다. 정량적 목적 함수: 순수한 총이익을 쫓는 대신, 최적화 엔진은 기관 수준의 안정성
FiboSniper Pro
Van Minh Nguyen
5 (3)
FiboSniper Pro – Multi-Filter Fibonacci System with Auto SL/TP and Control Panel FiboSniper Pro는 동적 Fibonacci Envelopes와 여러 확인 필터를 결합하여 선별된 Buy 및 Sell 신호를 생성하는 기술적 지표입니다. Fibonacci 레벨은 Moving Average와 ATR을 기반으로 계산된 후 ADX, EMA, RSI, ATR, Volume, Time 및 Candle 구조를 통해 필터링됩니다. 이 지표는 ATR 기반의 자동 Stop Loss 및 Take Profit 레벨을 차트에 직접 표시하며, 빠른 설정 조정을 위한 인터랙티브 Control Panel을 제공합니다. 구매 후 권장 설정 파일과 자세한 사용 방법을 받으려면 저에게 문의해 주세요. Auto Trader X를 사용하여 FiboSniper Pro 신호를 자동화할 수 있습니다: [Auto Trader X] User Guide 및 Se
Welcome to ENTRY IN THE ZONE AND SMC MULTI TIMEFRAME /  Official Website: https://www.fableedge.net Entry In The Zone and SMC Multi Timeframe is a real-time market analysis tool based on Smart Money Concepts (SMC), designed to analyze market structure, price direction, and key trading zones. It supports both Single-Timeframe Analysis and Multi-Timeframe Analysis, providing a clearer view of the overall market structure across multiple timeframes, with real-time BUY / SELL signals that do not rep
Tokyo mt5 Indicator
Vasiliy Strukov
5 (2)
Tokyo Indicator는 추세 방향, 잠재적 거래 신호 및 시장 상황을 명확하고 시각적으로 보여줍니다. 색상으로 구분된 계단식 추세선은 강세 구간(파란색)과 약세 구간(자홍색)을 명확히 구별해 줍니다. 추세가 전환될 때 나타나는 방향성 화살표는 잠재적인 매수 및 매도 기회를 강조하여 보여줍니다. 통합 대시보드는 현재 신호, 시장 성향(bias), 모멘텀, 변동성, 신호 품질 등의 정보를 한눈에 파악할 수 있도록 구성되어 있습니다. 이를 통해 트레이더는 별도의 패널을 오갈 필요 없이 가격 움직임(price action)과 지표의 데이터를 동시에 분석할 수 있습니다. 깔끔한 차트 화면과 간결한 시장 개요를 제공하는 Tokyo Indicator는 체계적인 추세 분석과 거래 결정을 지원합니다. 모든 시간대와 다양한 자산(특히 금)에서 활용할 수 있습니다. 추세 방향, 잠재적 거래 신호 및 시장 상황을 명확하고 시각적으로 보여줍니다. 색상으로 구분된 계단식 추세선은 강세 구간(파란색)
Atomic Analyst MT5
Issam Kassas
4.47 (60)
ATOMIC ANALYST — 특별 혜택 시장 분석 도구, 자동매매 EA, 교육과 지원을 하나로. MT5용 Atomic Analyst를 99 USD에 구매하고, 지표의 신호를 자동매매에 활용할 수 있는 Smart Universal Expert Advisor를 무료로 받으세요 . Atomic Analyst는 가격 움직임 분석, 추세 방향, 진입·청산 신호, 손절 수준, 여러 익절 수준을 차트에 모아 보여줍니다. 분석을 참고해 수동으로 거래하거나, 포함된 EA를 연결하여 선택한 설정에 따라 자동으로 거래를 실행할 수 있습니다. 현재 가격인 99 USD는 앞으로 이루어지는 30건의 구매에 적용됩니다. 이후 가격은 149 USD로 인상됩니다. 전체 패키지 구성 구매 시 다음 항목이 포함됩니다. • MT5용 Atomic Analyst. • Smart Universal Expert Advisor — 무료. • 전체 Atomic Analyst PDF 사용자 설명서. • Atomic Ana
Power Candles MT5
Daniel Stein
4.58 (12)
Power Candles V3 - 자체 최적화 강도 지표 파워 캔들 V3는 적용된 모든 차트에서 통화 및 상품의 강세를 실행 가능한 거래 계획으로 전환합니다. 단순히 캔들에 색상을 입히는 대신, 백그라운드에서 실시간 자동 최적화를 수행하여 현재 보고 있는 종목에 대한 최적의 손절매, 익절 및 신호 임계값을 제공합니다. 한 번의 클릭으로 실시간 거래에 적용할 수 있으며, 진입점, 손절매 및 익절 선이 정확한 가격에 맞춰 차트에 표시되고, 방향과 함께 알림이 발령됩니다. 이 도구는 Stein Investments 에코시스템의 일부입니다. 18개 이상의 도구와 함께 당신의 1대1 AI 트레이딩 멘토 Max.  항상 대기 중, 모든 인디케이터를 깊이 있게 이해, 무언가를 차근차근 생각해보고 싶은 순간에 도움을 줍니다.  https://stein.investments 에서 만나보세요 매 종가 바마다 3,000회 이상의 트레이딩 시뮬레이션. 9가지 강도 상태. 2가지 전략을 병렬로 테스트.
SMART PRICE ACTION CONCEPTS — 특별 혜택 구조를 확인하고, 구간을 파악하고, 거래 계획을 세우세요. MT5용 Smart Price Action Concepts를 49 USD에 구매하면 Smart Universal Expert Advisor를 무료로 받으실 수 있습니다. Smart Money Concepts(SMC), ICT 방식의 분석, 가격 행동 분석을 하나의 정돈된 차트에서 활용하세요. 시장 구조, 오더 블록, 유동성 참고 수준과 불균형을 파악하고, Smart Panel에서 표시할 요소를 선택할 수 있습니다. 현재 가격인 49 USD는 앞으로 30건의 구매에 적용됩니다. 이후 가격은 100 USD로 인상됩니다. 전체 패키지 구성 • MT5용 Smart Price Action Concepts. • Smart Universal Expert Advisor — 무료 보너스. • 전체 PDF 사용자 매뉴얼 및 공식 온라인 강좌. • 단계별 설치 및 설정 안내.
Market Structure Order Block Dashboard MT5는 시장 구조와 주요 가격 반응 구역을 차트에서 직접 읽고자 하는 트레이더를 위해 설계된 MT5 지표입니다. BOS, ChoCH, 오더 블록, Fair Value Gap (FVG), 유동성, Kill Zones, Volume Profile 그리고 빠른 분석을 위한 콤팩트한 대시보드를 결합합니다. 이 지표는 시장 구조, ICT 및 Smart Money 개념을 의사결정 프레임워크로 사용하는 트레이더를 대상으로 합니다. 추세 지속, 가능한 반전, 가격 불균형, 유동성 타겟 및 관심 구역을 보다 체계적으로 식별하는 데 도움을 줄 수 있습니다. 구매자를 위한 포함 리소스 구매 후 MQL5 개인 메시지로 요청하시면 완전한 PDF 사용 설명서와 파라미터 설정 팁을 제공해 드립니다. MQL5 개인 메시지를 통한 직접 기술 지원. 1.20 버전은 두 가지 주요 추가 기능을 제공합니다: Pending BOS / Pending
FX Trend MT5 NG
Daniel Stein
5 (6)
FX Trend NG: 차세대 멀티 마켓 트렌드 인텔리전스 개요 FX Trend NG 는 다중 시간 프레임 기반의 전문 트렌드 분석 및 시장 모니터링 도구입니다. 몇 초 만에 전체 시장 구조를 파악할 수 있도록 설계되었습니다. 여러 차트를 일일이 전환할 필요 없이, 어떤 종목이 추세에 있는지, 어디에서 모멘텀이 약화되고 있는지, 그리고 어떤 시간 프레임이 서로 정렬되어 있는지 즉시 확인할 수 있습니다. 출시 기념 특별 혜택 – FX Trend NG 를 $30 (6개월) 또는 $80 평생 라이선스 로 이용할 수 있습니다. 이미 Stein Investments 고객이신가요? -> 메시지를 보내 전용 고객 그룹에 참여하세요. 설정이나 사용 방법이 필요하신가요? -> Stein Investments 공식 페이지 를 방문하세요. 1. FX Trend NG가 특별한 이유 3단계 추세 로직 – 단순한 Buy / Sell이 아닙니다 • 대부분의 지표는 Buy 또는 Sell 두 가지 상태만 제
FX Power MT5 NG
Daniel Stein
5 (33)
FX Power: 통화 강세 분석으로 더 스마트한 거래 결정을 개요 FX Power 는 어떤 시장 상황에서도 주요 통화와 금의 실제 강세를 이해하기 위한 필수 도구입니다. 강한 통화를 매수하고 약한 통화를 매도함으로써 FX Power 는 거래 결정을 단순화하고 높은 확률의 기회를 발견합니다. 트렌드를 따르거나 극단적인 델타 값을 사용해 반전을 예측하고자 한다면, 이 도구는 귀하의 거래 스타일에 완벽히 적응합니다. 단순히 거래하지 말고, FX Power 로 더 스마트하게 거래하세요. 1. FX Power가 거래자에게 매우 유용한 이유 통화와 금의 실시간 강세 분석 • FX Power 는 주요 통화와 금의 상대적 강세를 계산하고 표시하여 시장 역학에 대한 명확한 통찰력을 제공합니다. • 어떤 자산이 앞서고 있고 어떤 자산이 뒤처지는지 모니터링하여 보다 현명한 거래 결정을 내릴 수 있습니다. 포괄적인 멀티 타임프레임 뷰 • 단기, 중기 및 장기 타임프레임에서 통화와 금의 강세를
통화 강도 마법사는 성공적인 거래를 위한 올인원 솔루션을 제공하는 매우 강력한 지표입니다. 표시기는 여러 시간 프레임의 모든 통화 데이터를 사용하여 이 또는 해당 외환 쌍의 힘을 계산합니다. 이 데이터는 특정 통화의 힘을 확인하는 데 사용할 수 있는 사용하기 쉬운 통화 지수 및 통화 전력선의 형태로 표시됩니다. 필요한 것은 거래하려는 차트에 표시기를 부착하는 것뿐입니다. 표시기는 거래하는 통화의 실제 강세를 보여줍니다. 지표는 또한 추세와 거래할 때 유리하게 사용할 수 있는 구매 및 판매 거래량 압력의 극한값을 보여줍니다. 지표는 또한 피보나치에 기반한 가능한 대상을 보여줍니다. 표시기는 PUSH 알림을 포함한 모든 유형의 알림을 제공합니다. 구매 후 연락주세요. 나는 당신과 거래 팁을 공유하고 당신에게 무료로 훌륭한 보너스 지표를 줄 것입니다! 나는 당신에게 행복하고 유익한 거래를 기원합니다!
Adaptive Price Action Engine 지표를 구매하면 EA(자동매매 프로그램)가 무료 멀티 타임프레임 기반 자기 최적화 추세 & 캔들 패턴 분석 시스템 시장은 끊임없이 변화하며, 모든 Price Action 패턴이 모든 시장 환경에서 동일한 가치를 가지는 것은 아닙니다. Adaptive Price Action Engine 은 변화하는 시장 환경에 적응할 수 있도록 설계되었으며, 추세 구조, 멀티 타임프레임 분석, 캔들 패턴 및 통계적 최적화 를 하나의 분석 프레임워크로 결합합니다. 두 가지 적응형 모드 Dual Alpha Trend Mode 낮은 타임프레임과 높은 타임프레임에서 적합한 Alpha Trend 파라미터를 자동으로 탐색하여, 최근 시장 움직임에 맞춰 추세 분석을 조정합니다. Candlestick + Alpha Mode Alpha Trend를 통한 시장 국면 분석과 22개의 상승 및 하락 캔들 패턴 을 결합합니다. 모든 패턴을 동일하게 취급하는 대신, 다양
M1 Quantum MT5
Hamed Dehgani
4.2 (10)
M1 Quantum을 이용한 실시간 트레이딩 신호 : 신호   ( Quantum Trade Assistant 에 의해 거래가 자동으로 실행되며, 이 제품에 무료 로 포함되어 있습니다.) 최신 소식: 버전 1.64가 출시되었습니다. 이제 모든 거래에는 해당 지지/저항 구간 뒤에 Stop Loss가 설정됩니다. 또한 이번 버전에서는 EA의 성능을 향상시키기 위해 Smart Close 기능이 개선되었습니다. 8월 9일부터 라이브 신호는 버전 1.64로 운영되고 있습니다. 가격 계획: 현재 가격: $169 (얼리 어답터 혜택) 다음 예정 가격: $189 예정 소매 가격: $299 개발자 안내: 구매 후 저에게 연락하시면 최신 권장 설정 파일(Set File) , 사용 팁, 그리고 다른 M1 Quantum 사용자들과 소통할 수 있는 VIP 지원 그룹 초대장을 받으실 수 있습니다. 자주 묻는 질문 - 설정 파일 - 설치 가이드 M1 Quantum 은 M1 전용 전문 트레이딩 시스템으로, 손
PZ Trend Trading MT5
PZ TRADING SLU
3.8 (5)
Capture every opportunity: your go-to indicator for profitable trend trading Trend Trading is an indicator designed to profit as much as possible from trends taking place in the market, by timing pullbacks and breakouts. It finds trading opportunities by analyzing what the price is doing during established trends. [ Installation Guide | Update Guide | Troubleshooting | FAQ | All Products ] Trade financial markets with confidence and efficiency Profit from established trends without getting whips
Scalper Vault 는 성공적인 스캘핑에 필요한 모든 것을 제공하는 전문 스캘핑 시스템입니다. 이 표시기는 외환 및 바이너리 옵션 거래자가 사용할 수 있는 완전한 거래 시스템입니다. 권장 시간 프레임은 M5입니다. 시스템은 추세 방향으로 정확한 화살표 신호를 제공합니다. 또한 상단 및 하단 신호와 Gann 시장 수준을 제공합니다.  이 시스템은 사용하기가 매우 쉽습니다. 원하는 시장 지역의 화살표만 따라가면 됩니다. 엑시트는 가격이 적정 수준에 도달하거나 시장의 고점 또는 저점 신호가 나타날 때 수행됩니다.  표시기는 PUSH 알림을 포함한 모든 유형의 경고를 제공합니다. 인디케이터 구매 후 연락주세요. 내 개인 거래 권장 사항과 훌륭한 보너스 지표를 무료로 공유합니다! 나는 당신에게 행복하고 유익한 거래를 기원합니다!
Divergence Bomber
Ihor Otkydach
4.89 (94)
이 지표를 구매하신 분께는 다음과 같은 혜택이 무료로 제공됩니다: 각 거래를 자동으로 관리하고, 손절/익절 수준을 설정하며, 전략 규칙에 따라 거래를 종료하는 전용 도우미 툴 "Bomber Utility" 다양한 자산에 맞게 지표를 설정할 수 있는 셋업 파일(Set Files) "최소 위험", "균형 잡힌 위험", "관망 전략" 모드로 설정 가능한 Bomber Utility의 셋업 파일 이 전략을 빠르게 설치, 설정, 시작할 수 있도록 돕는 단계별 영상 매뉴얼 주의: 위의 모든 보너스를 받기 위해서는 MQL5 개인 메시지 시스템을 통해 판매자에게 연락해 주세요. 독창적인 커스텀 지표인 “Divergence Bomber(다이버전스 봄버)”를 소개합니다. 이 지표는 MACD 다이버전스(괴리) 전략을 기반으로 한 올인원(All-in-One) 거래 시스템입니다. 이 기술 지표의 주요 목적은 가격과 MACD 지표 간의 다이버전스를 감지하고, **향후 가격이 어느 방향으로 움직일지를 알려주
Axiom Matrix
Issam Kassas
5 (8)
Axiom Matrix — 특별 혜택 Axiom Matrix을 49 미국 달러에 구매하고 Smart Universal Expert Advisor를 무료로 받으세요. 시장을 탐색하세요. 기회를 비교하세요. 다음 차트를 선택하세요. Axiom Matrix는 여러 종목과 시간대의 분석을 하나의 대시보드에 모읍니다. 모든 차트를 따로 확인하지 않고 집중할 시장을 찾으세요. 종합시세 또는 선택한 종목을 여러 시간대에서 탐색. 추세, 모멘텀, 거래량, 변동성 및 시장 품질 정보 비교. Best Axiom Pick, 신호 상태 및 클릭 가능한 셀로 거래 조건 확인. Axiom Matrix는 분석 대시보드이며 거래를 실행하지 않습니다. 패키지 구성 Axiom Matrix Smart Universal Expert Advisor PDF 사용 설명서와 온라인 강좌. 설정 안내와 구매자 커뮤니티 이용 혜택. Smart Universal Expert Advisor는 별도의 보너스입니다. 이 제품의 직접적인
IX Power MT5
Daniel Stein
4.92 (13)
IX Power: 지수, 원자재, 암호화폐 및 외환 시장 통찰력을 발견하세요 개요 IX Power 는 지수, 원자재, 암호화폐 및 외환 시장의 강도를 분석할 수 있는 다목적 도구입니다. FX Power 는 모든 가용 통화 쌍 데이터를 사용하여 외환 쌍에 대해 가장 높은 정확도를 제공하는 반면, IX Power 는 기초 자산 시장 데이터에만 초점을 맞춥니다. 이로 인해 IX Power 는 비외환 시장에 이상적이며, 다중 쌍 분석이 필요하지 않은 간단한 외환 분석에도 신뢰할 수 있는 도구입니다. 모든 차트에서 매끄럽게 작동하며, 거래 결정을 향상시키기 위한 명확하고 실행 가능한 통찰력을 제공합니다. 1. IX Power가 트레이더에게 유용한 이유 다양한 시장 강도 분석 • IX Power 는 지수, 원자재, 암호화폐 및 외환 심볼의 강도를 계산하여 각 시장에 맞는 통찰력을 제공합니다. • US30, WTI, 금, 비트코인 또는 통화 쌍과 같은 자산을 모니터링하여 거래 기회를 발견
UZFX {SSS} 스캘핑 스마트 시그널 v5.0 MT5는 급변하는 시장에서 정확한 실시간 시그널을 필요로 하는 스캘퍼, 데이 트레이더, 스윙 트레이더를 위해 설계된 리페인팅이 없는 고성능 트레이딩 지표입니다. (UZFX-LABS)에서 개발한 이 지표는 가격 움직임 분석, 추세 확인 및 스마트 필터링을 결합하여 모든 통화 쌍과 시간대에서 높은 확률의 매수 및 매도 신호, 경고 신호, 추세 지속 기회를 생성합니다. 거래에 대한 망설임을 멈추고, 명확성, 정밀성, 그리고 규율 있는 시장 실행을 원하는 트레이더를 위해 설계된 체계적인 신호 시스템을 따르기 시작하세요. 제 말을 믿으세요. 이 지표는 MQL5에서 구할 수 있는 최고의 지표 중 하나입니다. 그러니 절대 놓치지 마세요!! “현명한 트레이더를 위한 스마트 신호” 지금 최신 버전 5.0이 출시되었으며, 사전 공지 없이 가격이 최대 $499.99까지 인상될 수 있으니 기회를 놓치기 전에 서둘러 구매하세요!! 최종 구매 전! 무료 체
제작자의 제품 더 보기
A fully automated double-side grid and hedge Expert Advisor for gold (XAUUSD) on MetaTrader 5. OVERVIEW Gold DoubleSide Grid EA trades both directions on the same symbol at the same time. It opens paired buy and sell positions, adds to the grid by Distance steps as price moves, scales lot size with a martingale multiplier, and aims to close each cycle in profit using a trailing profit lock. An automatic session filter learns the broker's daily market break from tick data, so the EA pauses around
Session Volume Profile (Daily) This indicator draws a daily Session Volume Profile directly on your chart. For each trading day it builds a horizontal volume histogram and marks the three key levels traders watch: the Point of Control (POC) , the Value Area High (VAH) and the Value Area Low (VAL) . The profile resets automatically at the start of every new day, and you can choose how many previous days to display alongside the current one. Key Features POC, VAH and VAL plotted and labelled for e
CustomRange VolumeProfile This indicator builds a Volume Profile for any part of the chart you want to study . Instead of resetting per day, you choose the range - either by dragging two vertical lines yourself, or by letting the indicator snap the range to a ZigZag swing leg automatically . It then draws the horizontal volume histogram together with the three key levels: the Point of Control (POC) , the Value Area High (VAH) and the Value Area Low (VAL) . Two Ways To Set The Range MANUAL - two
QuickTrade - One-Click Trading Panel QuickTrade is a manual trading panel that places orders with a single click and sizes the lot automatically from a fixed money-per-trade amount. Instead of typing a lot size, you type how much money you want to put at risk, and QuickTrade calculates the correct lot from your chosen Stop Loss distance. Every order is sent with its Stop Loss and Take Profit already attached. Key Features One-click SELL / BUY - large buttons that also show the live Bid/Ask price
Triple MA Trend Alignment This indicator draws three moving averages on one chart and colours them by their alignment , so the state of the trend can be read at a glance instead of comparing the lines by eye. The default setup is EMA 9, EMA 34 and EMA 100, and every period, method, applied price, colour and line width can be changed. How The Colours Work The three lines are coloured by two independent rules. Fast and Mid always share one colour, decided by the fast line: above the mid line they
Multi Session VWAP with Deviation Bands Four volume weighted average price lines in one indicator, each anchored to a different point in the trading day: the Asian session, the London session, the New York session and the daily open. Every anchor can be shown or hidden with one click on the chart, and each one carries its own set of standard deviation bands. Session times are defined in UTC, not in broker time Sessions are entered as UTC hours, and the indicator works out the broker server offse
SMC Swing Structure and Fair Value Gaps Most market structure indicators draw every break and every gap they can find, and the chart ends up covered in lines from months ago. This one shows one swing at a time . You pick a swing with the arrows on the chart panel, and only that swing is drawn: its leg, the structure level it broke, and the fair value gaps created inside it. Key Features One swing at a time. The chart stays clean because nothing outside the selected swing is drawn. Step through s
필터:
리뷰 없음
리뷰 답변