Volatility Reversal Engine
- Indicadores
- Versão: 1.25
- Ativações: 10

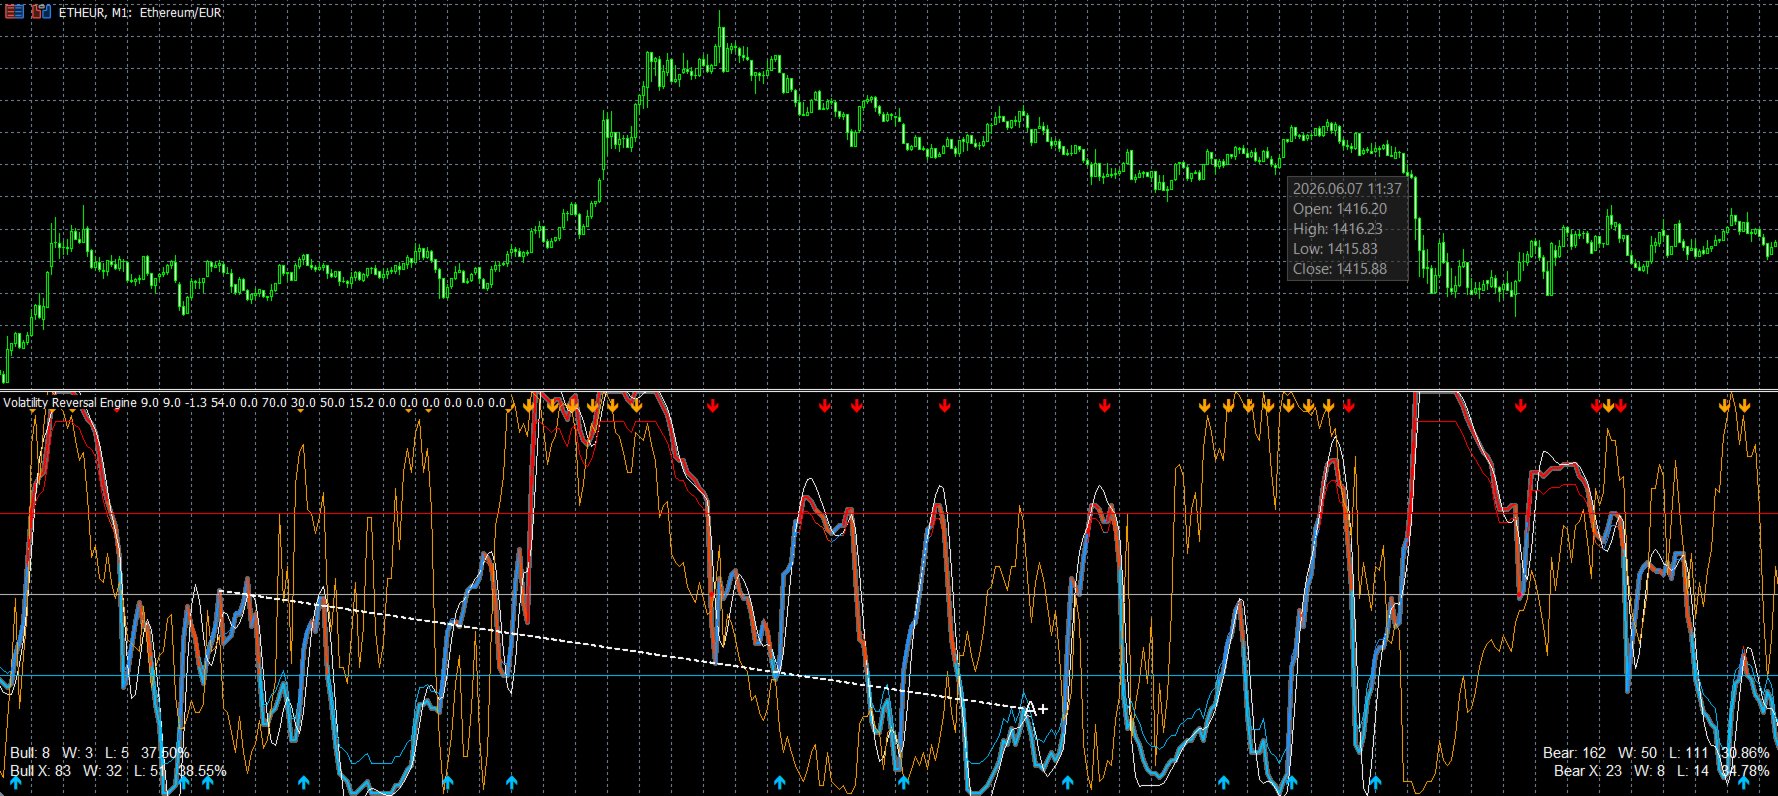
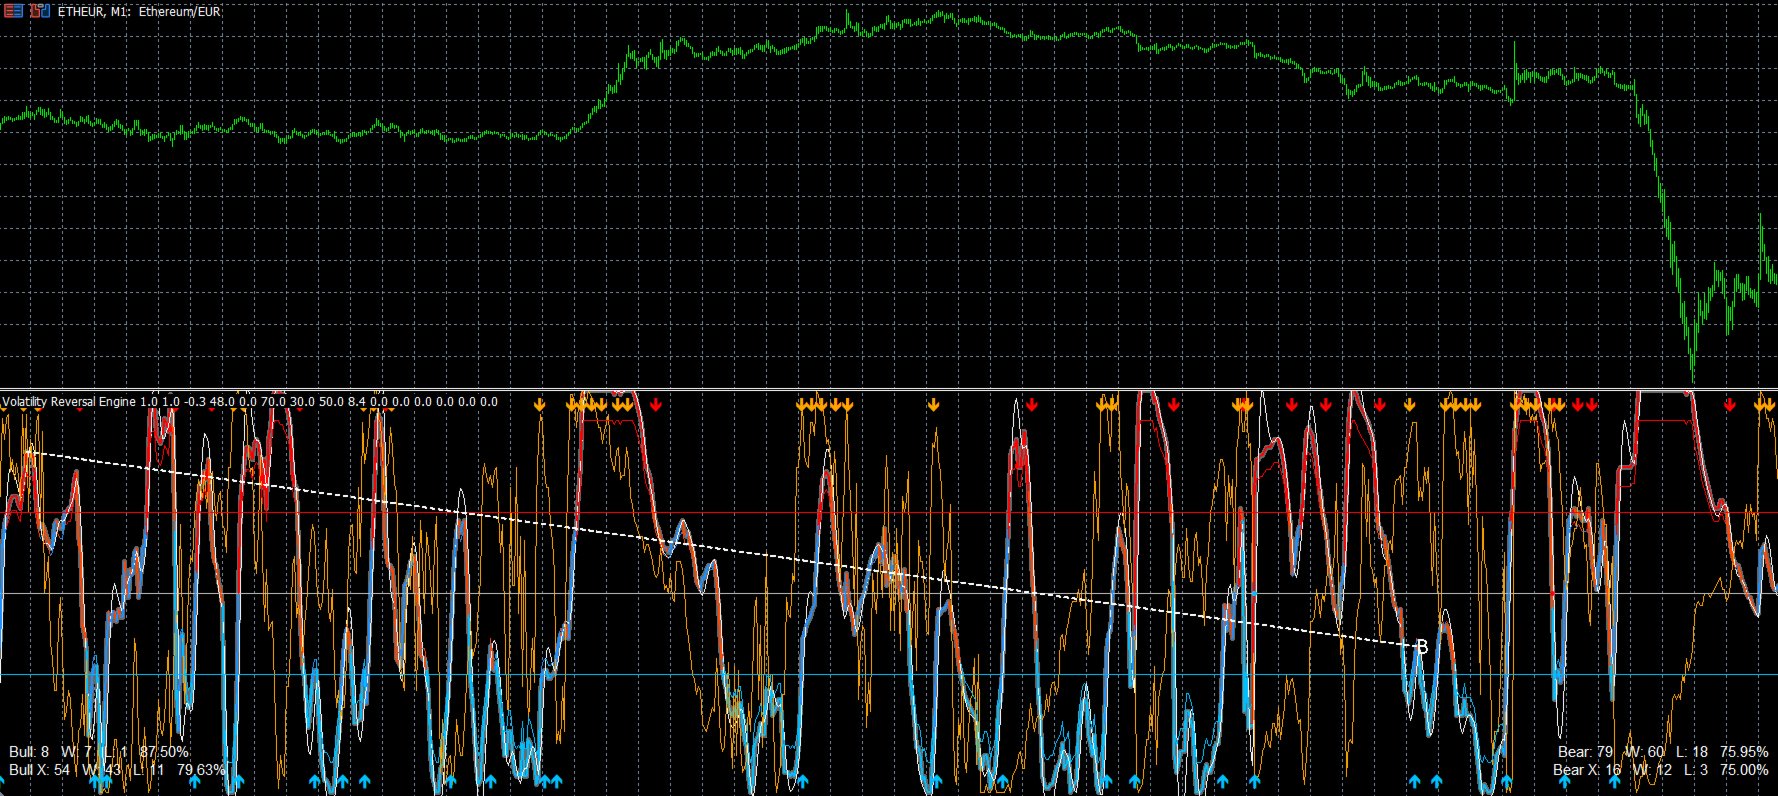
Volatility Reversal Engine is a multi-layer volatility and mean-reversion indicator for MetaTrader 5. It converts changes in market volatility into a normalized 0–100 oscillator, making it easier to identify volatility expansion, contraction, exhaustion, reversal conditions and divergence.
The indicator is designed for traders who want more information than a standard volatility line. It combines volatility percentile analysis, smoothing, price divergence, mean-reversion ranking, graded signals, alerts and historical outcome statistics in one configurable indicator window.
VOLATILITY OSCILLATOR
The primary oscillator measures Bollinger Band width and converts it into a percentile rank between 0 and 100.
-
High values indicate that current volatility is elevated relative to recent market conditions.
-
Low values indicate volatility contraction or unusually quiet conditions.
-
The default upper threshold is 70.
-
The default lower threshold is 30.
-
The 50 level represents the centre of the volatility range.
Because the oscillator is normalized, it can be used across different symbols and timeframes without relying on a fixed price-based volatility scale.
SMOOTHING AND SIGNAL LINE
Optional smoothing can be applied to reduce noise and make changes in volatility direction easier to interpret.
Available smoothing methods:
-
Simple Moving Average
-
Exponential Moving Average
-
Hull Moving Average
The smoothing length and method can be adjusted independently. An additional signal line can be displayed for visual confirmation.
VOLATILITY REVERSAL SIGNALS
The indicator identifies two principal reversal conditions:
-
Volatility Peak: volatility moves out of the high-volatility region and crosses below the upper threshold.
-
Volatility Trough: volatility moves out of the low-volatility region and crosses above the lower threshold.
These events can be displayed as markers inside the indicator window. Optional cooldown settings help prevent clusters of repeated signals.
BULLISH AND BEARISH DIVERGENCE
Confirmed pivot analysis is used to compare price structure with the volatility oscillator.
-
Bullish divergence occurs when price forms a lower low while the volatility oscillator forms a higher low.
-
Bearish divergence occurs when price forms a higher high while the volatility oscillator forms a lower high.
Divergences can be drawn inside the oscillator window. Optional corresponding lines can also be displayed directly on the price chart.
Each divergence is graded according to the size of the price movement and the change in volatility:
-
A+ represents the strongest qualifying divergence.
-
B represents a medium-strength setup.
-
C represents a basic qualifying setup.
The minimum displayed signal grade, pivot length, line appearance and divergence cooldown can all be configured.
MEAN-REVERSION PERCENTILE
The indicator includes a separate mean-reversion model based on the percentile rank of the price Z-score.
This component helps identify when price is statistically extended relative to its recent behaviour. The raw mean-reversion line and an optional smoothed version can be displayed independently.
Configurable features include:
-
Z-score calculation length
-
Percentile-rank length
-
A+ threshold
-
Smoothing method and length
-
Grade guide levels
-
Grade tags
-
Transition-only tags
-
Signal cooldown
COMBINATION SIGNALS
The Combo Short condition combines an A+ mean-reversion reading with a recent qualifying bearish divergence.
This allows traders to isolate situations where price extension, volatility behaviour and bearish divergence appear together. The required divergence grade and lookback window can be adjusted.
50-LEVEL CROSS SIGNALS
Optional Bull X and Bear X markers identify selected transitions through the oscillator’s 50 level after extreme volatility conditions.
These signals are evaluated separately from the main volatility peak and trough signals and include their own historical statistics.
HISTORICAL STATISTICS
The indicator can display four compact performance summaries:
-
Bull reversal statistics
-
Bear reversal statistics
-
Bull X statistics
-
Bear X statistics
Each summary includes the number of signals, wins, losses and historical win rate. Outcomes are evaluated using the configurable target-profit and stop-distance percentages.
The statistics are intended for comparative research and parameter evaluation. They are not a guarantee of future performance and should not be treated as a replacement for proper strategy testing.
DISPLAY OPTIONS
The visual appearance can be adapted to different chart designs.
Available options include:
-
Multiple colour themes
-
Custom bullish and bearish colours
-
Adjustable oscillator line width
-
Optional glow effect
-
Optional energy ribbon
-
Optional reversal markers
-
Minimal display mode
-
Configurable table positions and offsets
-
Custom divergence colours, widths and line styles
ALERTS
Built-in alerts are available for:
-
Volatility peaks
-
Volatility troughs
-
Bullish volatility divergence
-
Bearish volatility divergence
-
Bull X signals
-
Bear X signals
BASIC INTERPRETATION
A high oscillator value does not automatically mean price must fall, and a low value does not automatically mean price must rise. The oscillator measures the relative volatility environment rather than price direction.
Signals are generally more useful when combined with:
-
Support and resistance
-
Market structure
-
Trend direction
-
Liquidity zones
-
Price-action confirmation
-
Appropriate risk management
Volatility Reversal Engine is an analytical indicator only. It does not open, manage or close trades automatically.
The indicator can be applied to any MetaTrader 5 symbol and timeframe for which sufficient historical price data are available.
IMPORTANT
Historical signals and statistics do not guarantee future results. Trading involves risk, and users remain responsible for their own entries, exits, position sizing and risk management.