MTF Confluence Dashboard
- Indicadores
-
Michael B Neely
 I began with an interest in trading in the late 1990s. I became a broker in the US for commodities and currencies in 2002-2004. I started trading with my own money in 2009. I had a very profitable trading year in 2014 and on 2015 got out of the markets. I started coding in 2011 working with websites
 - Versão: 1.10
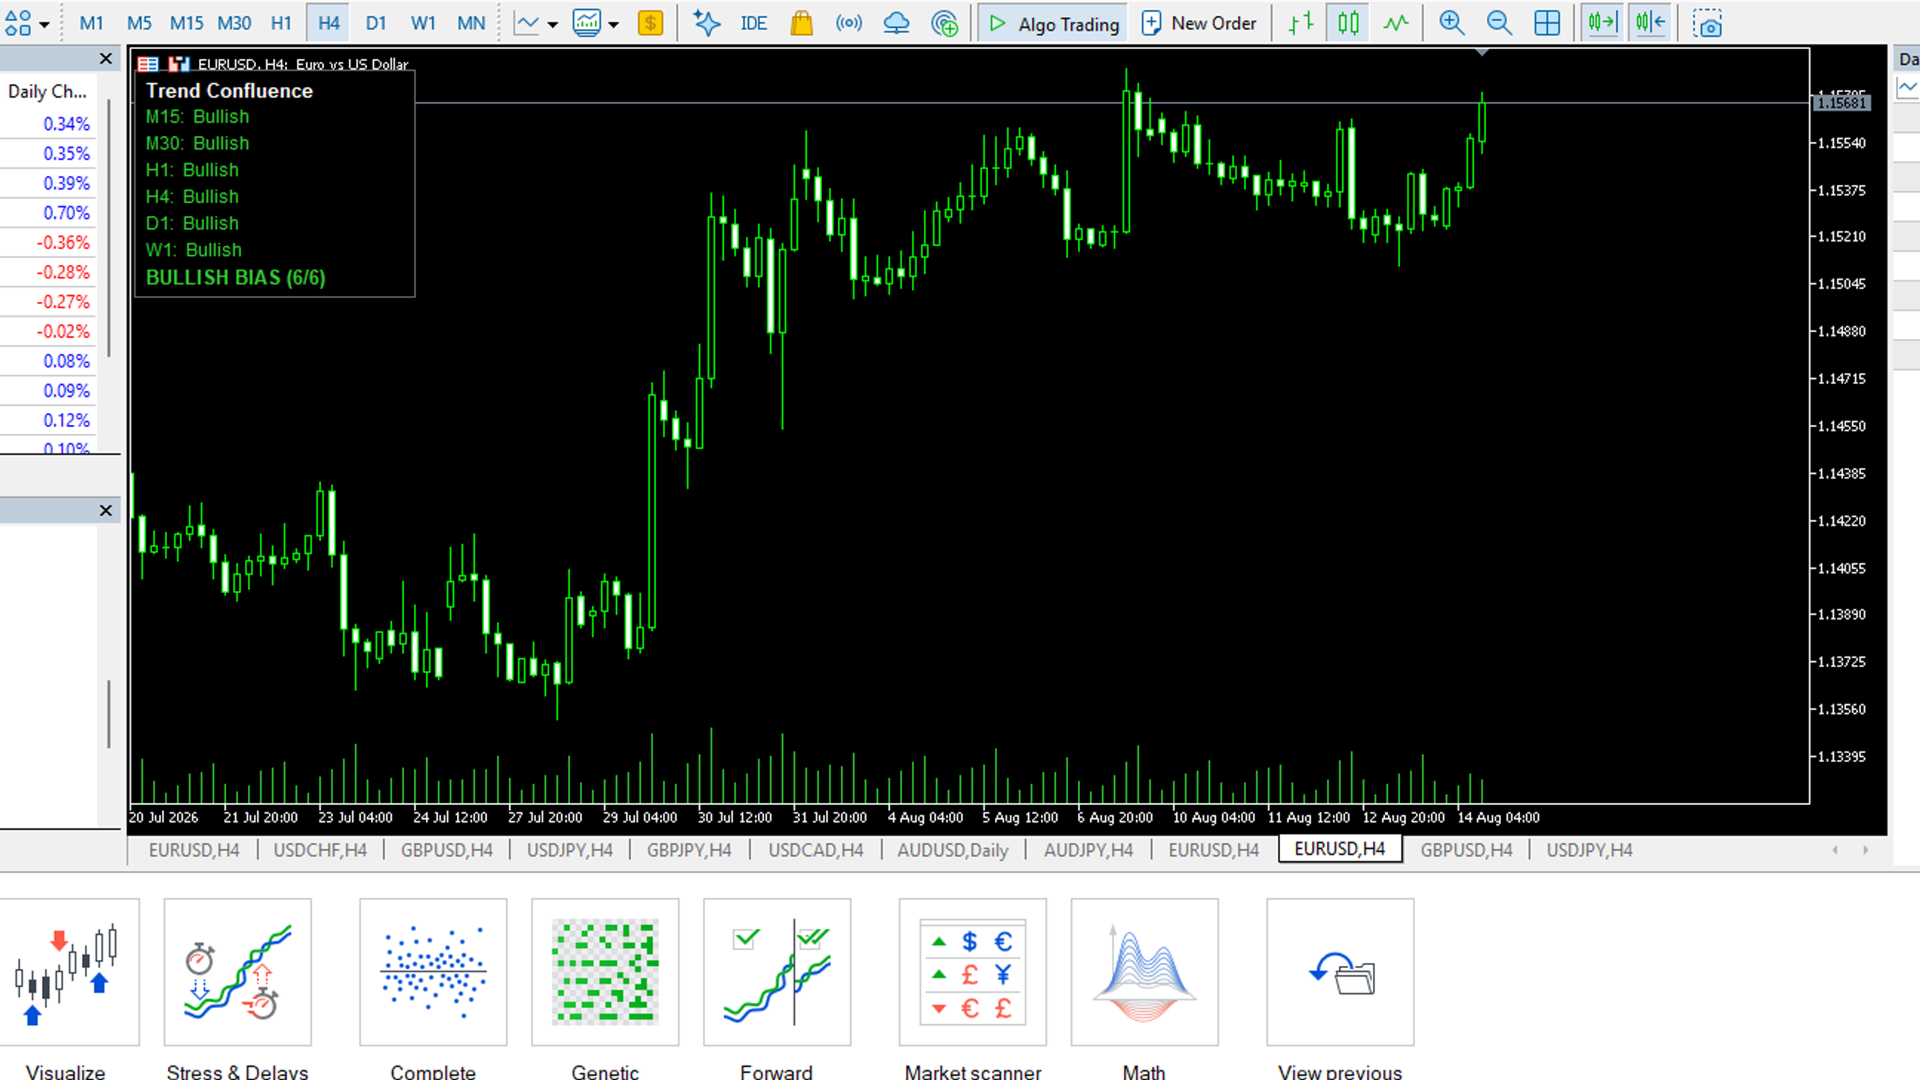
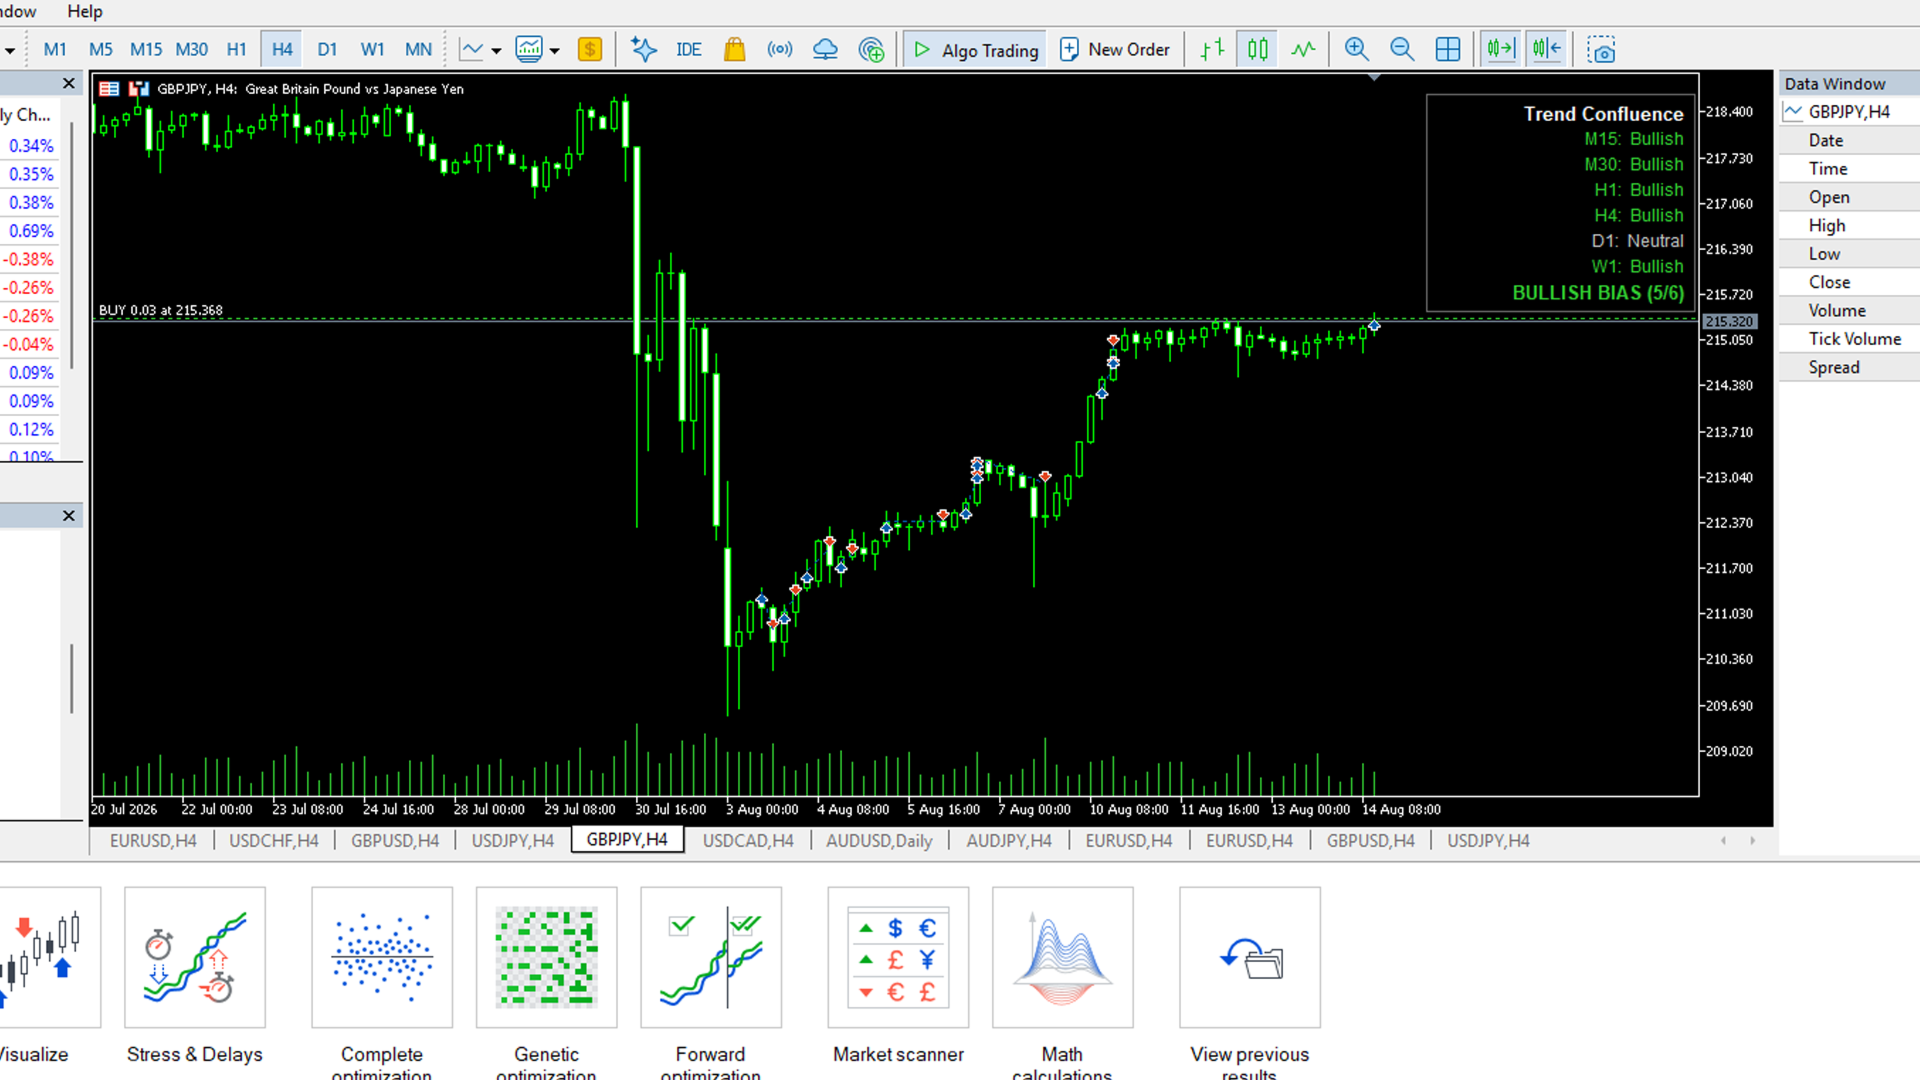
**MTF Confluence Dashboard** is a free, self-contained indicator: a compact on-chart panel that classifies trend direction (Bullish / Bearish / Neutral) across up to six timeframes (M15, M30, H1, H4, D1, W1) and shows a one-line bias summary.
Trend per timeframe is based on a fast/slow EMA relationship, confirmed by price position relative to the fast EMA (not a raw EMA cross) to cut down on whipsaw:
- **Bullish** — fast EMA above slow EMA, and price above the fast EMA
- **Bearish** — fast EMA below slow EMA, and price below the fast EMA
- **Neutral** — anything else
- **N/A** — data not yet available for that timeframe (e.g. right after attaching, or history still syncing) — shown distinctly so it's never confused with a genuine neutral reading
The panel refreshes automatically (default every 2 seconds) and works on any symbol immediately — no setup, no external files, no dependencies.
**Inputs:**
- `InpUseM15` / `InpUseM30` / `InpUseH1` / `InpUseH4` / `InpUseD1` / `InpUseW1` — which timeframes to include (all on by default)
- `InpFastEMAPeriod` (default 20), `InpSlowEMAPeriod` (default 50)
- `InpRefreshSeconds` — how often the panel recalculates (default 2)
- `InpCorner`, `InpOffsetX`, `InpOffsetY` — panel position on the chart (works correctly in all four corners)
Multiple instances can be attached to the same chart at once (e.g. to compare two EMA settings side by side) without conflicting.
No trading logic of any kind — purely a visual reference tool.