HA Metals Flow Chart
- Indicadores
-
Paolo Ruffini
 Sou trader com mais de 15 anos de experiência operacional nos mercados de Forex e commodities, com foco especial na dinâmica de liquidez, pressão volumétrica e estrutura do movimento direcional do preço.
 - Versão: 1.0
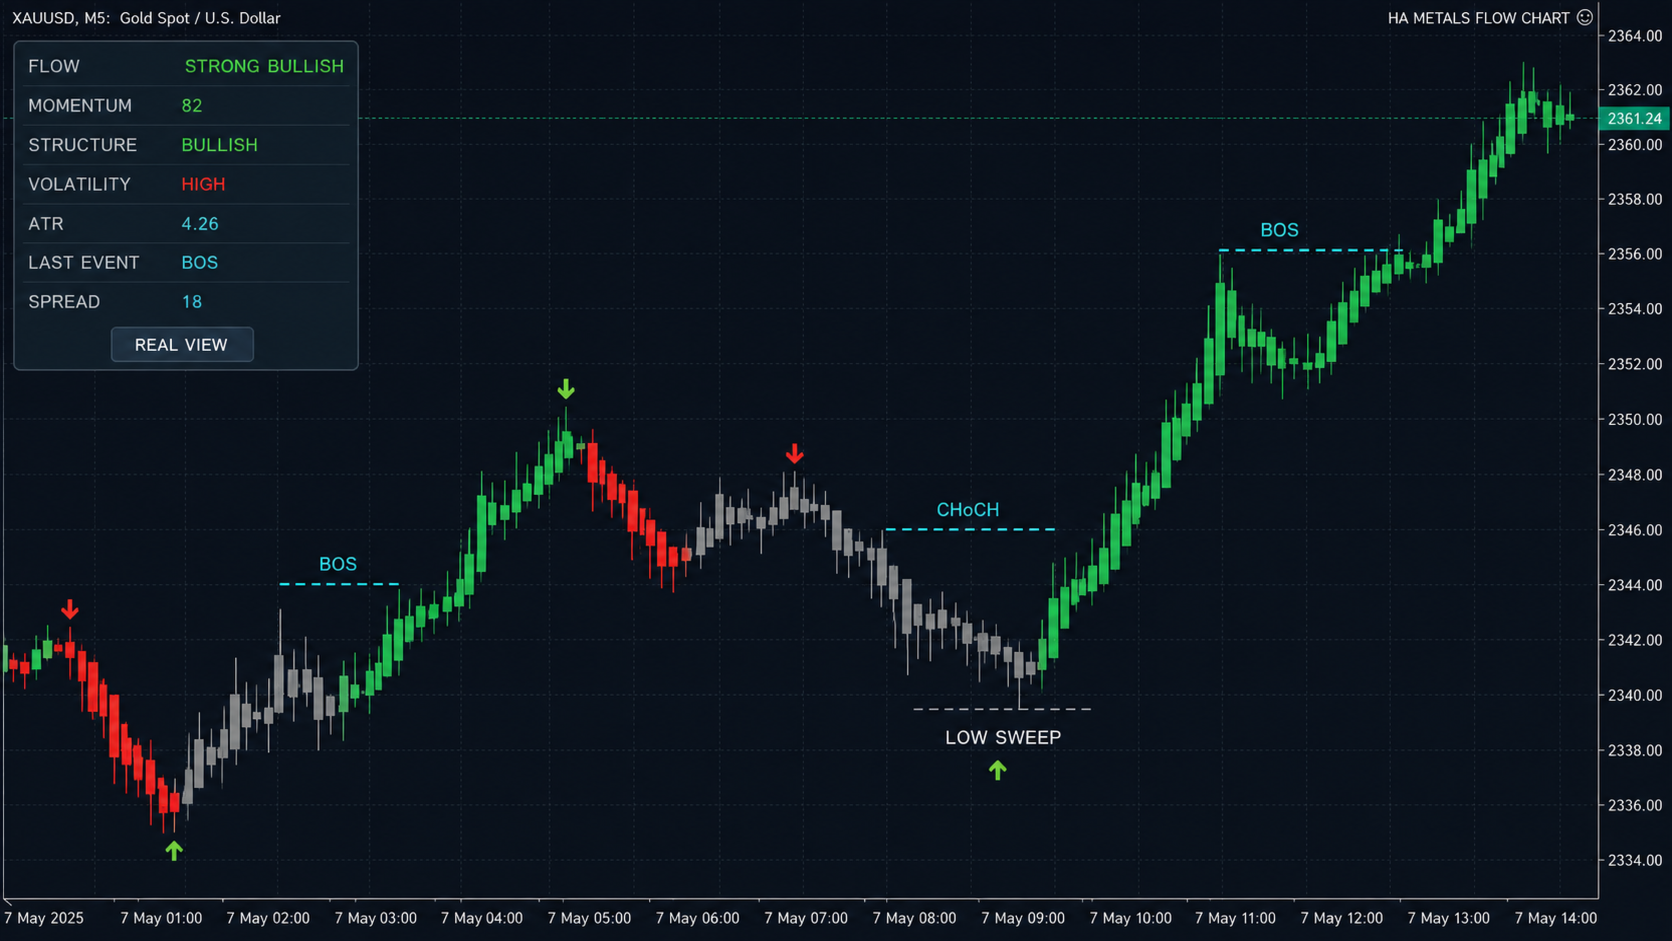
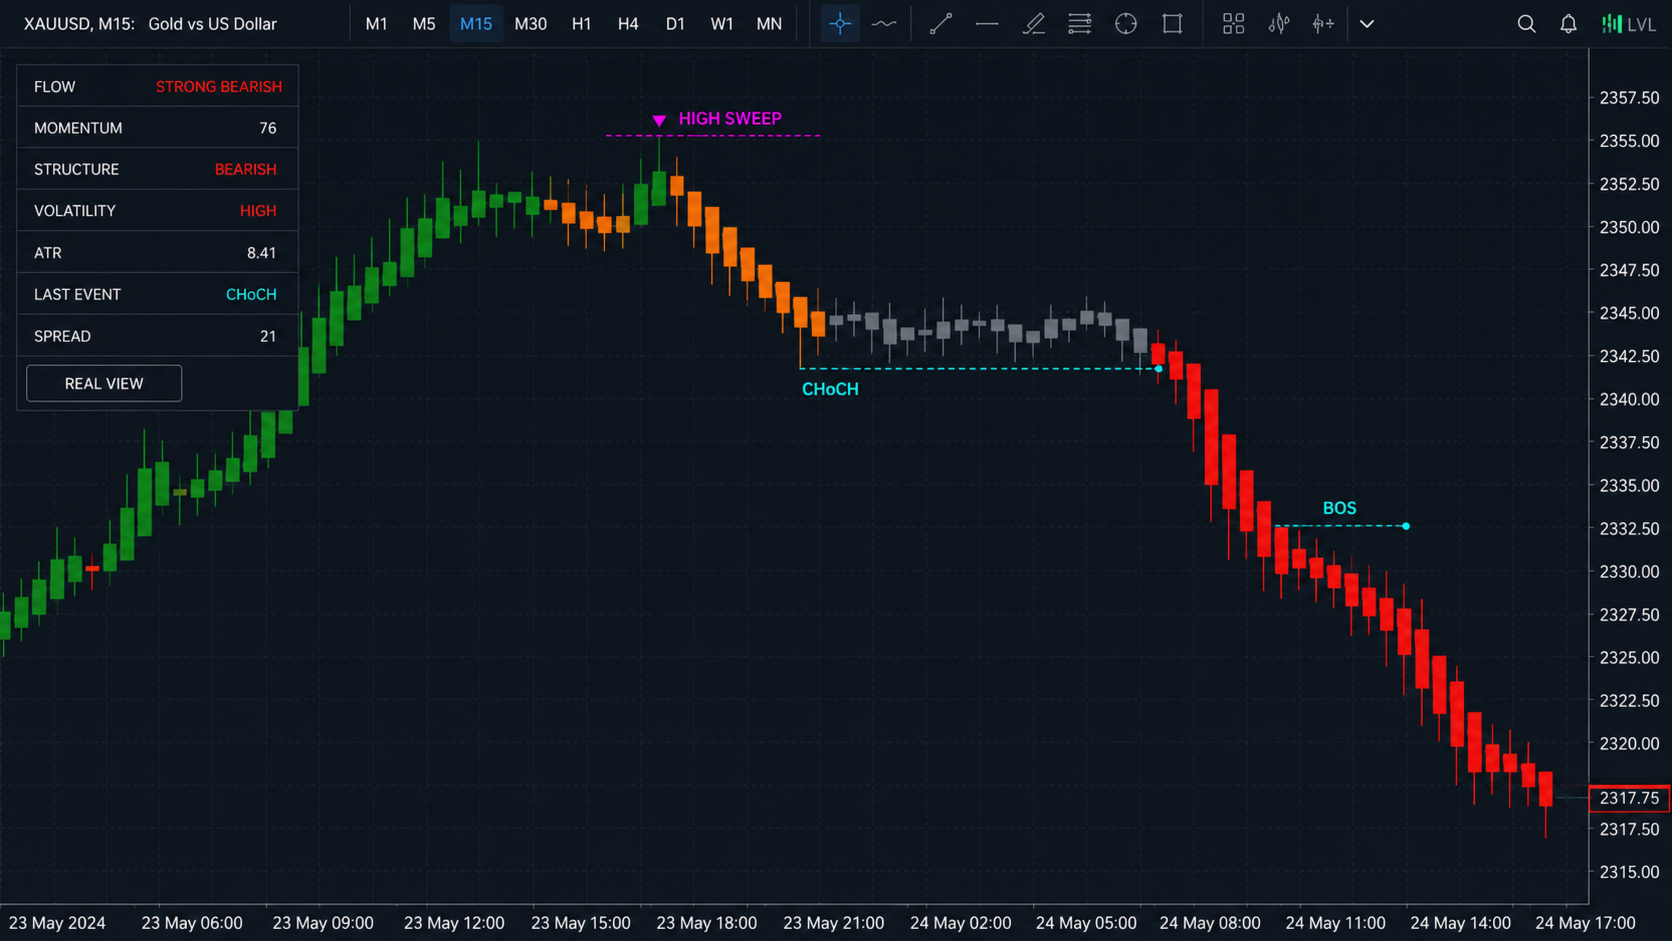
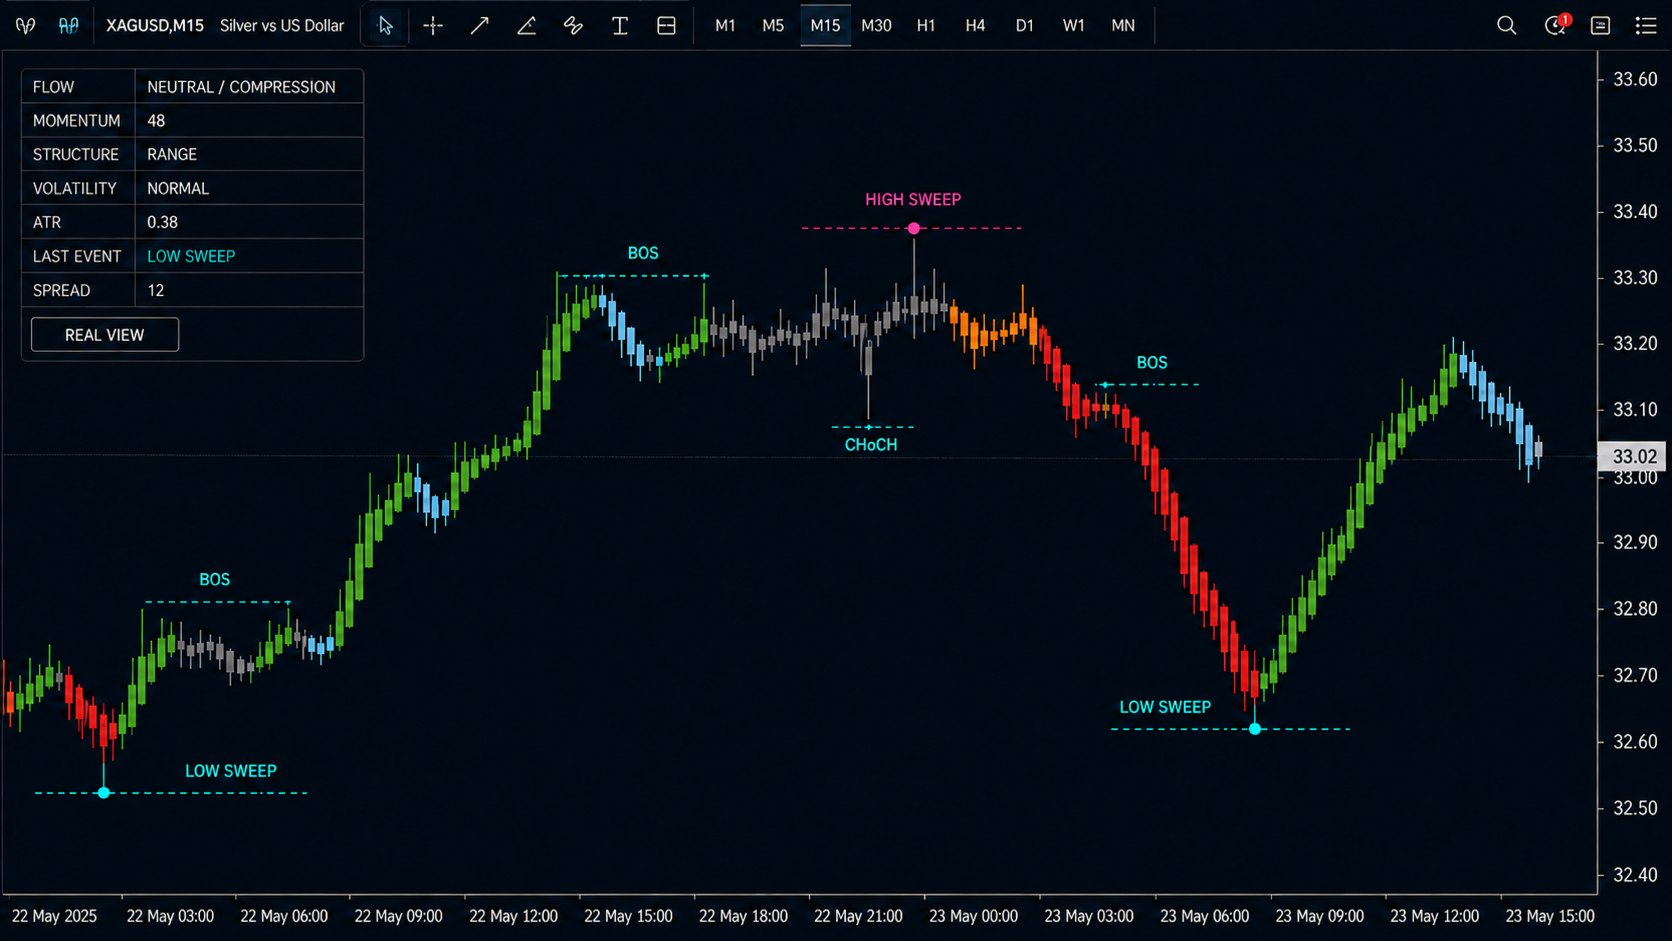
HA Metals Flow Chart is a visual MetaTrader 5 indicator designed to make the flow of gold and silver easier to read. It replaces the standard chart display with synthetic Heikin Ashi candles and combines flow classification, normalized momentum, confirmed market structure events and a compact dashboard in a single interface. The indicator is intended for discretionary chart analysis. It does not open, modify or close trades. MAIN FEATURES - Synthetic Heikin Ashi chart for a cleaner view of directional flow. - Automatic recognition of XAUUSD and XAGUSD, including many broker suffixes. - Seven market conditions: Strong Bullish, Bullish, Bullish Pullback, Neutral/Compression, Bearish Pullback, Bearish and Strong Bearish. - ATR-normalized momentum displayed on a scale from 0 to 100. - Confirmed swing detection based on real market prices. - BOS, CHoCH and liquidity sweep detection calculated from real High, Low and Close data. - Dashboard showing flow, momentum, structure, volatility, ATR, the latest event and spread. - REAL VIEW / HA VIEW button for switching between native price candles and the synthetic Heikin Ashi display. - Optional alerts generated only after a bar has closed. - Adjustable structure sensitivity and chart history limits. HOW THE INDICATOR READS THE MARKET The candle colors summarize the current directional condition: - Bright green: strong bullish flow. - Green: bullish flow. - Light blue: bullish movement within a bearish structure, indicating a possible pullback. - Gray: compression, neutrality or indecision. - Orange: bearish movement within a bullish structure, indicating a possible pullback. - Light red: bearish flow. - Bright red: strong bearish flow. - Aqua: sweep of a previous low. - Magenta: sweep of a previous high. MARKET STRUCTURE Heikin Ashi candles use synthetic prices and are intended for visual analysis. Market structure events are calculated separately from actual High, Low and Close prices. Confirmed swings are used to identify: - BOS: Break of Structure. - CHoCH: Change of Character. - Liquidity sweeps above confirmed highs or below confirmed lows. Swing confirmation occurs after the number of newer bars selected in PivotNewerBars. This intentional delay prevents unconfirmed swing points from being treated as final structure. RECOMMENDED USE - Instruments: XAUUSD and XAGUSD. - Suggested timeframes: M5 and M15. - XAUUSD: leave StrongBodyATR and CompressionBodyATR at 0 to use automatic thresholds. - XAGUSD: leave the same parameters at 0 to activate the automatic thresholds designed for silver. - For more selective structure detection, use PivotNewerBars = 3 and PivotOlderBars = 3. - To reduce chart load, use EventBars = 250 and MaxBars = 1500. IMPORTANT OPERATING NOTES - The current candle and dashboard momentum update in real time. - Structure events drawn on the chart and optional alerts are generated only on closed bars. - Heikin Ashi values are synthetic and are not directly executable market prices. - BOS, CHoCH and liquidity sweeps are based on real High, Low and Close prices. - This indicator is an analytical tool and does not execute or manage orders. - Symbol naming and historical data availability depend on the broker. INSTALLATION After purchasing or downloading the product from the MQL5 Market: 1. Open MetaTrader 5 and log in with the MQL5 account used for the purchase. 2. Open Navigator and select Market or Purchased. 3. Locate HA Metals Flow Chart and click Install. 4. Drag the indicator onto an XAUUSD or XAGUSD chart. 5. Select the desired inputs and click OK.