RSI 2level Scanner MT5
- Indicadores
- Versão: 1.40
- Atualizado: 31 agosto 2026

RSI 2-Level Scanner MT5
Multi-Symbol RSI Reversal Scanner with Clickable Chart Navigation
Added the option to scan Market Watch or a custom list, as well as an option to open the chart in different views.
RSI 2-Level Scanner is a practical MetaTrader 5 tool for monitoring multiple symbols at the same time and detecting potential RSI reversal setups.
Unlike a standard RSI scanner that only shows overbought or oversold values, this indicator uses a two-level confirmation system.
For a LONG setup, the scanner first waits until RSI reaches the lower ARM level. After that, it waits for RSI to recover above the TRIGGER level.
For a SHORT setup, the logic works in the opposite direction.
This helps filter simple RSI extremes and focuses on situations where momentum starts to reverse.
How it works
LONG example:
RSI <= 30 -> ARMED -> RSI >= 40 -> TRIG
SHORT example:
RSI >= 70 -> ARMED -> RSI <= 60 -> TRIG
The scanner keeps the setup active until the selected reset level is reached.
Main Features
✅ Multi-symbol RSI scanner
✅ LONG and SHORT reversal detection
✅ Two-level ARM and TRIGGER logic
✅ Adjustable RSI period and timeframe
✅ Adjustable LONG and SHORT levels
✅ Separate reset levels
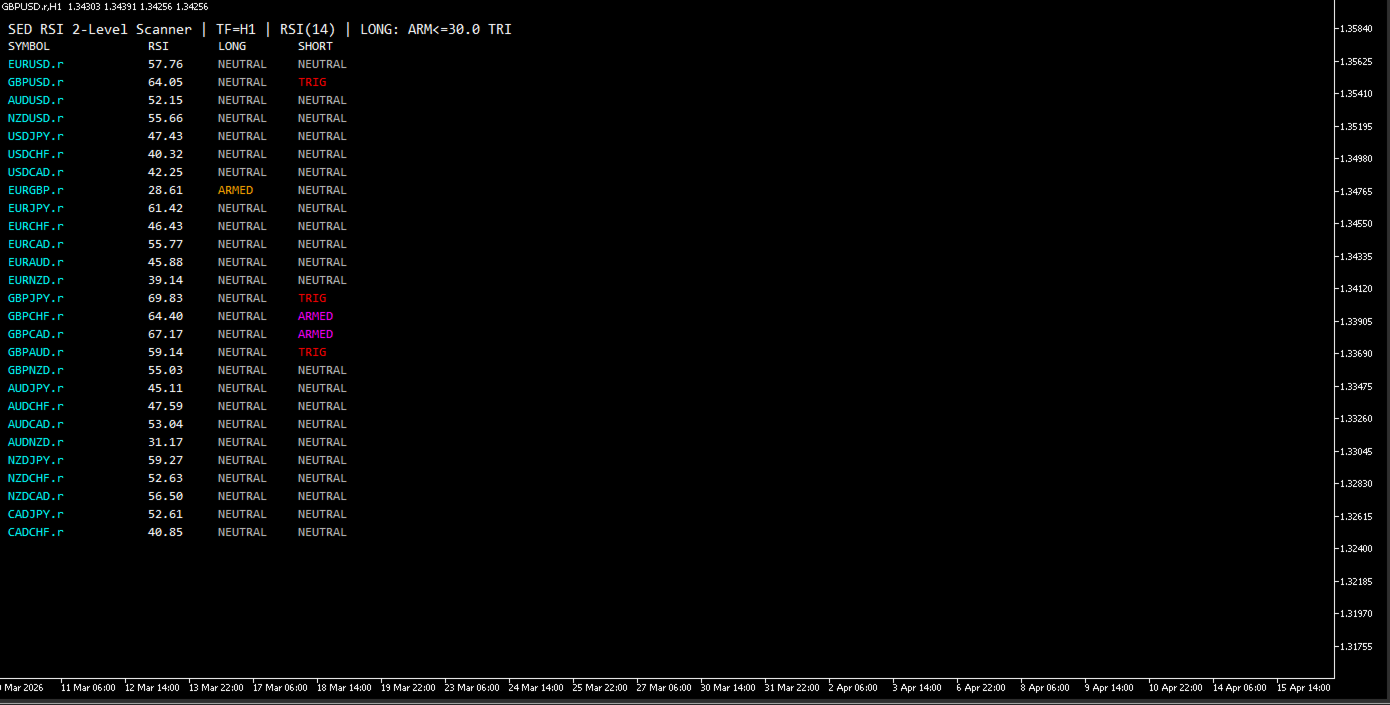
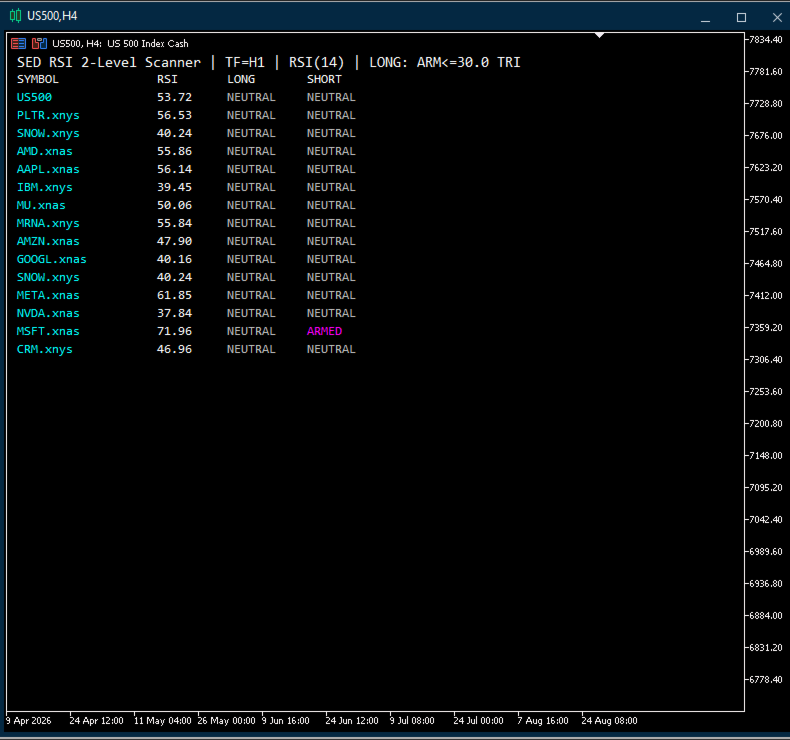
✅ Real-time dashboard directly on the chart
✅ Color-coded ARMED and TRIG states
✅ Popup alerts
✅ Optional push notifications
✅ Clickable symbols in the dashboard
✅ Click a symbol to instantly switch the current chart
✅ Custom comma-separated symbol list
✅ Low-resource timer-based scanning
✅ Designed for Forex, indices, stocks, CFDs and other MT5 instruments
Dashboard States
NEUTRAL – no active setup
ARMED – RSI has reached the first level and the scanner is waiting for confirmation
TRIG – RSI has reversed through the second level and the setup is confirmed
For example, if LONG ARM is set to 30 and LONG TRIGGER to 40:
RSI 28 -> ARMED
The scanner will remember this condition.
Later:
RSI 41 -> TRIG
This means RSI first entered an oversold area and then recovered, creating a potential bullish reversal signal.
Clickable Symbol Navigation
One of the most useful features is direct chart navigation.
Simply click any symbol name in the scanner dashboard and the current MetaTrader 5 chart will immediately switch to that instrument.
This makes it easy to scan many markets and quickly inspect only the symbols that are currently ARMED or TRIGGERED.
Default Logic
LONG:
NEUTRAL -> RSI <= 30 -> ARMED -> RSI >= 40 -> TRIG -> RSI >= 55 -> RESET
SHORT:
NEUTRAL -> RSI >= 70 -> ARMED -> RSI <= 60 -> TRIG -> RSI <= 45 -> RESET
All levels can be changed in the indicator settings.
Who is it for?
RSI 2-Level Scanner is suitable for traders who use:
- RSI reversal strategies
- Mean reversion
- Overbought / oversold setups
- Multi-symbol monitoring
- Forex scanning
- Index and stock CFD trading
Instead of opening many charts and checking RSI manually, the scanner provides a clear overview in one place and lets you jump directly to the chart with a single click.