QuantBlock SR
- Indicadores
- Versão: 1.1
- Ativações: 10

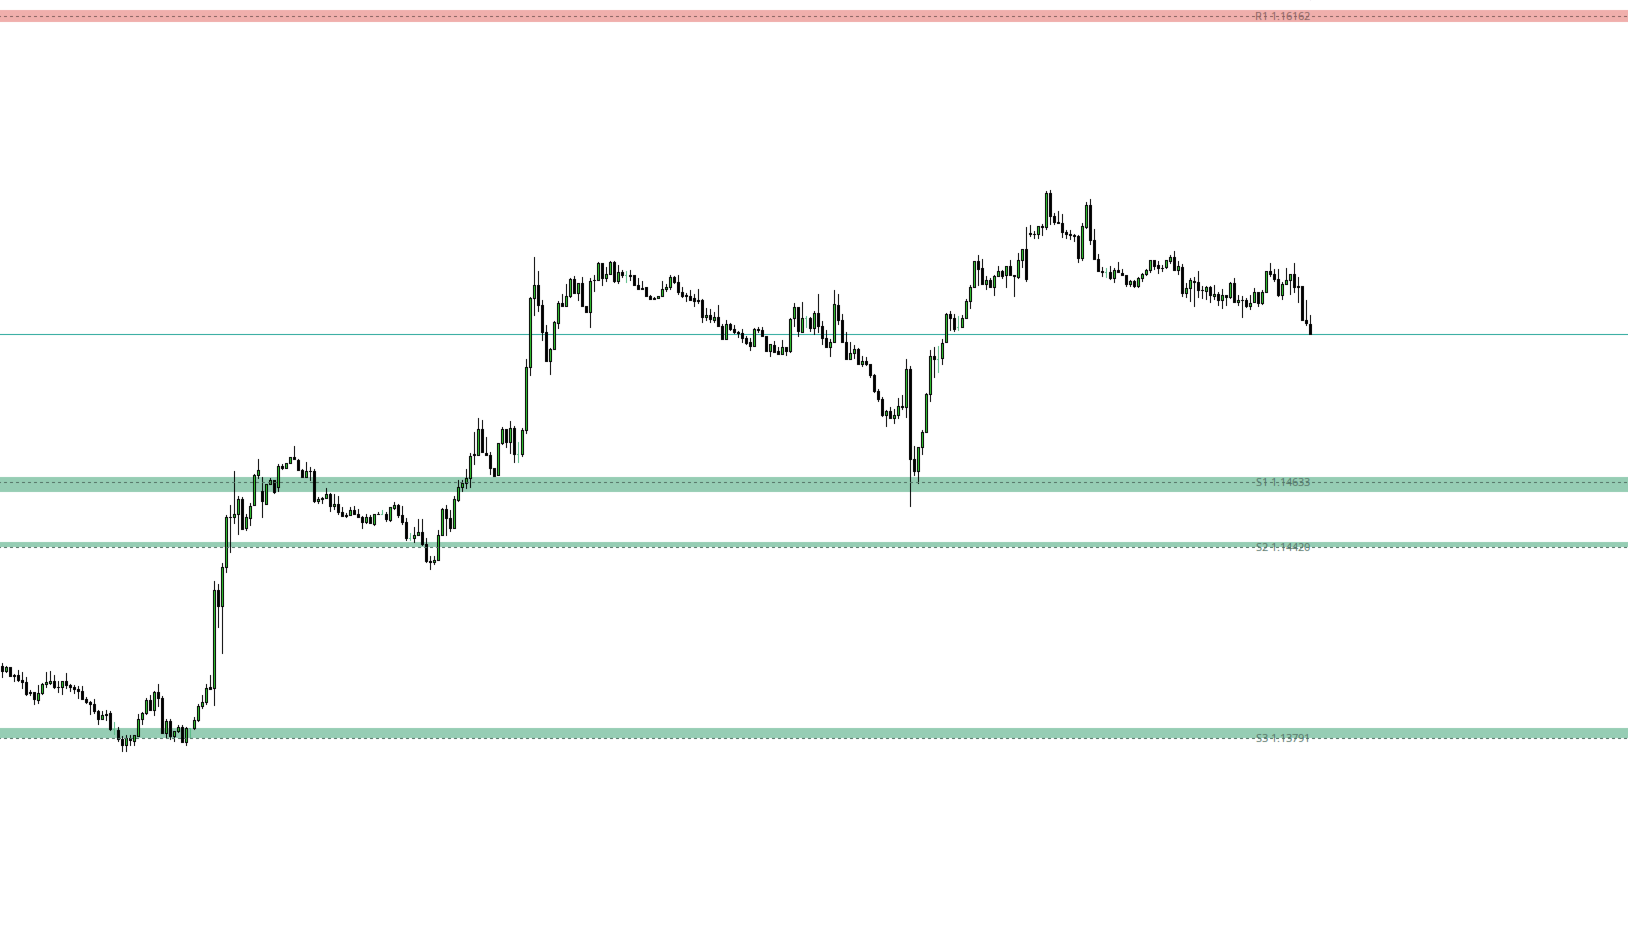
QuantBlock S&R — Dynamic Support & Resistance Zones (MetaTrader 5)
QuantBlock S&R is an indicator for MetaTrader 5 that draws objective support and
resistance zones: the levels come from higher-timeframe swing points, and each
one is confirmed on a lower timeframe before it ever reaches your chart.
--------------------------------------------------------------------------------
📌 KEY FEATURES AND ELEMENTS
--------------------------------------------------------------------------------
🔹 Level (Line)
The confirmed swing high and swing low points of the higher timeframe
(HTF - H4 by default). Objective, precise price levels.
🔹 Zone (Band)
The actual reaction price range, read off the lower timeframe (LTF). This
gives the band a realistic thickness grounded in market reaction.
🔹 Strict Confirmation
Only those swing points make it onto the chart that a later, measurable
market reaction has validated.
🔹 Automatic Labelling
Ordered S1/R1, S2/R2... names based on distance from the close of the last
completed HTF candle, with the exact price shown. The numbering therefore
stays fixed within an HTF candle instead of flickering tick by tick.
🔹 Dynamic Level Management
Displays a set number (N+N) of levels around price. Broken supports turn
into resistances automatically, following the polarity principle.
--------------------------------------------------------------------------------
⚡ WHY IT IS DIFFERENT (KEY BENEFITS)
--------------------------------------------------------------------------------
✔️ Non-Repainting Operation
Once established, a level is final: it never shifts and never disappears.
Only the bands update, and strictly forward - a zone always shows the
level's most recent confirmed reaction range.
✔️ Timeframe-Independent Calculation (TF-Independent)
The indicator works exclusively from the two source timeframes you set.
Switch to any chart timeframe (M1 through D1) and it displays exactly the
same levels and the same bands.
✔️ Adaptive Lookback (Deep History Search)
In sustained trends the structure does not run dry: if there is no freshly
confirmed level above or below price, the indicator automatically digs
deeper into past data until both sides fill up - or until the available
history runs out. The log reports how many passes it took.
--------------------------------------------------------------------------------
⚙️ INPUT SETTINGS
--------------------------------------------------------------------------------
▪️ Timeframes
- Level timeframe (HTF): the source of the major swing points (default: H4).
- Formation timeframe (LTF): the source of the reaction and the zone
thickness (default: M5). The level timeframe must be the higher of the two.
▪️ Level Count and History
- Number of levels displayed per side (default: 8+8).
- Lookback depth in bars (default: 10,000; 0 = full available history).
The same bar count applies to both source timeframes.
- Adaptive lookback can be switched on and off separately.
▪️ Band Modes (Zone Calculation Modes)
- Lazy (Confirmed): picks retested formations; less prone to moving, for
more stable zones.
- Quick (Reactive): focuses on the most recent reactions; adapts faster to
changing market conditions.
(Note: the selected mode only affects zone thickness, never the price of
the levels themselves.)
▪️ Display & Diagnostics
- Boxes, lines and labels can each be toggled independently.
- Customisable support and resistance colours.
- Optional detailed logging to the Experts tab (off by default): start-up
time, the number of levels found and actually drawn, the available
history per timeframe, and the result of the first draw.
--------------------------------------------------------------------------------
🛠️ HOW TO USE
--------------------------------------------------------------------------------
1. Attach the indicator to any MetaTrader 5 price chart.
2. Set the HTF (level) and LTF (formation) timeframes.
3. Choose how many levels to display per side.
4. Pick the band mode that suits your trading style (Lazy / Quick).
5. If you need more distant levels as well, increase the lookback value.
[i] Note: the initial calculation time depends on the lookback depth and the
LTF timeframe. The indicator runs as a chart overlay and requires no
external modules.
--------------------------------------------------------------------------------
🎯 WHO IT IS FOR
--------------------------------------------------------------------------------
Made for traders who insist on rule-based, non-repainting support and
resistance zones backed by actual market reaction - whether for day-to-day
chart analysis or for building a trading system on objective levels.