Aurum Structure Matrix PRO
- Indicadores
-
Hicham Mahmoud Almoustafa
 I am an algorithmic trading enthusiast focused on developing and testing Expert Advisors for MetaTrader 5.
My main area of interest is automated gold trading, including trend-following systems, momentum analysis, tick-volume confirmation, basket management, and risk-control mechanisms. - Versão: 1.7
- Atualizado: 31 julho 2026
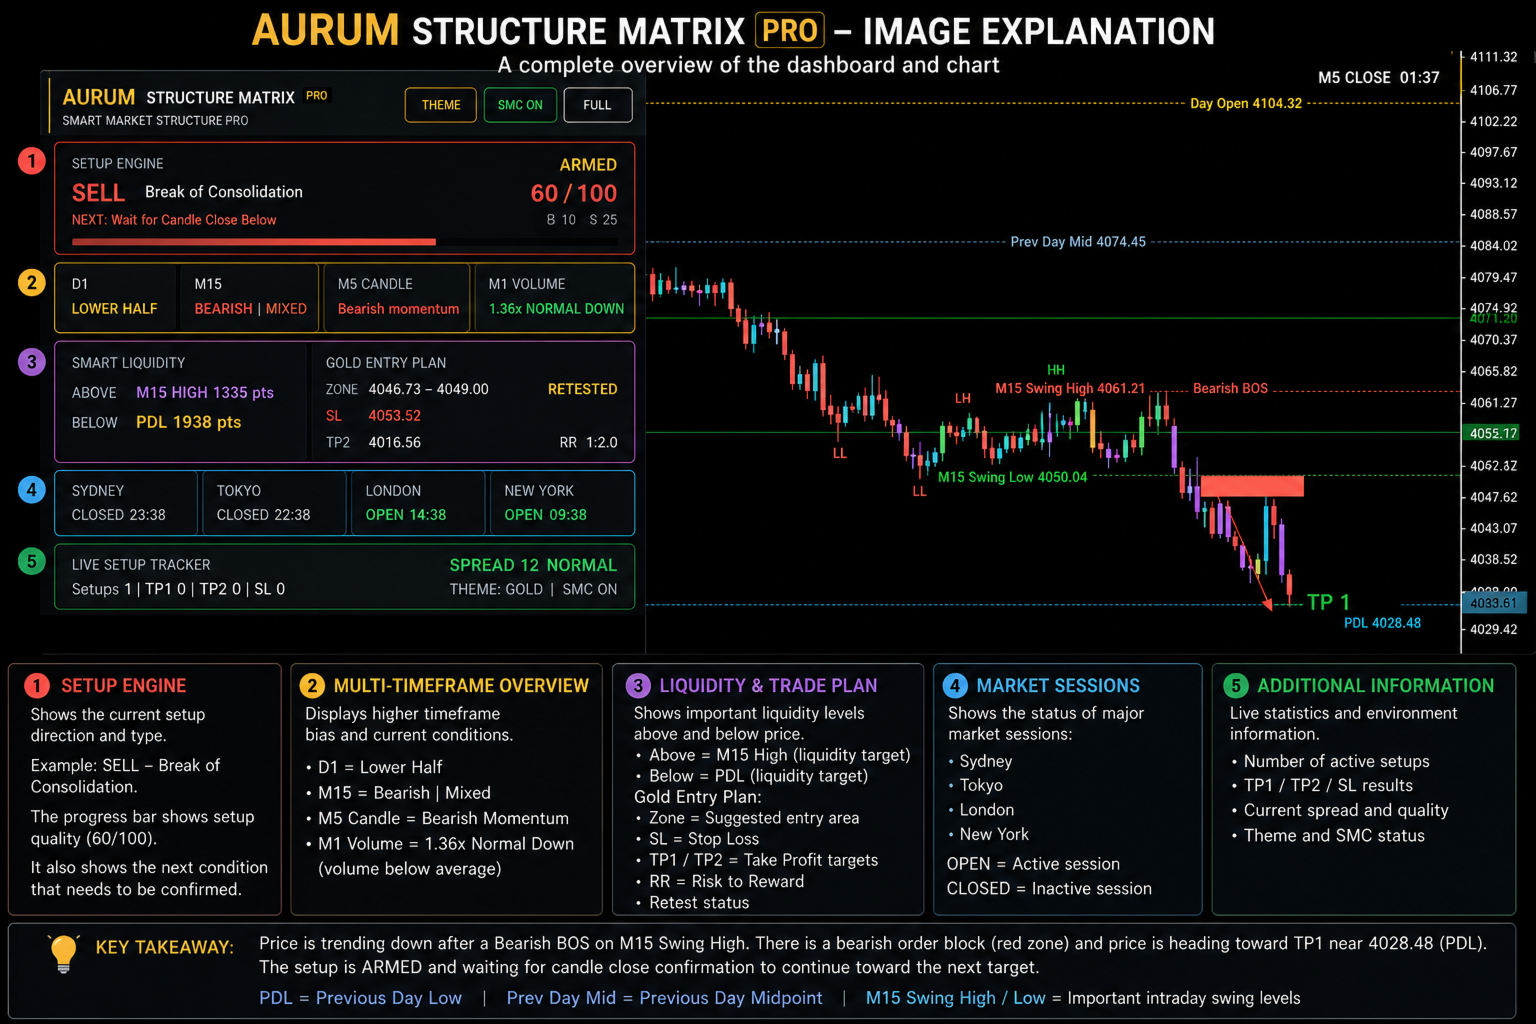
Aurum Structure Matrix PRO is a multi-timeframe analysis indicator for MetaTrader 5, built mainly for XAUUSD. It combines market structure, liquidity levels and trade-planning levels in one chart panel. It does not trade; it only draws and calculates.
Timeframes used: D1 (bias), M15 (structure and liquidity), M5 (setup conditions), M1 (tick volume). Recommended: XAUUSD on an M5 chart.
How the setup stages work
The dashboard shows one of five stages for the current setup:
- WAITING: no setup conditions are met.
- ARMED: the configured M5 conditions are met and an Entry Zone is drawn.
- RETESTED: price has returned into the zone.
- CONFIRMED: the retest is accompanied by the M1 tick-volume condition you configured.
- INVALIDATED: price closed beyond [describe the rule], so the zone is removed.
Market structure (M15)
Swing highs/lows are detected with [swing method, e.g. N bars left/right]. The indicator labels HH, HL, LH, LL, BOS (close beyond the last swing) and CHoCH (first break against the prevailing structure). Structure is shown as bullish, bearish or mixed.
Liquidity
Previous Day and Previous Week High/Low, Equal Highs/Lows (swing points within [X] points of each other), and M15 swing liquidity. A sweep is marked when [rule]. The dashboard shows the nearest level above and below price.
M1 tick volume
Tick count over [N] M1 bars around the zone is compared with its [average/period] and classified as weak, normal, strong or extreme using the thresholds in the inputs. M1 history must be loaded for this to work.
Trade-planning levels
For an active zone: Entry Zone, Stop Loss beyond [rule], TP1 and TP2 at [rule], the resulting risk-to-reward ratio, and the nearest liquidity target. These are calculated reference levels, not orders.
Dashboard: setup stage, Buy/Sell score ([how it is calculated]), D1/M15 direction, M5 candle condition, M1 volume condition, zone status, liquidity, planning levels, spread, and Sydney/Tokyo/London/New York session status. Layouts: Full, Compact, Minimal.
Inputs: [list each group: timeframes, swing length, equal-level tolerance, volume thresholds, colors/themes, layout, alerts, candle coloring]
Notes: [State whether labels/zones can change on the current bar or only after close.] Alerts are optional.
Disclaimer: This is an analytical tool only. It does not open, modify or close trades, and its output does not guarantee future results.