HighVolume SR Box

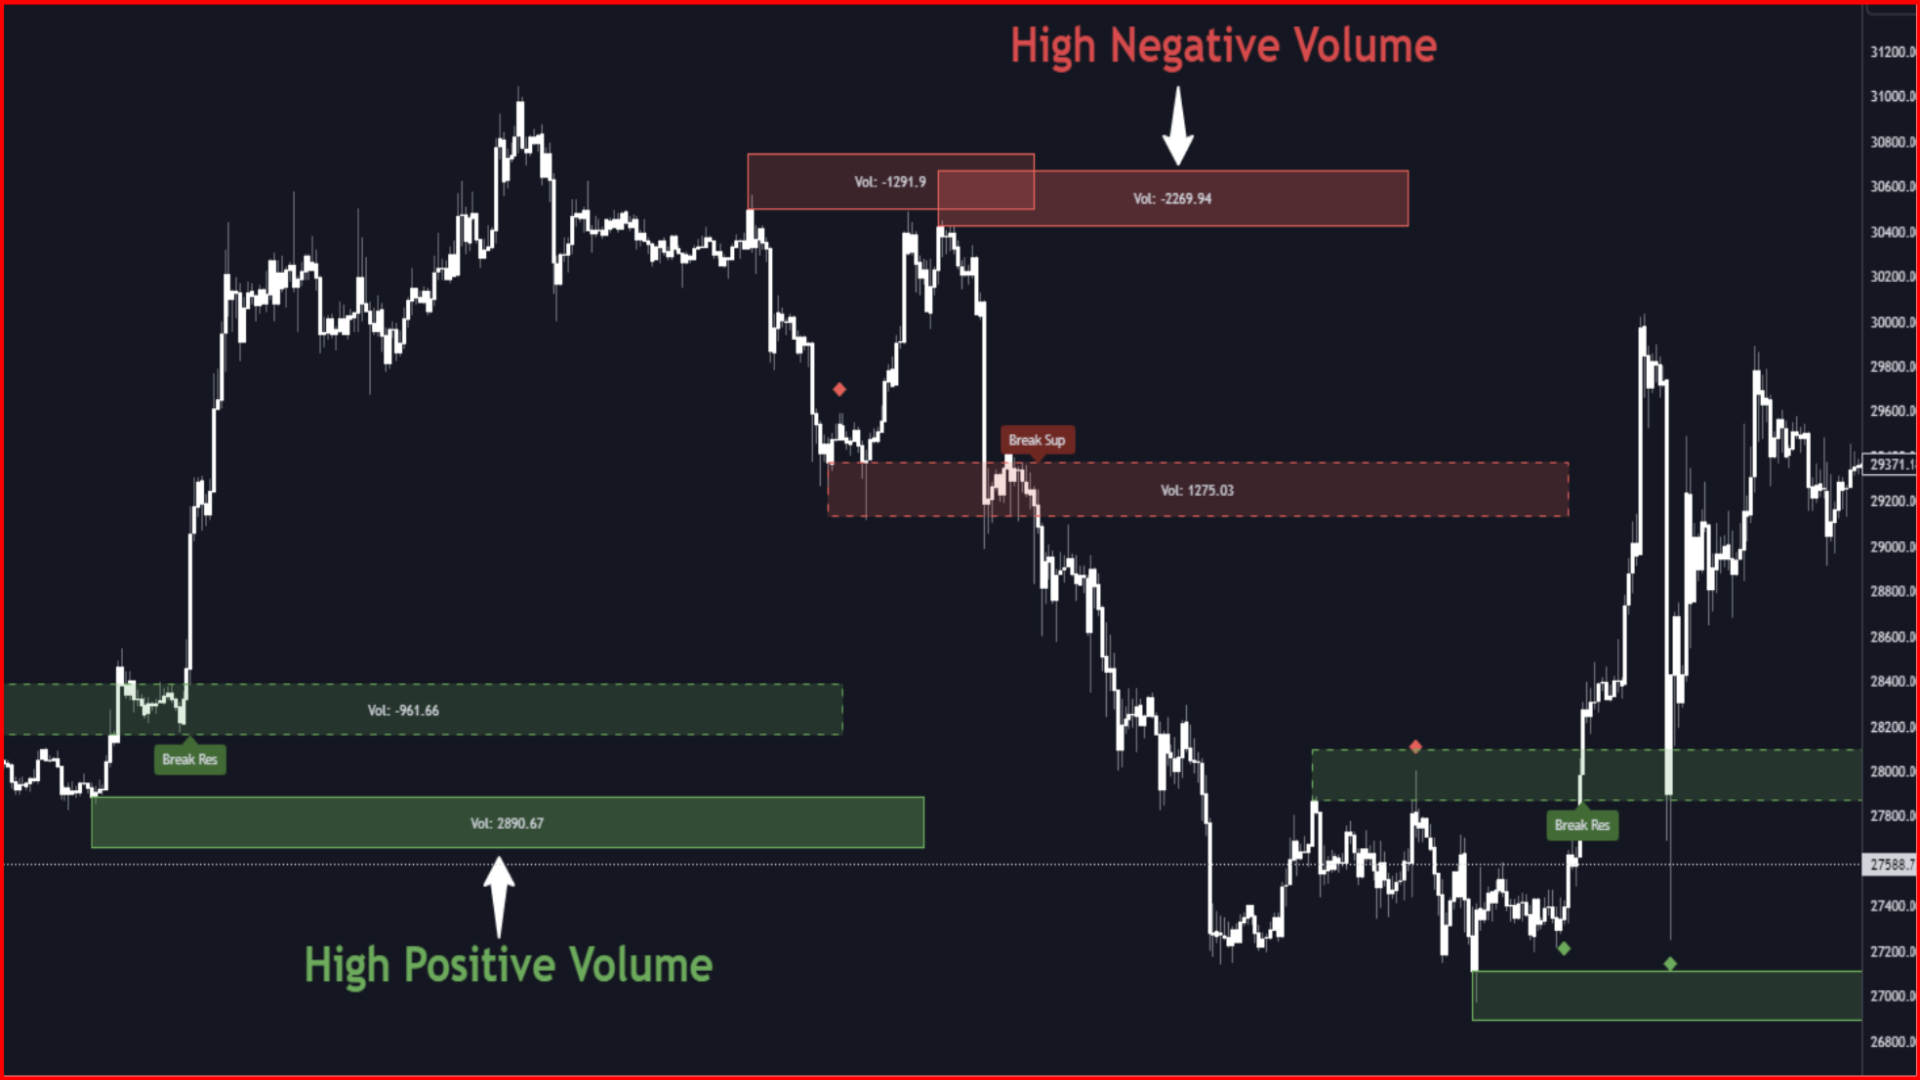
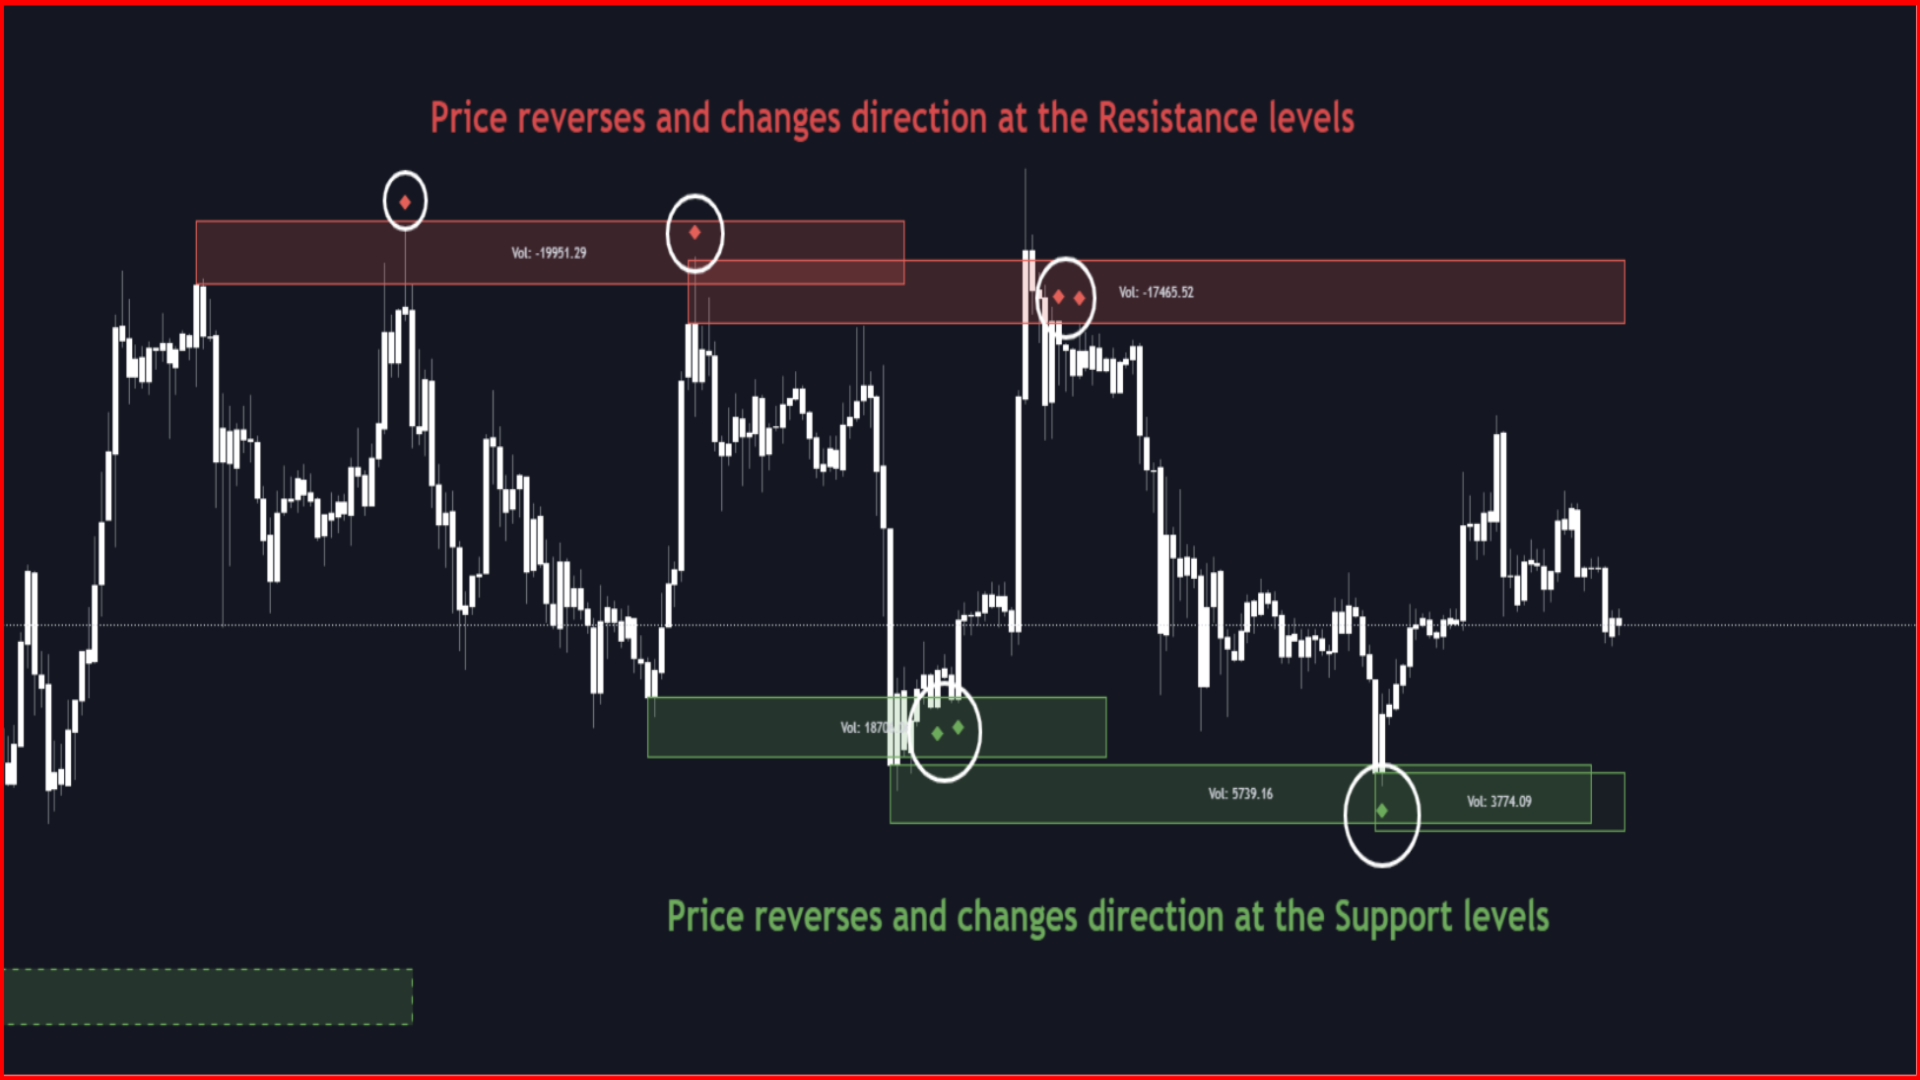
Support zones are created from confirmed pivot lows with positive volume conditions, while resistance zones are created from confirmed pivot highs with negative volume conditions. The visual boxes are color-coded to make analysis easier: green zones represent potential support areas, and red zones represent potential resistance areas.

The indicator also includes hold signals and breakout labels. Hold markers help traders observe when price reacts from a zone, while breakout labels show when a support or resistance area has been broken. When a resistance zone is broken, it may act as future support. When a support zone is broken, it may act as future resistance.

HighVolume SR Boxes is built with confirmed-bar logic. Important signals are confirmed only after the candle closes, and the indicator does not use the current live candle to confirm signals. This helps provide more stable historical signals and reduces repainting behavior.

Main features include automatic support and resistance boxes, volume-based zone filtering, adaptive box width, hold markers, breakout labels, and customizable settings for lookback period, volume filter length, and zone width.

This tool is suitable for Forex, gold, indices, commodities, and crypto CFD traders who use price action, support and resistance, breakout, retest, or reversal-based strategies.

Please note that this indicator is not a trading robot and does not guarantee profitable results. It should be used together with market structure, trend analysis, confirmation signals, and proper risk management.
Mais do autor
Supply Deman Range
Xuan Phat Tai Trieu
Supply Demand  is a market structure indicator that automatically identifies confirmed swing highs, swing lows, supply zones, demand zones, and break of structure events on MetaTrader 5 charts. The indicator helps traders study how price reacts around important historical areas without drawing every level manually. It can also display Point of Interest levels, ZigZag swing connections, and market structure labels such as Higher High, Higher Low, Lower High, and Lower Low. All major formations a
FREE
TrendCluster Matrix is an adaptive trend-following indicator designed to help traders identify market direction, trailing stop levels, and potential trend transition areas directly on the chart. Unlike a standard SuperTrend with one fixed multiplier, this indicator analyzes multiple SuperTrend factor values at the same time. It then groups their recent performance into different clusters and selects a final adaptive factor based on the user’s chosen mode: Best, Average, or Worst cluster. This al
Fractal Market Structure CHoCH BOS MT5 Fractal Market Structure CHoCH BOS MT5 is a price-action indicator designed to identify market structure through confirmed fractal formations. Instead of relying only on traditional swing-point calculations, the indicator analyzes structured candle patterns to locate important highs and lows, detect changes in directional behavior, and display relevant market structure events directly on the chart. The indicator can identify bullish and bearish Break of Str
Market Structure Leviathan Market Structure Leviathan  is a price-action indicator designed to present important structural movements directly on the trading chart. It automatically detects confirmed swing highs and swing lows, classifies market structure, identifies structural breakouts, and displays optional 50% retracement levels between significant price points. The indicator helps traders understand whether the market is forming higher highs, higher lows, lower highs, or lower lows. This in
Filtro:
Sem comentários
Responder ao comentário