TrendCluster Matrix
- Indicadores
- Versão: 1.0
- Ativações: 5

TrendCluster Matrix is an adaptive trend-following indicator designed to help traders identify market direction, trailing stop levels, and potential trend transition areas directly on the chart.
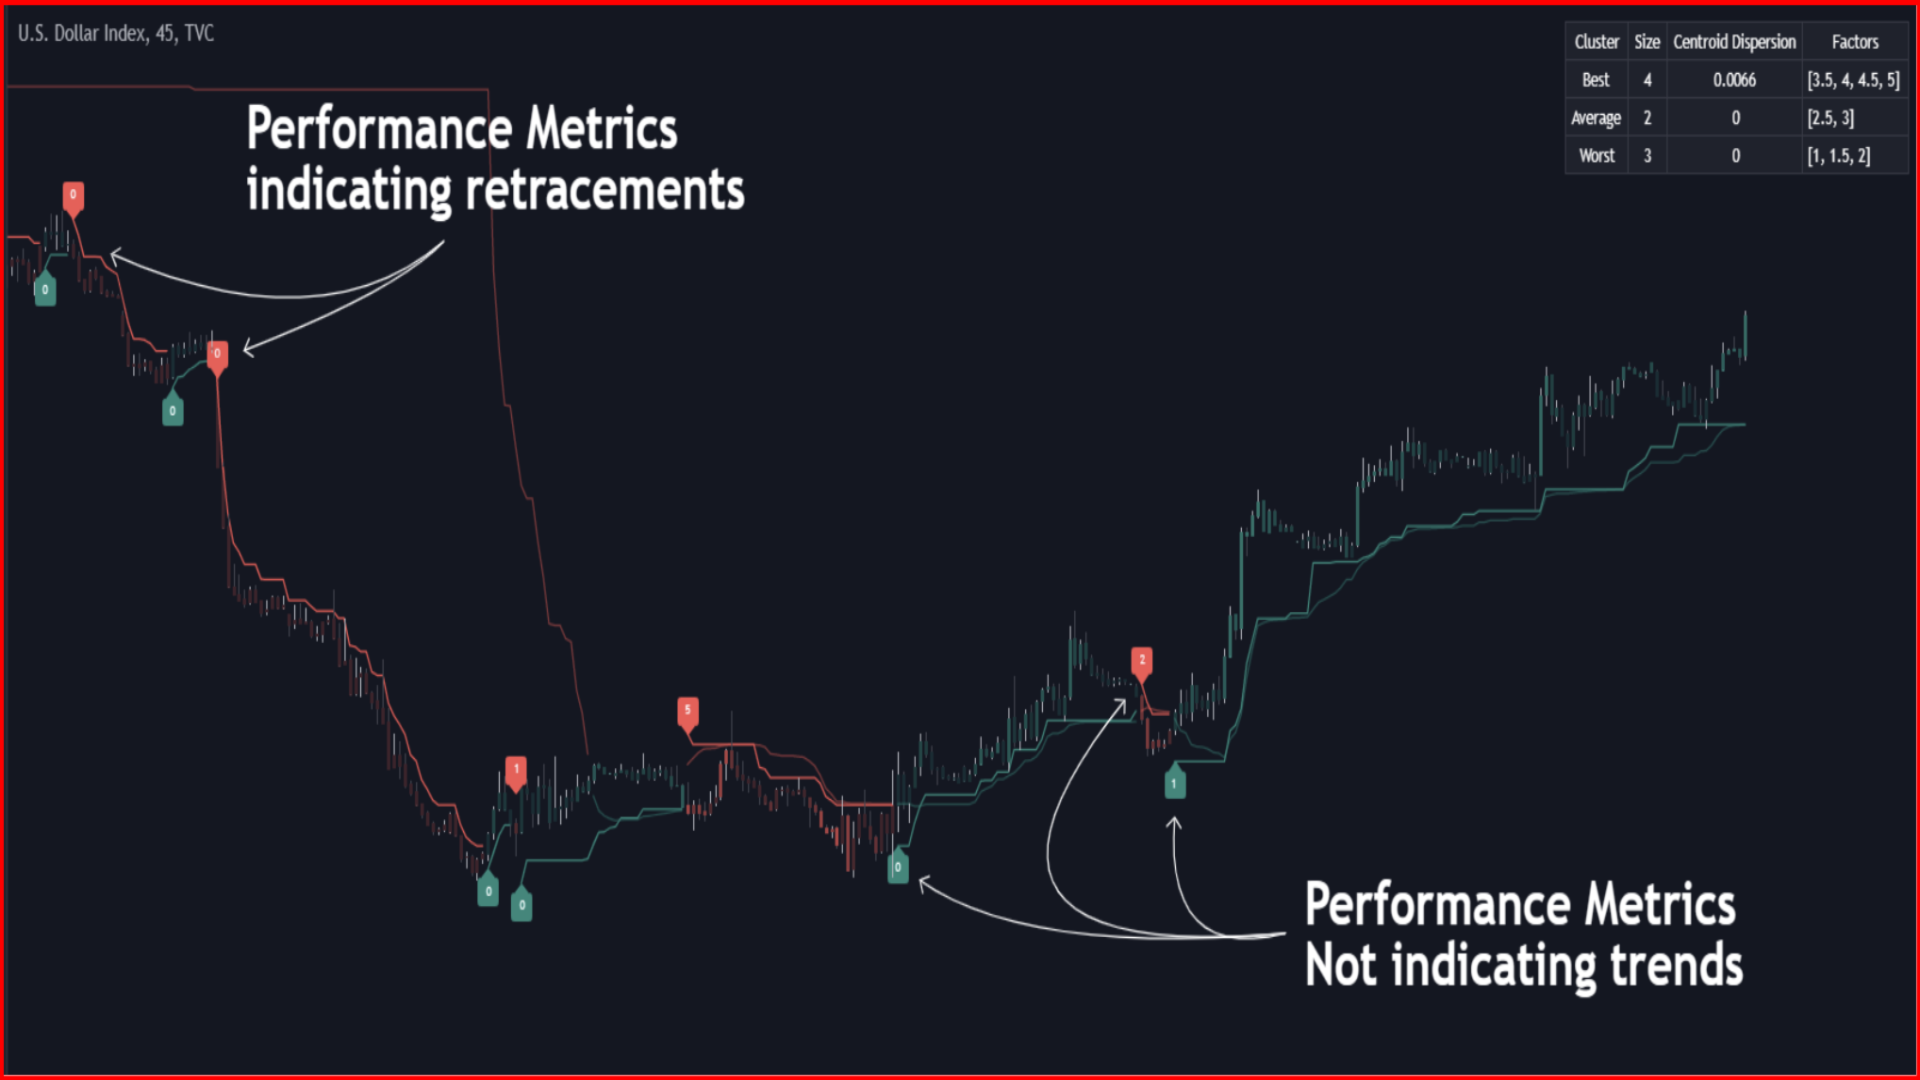
Unlike a standard SuperTrend with one fixed multiplier, this indicator analyzes multiple SuperTrend factor values at the same time. It then groups their recent performance into different clusters and selects a final adaptive factor based on the user’s chosen mode: Best, Average, or Worst cluster. This allows the trailing stop to adjust more dynamically to changing market conditions.
The indicator displays a SuperTrend trailing stop line, an adaptive moving average of the trailing stop, optional candle coloring, performance-based signal labels, and an on-chart dashboard showing cluster information. The dashboard helps traders understand how different factor groups are behaving, including cluster size, factor distribution, and performance dispersion.
Signals are generated only after a candle is closed. The indicator does not use future bars to confirm signals and does not change confirmed historical signals. This makes it suitable for traders who prefer clean non-repaint trend-following tools for manual analysis.
Main features:
-
Adaptive SuperTrend calculation using multiple factor values
-
K-Means inspired clustering logic for factor selection
-
Best, Average, or Worst cluster selection mode
-
Non-repaint confirmed signals on closed candles
-
Trailing stop line for trend direction analysis
-
Adaptive moving average of the trailing stop
-
Optional candle coloring based on trend performance
-
Performance score labels on trend change signals
-
Dashboard with cluster size, factor groups, and dispersion data
-
Optimized calculation window for better chart performance
Input settings:
ATR Length controls the ATR period used for SuperTrend calculation.
Factor Range defines the minimum and maximum multiplier values used to test different SuperTrend variations.
Step controls the increment between each factor value inside the selected range.
Performance Memory controls how much recent price movement affects the performance calculation. Higher values produce a smoother, longer-term performance response.
From Cluster allows the user to select which cluster should be used for the final adaptive factor: Best, Average, or Worst.
Maximum Iteration Steps limits the number of clustering iterations.
Historical Bars Calculation limits how many historical bars are used during calculation to improve performance.
This indicator can be used for trend direction, trailing stop analysis, support and resistance observation, and filtering trade setups. It is not a trading robot and does not open or close trades automatically. Traders should combine it with their own strategy, risk management, and market confirmation before making trading decisions.