SMC Indicator Box

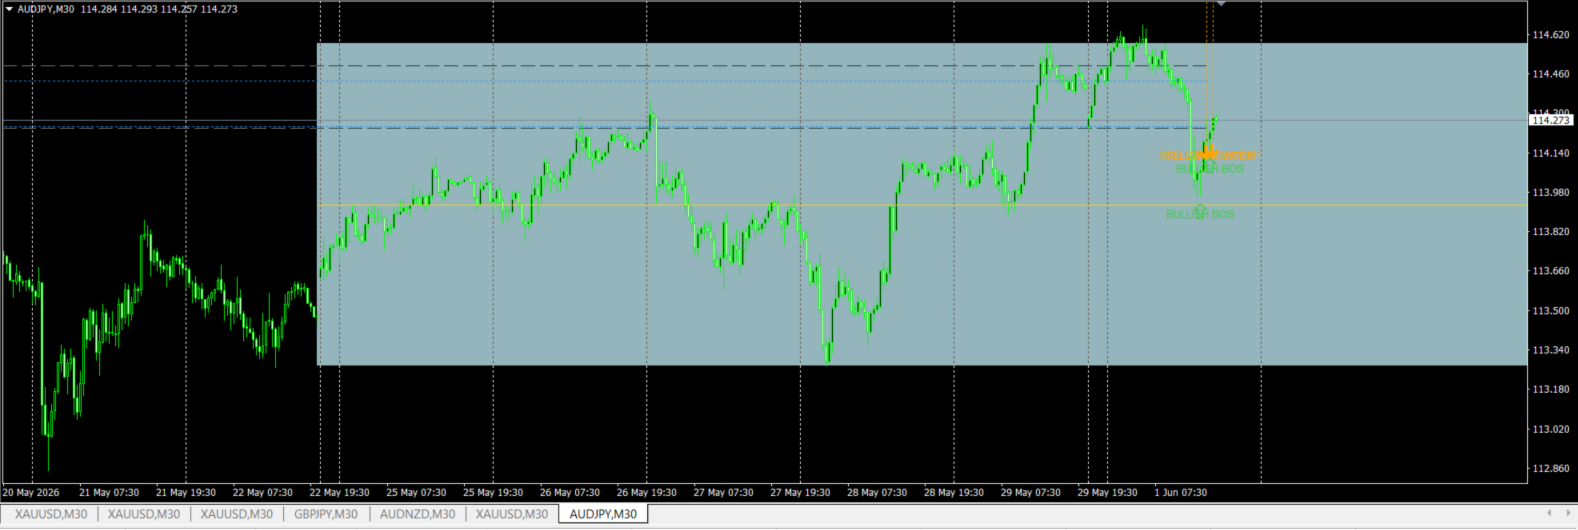
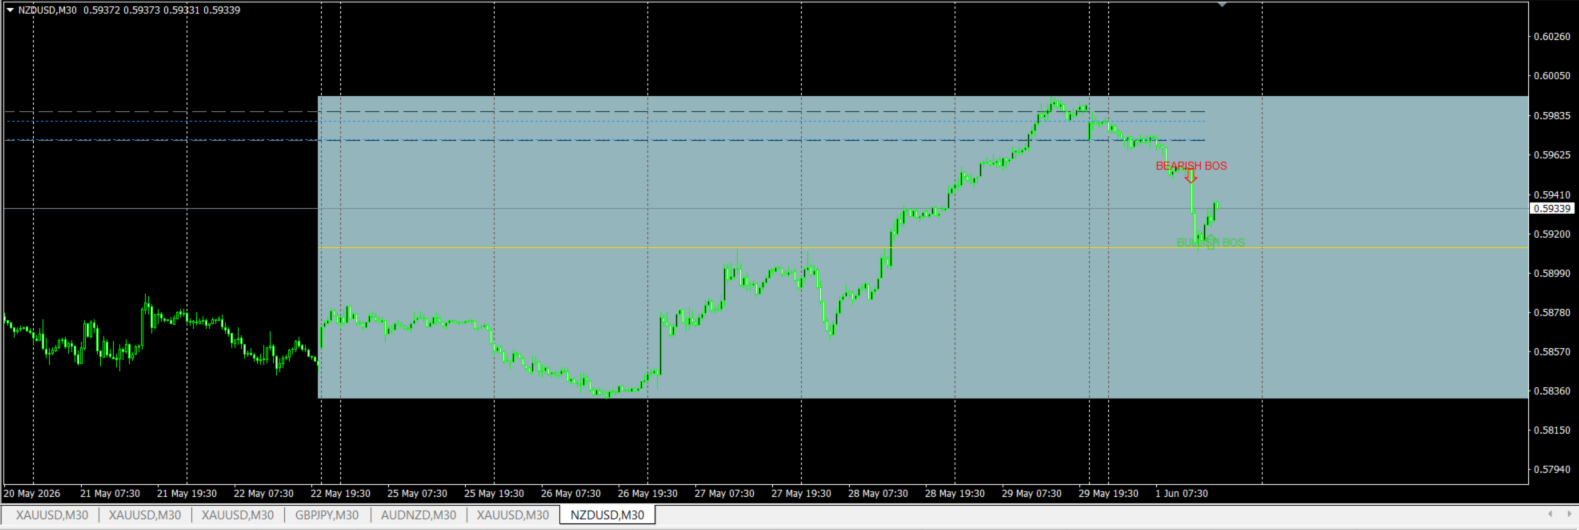
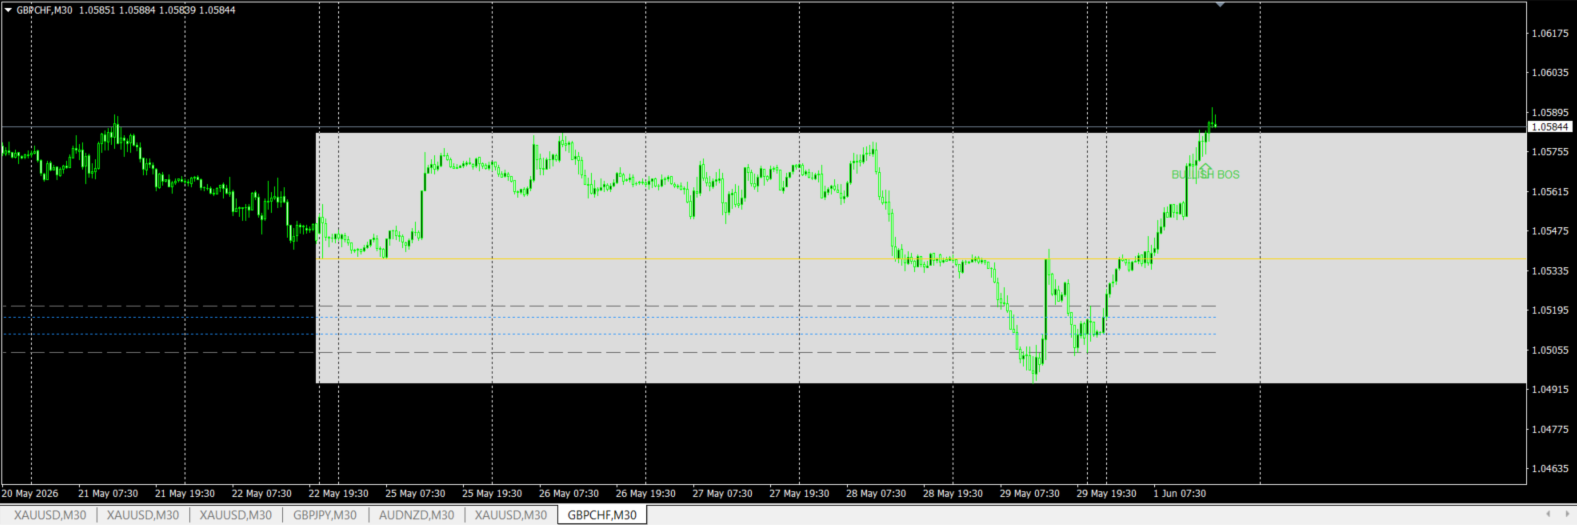
SMC Institutional Visualizer with Weekly Range Box - Detect Liquidity Sweeps, BOS, Order Blocks, FVGs & Weekly Key Levels

Complete Smart Money Concepts (SMC) indicator for institutional trading visualization. Detects Liquidity Sweeps, Break of Structure (BOS), Order Blocks, and Fair Value Gaps (FVG). Now includes Weekly Range Box showing last closed weekly candle's high, low, and midline. Fully customizable colors and styles. Perfect for price action and supply/demand traders.

Long Description

🔥 ADVANCED SMC INDICATOR + WEEKLY RANGE BOX 🔥

Professional Institutional Trading Visualizer for MetaTrader 4

Transform your charts with institutional-grade Smart Money Concepts (SMC) analysis. This powerful indicator automatically detects and visualizes key market manipulation patterns used by institutional traders and banks.

✅ KEY FEATURES:

📊 SMC COMPONENTS:

  • Liquidity Sweeps - Detects when price hunts liquidity below/above daily levels

  • Break of Structure (BOS) - Identifies trend changes with clear visual signals

  • Order Blocks (OB) - Shows institutional supply/demand zones with time-limited display

  • Fair Value Gaps (FVG) - Highlights imbalance zones for potential reversals

  • Daily Levels - Displays previous day's High, Low, Open & Close

📦 WEEKLY RANGE BOX:

  • Last closed weekly candle visualization

  • Full range OR body-only display options

  • Extend box into the future (customizable days)

  • Midline with independent styling

  • Price labels for High, Low & Mid levels

  • Bullish/Bearish color coding

🎨 CUSTOMIZATION:

SMC Settings:

  • Toggle each pattern ON/OFF independently

  • Custom colors for bullish/bearish signals

  • Adjust Order Block display duration

Weekly Box Settings:

  • Show/Hide weekly box

  • Body-only or full range selection

  • Custom border width & style

  • Midline toggle with independent color/width

  • Price labels with custom colors

  • Extend box up to 365 days forward

📈 HOW TO USE:

Liquidity Sweeps:

  • Look for sweeps below daily low (sell-side) or above daily high (buy-side)

  • Often precedes reversal moves

Break of Structure:

  • Confirms trend direction change

  • Use with Order Blocks for high-probability entries

Order Blocks:

  • Last bullish/bearish candle before BOS

  • Acts as support/resistance zones

Fair Value Gaps:

  • 3-candle imbalance pattern

  • Price often returns to fill these gaps

Weekly Box:

  • Major support/resistance levels

  • Midline acts as pivot zone

  • Great for swing trading and position management

🚀 PERFECT FOR:

  • Smart Money Concept traders

  • Supply & Demand traders

  • Price action traders

  • Swing traders

  • Position traders

  • ICT methodology followers

⚙️ TECHNICAL DETAILS:

  • Platform: MetaTrader 4 (MT4)

  • Style: Chart window indicator

  • Processing: Lightweight, optimized code

  • Updates: Real-time on each tick

  • Object management: Auto-cleanup to prevent clutter

💡 TIPS FOR BEST RESULTS:

  1. Use on higher timeframes (15M to Daily) for SMC patterns

  2. Combine weekly box levels with daily SMC signals

  3. Look for confluences between multiple patterns

  4. Adjust OB display bars based on your trading timeframe

  5. Use body-only mode for cleaner weekly levels

Produtos recomendados
Jerk Indicator
Safwan Rushdi Khalil Arekat
5 (1)
In physics, "Jerk" is the third time-derivative of position, with acceleration being the second derivative and velocity the first derivative. In technical analysis, the first derivative of price is the price momentum, with the second derivative,acceleration, being seldom used and the third derivative virtually unknown. The magnitude frequency response of a digital differentiator is a positive-slope straight line passing through zero frequency. Therefore, every instance of a digital signal differ
FREE
Super trend is one of the best trend indicators in metatrader 4 (MT4). Triple SuperTrend indicator is an indicator that consist of three super trend indicator that can be aranged. This indicator is built by mql4 language and doesn't provided by MT4 platform. Highly recommended using EMA SuperTrend Strategy Indicator if you want to get better result in here: https://www.mql5.com/en/market/product/91664 This indicator is easy to use, power full and has many benefits, there are: Using three indic
FREE
Period Breakout Indicator
Komang Putra Riswanjaya
5 (1)
Overview The Period Breakout Indicator is a versatile tool designed for traders seeking to identify breakout opportunities based on customizable time periods. This indicator automatically determines the highest and lowest prices within a user-defined period, allowing you to tailor it precisely to your trading strategy. Key Features Customizable Time Periods: Define the start and end times based on your preferred trading hours or any specific period. The indicator will then calculate the highest
FREE
The Icarus Reversals(TM) FREE Indicator is a powerful tool to identify high-probability reversal points, across all instruments.  The Reversals Indicator provides traders and investors with a simple-to-use and highly dynamic insight into points of likely price-action reversals.  Generated by a unique proprietary code-set, the Reversals Indicator (FREE version) generates long and short trade signals, which can be customised for key inputs and colourisation. Settings of the Icarus Reversals FREE h
FREE
Latest Changes in 1.6 :  Added Signal Modes input. Mode 1 : HPF positive go long blue, HPF negative go short red. Mode 2 : slow envelope only, HPF above upper envelope go long blue, HPF below lower envelope go short red. Mode 3 : HPF above both upper envelopes - go long blue, HPF below both lower envelopes go short red. Mode 4 : Go long blue if HPF crosses above upper slow, but fast upper should be below slow upper at the time, exit when HPF crosses below upper fast, reverse logic for short red
FREE
SRP (Strong Retracement/Reversal Points) is a powerful and unique support and resistance indicator. It displays the closest important levels which we expect the price retracement/reversal! If all level are broken from one side, it recalculates and draws new support and resistance levels, so the levels might be valid for several days depending on the market! Key Features You can use it in all time-frames smaller than daily! Displays closest significant support and resistance levels Update the le
FREE
Introduction to Fractal Moving Average Fractal Moving Average indicator was designed as part of Fractal Pattern Scanner. Inside Fractal Pattern Scanner, Fractal Moving Average Indicator was implemented as multiple of chart objects. With over thousands of chart object, we find that it was not the best and efficient ways to operate the indicator. It was computationally too heavy for the indicator. Hence, we decide to implement the indicator version of Fractal Moving Average indicator to benefit o
FREE
The SFT Fibo Smart Pivot indicator is a powerful trading tool based on the Fibonacci Golden Ratio, designed to identify key support and resistance levels in the forex market. This indicator has the ability to pinpoint significant price levels that can serve as entry and exit points for trades. It enables traders to analyze the market more effectively and make well-informed decisions. The indicator uses the Fibonacci Golden Ratio to accurately determine support and resistance levels. These levels
FREE
UPD1 Fibo Levels
Vitaliy Kuznetsov
5 (3)
O indicador analisa o número especificado de velas e traça os níveis de Fibonacci com base no máximo-mínimo. Como os níveis estão se reorganizando, estamos interessados ​​no lado direito da faixa. Os ímãs de preço aos níveis e reagem ao toque. Use esta ferramenta para encontrar um ponto de entrada de tendência após uma correção. Se à esquerda vemos que os níveis aumentaram perfeitamente, podemos supor que encontramos o fim do movimento no ponto extremo. Todas as linhas são desenhadas por meio de
FREE
pivot points using by many traders and pivot levels most of the times are very helpfull . this indicator is a custom with internal parameters. it can show two times pivot (weekly and daily). you can choose periods total for each time showing pivots.( 1 week , 2 week ,...1day , 2day ,...) when use weekly and daily pivots , it can show you many support and resistance zones. if have proposal comment too me for upgrading indicator.
FREE
Shows on the chart a two moving averages histogram. It allows to send alerts to MetaTrader platform when the crossovers occurs. You can use it on any timeframe, moving averages settings can be adapted as well as the appearance and colors. The parameters for the indicator are Fast moving average period Slow moving average period Moving Average Mode Moving Average Price Alert on crossovers Histogram Bar Width Bullish Color Bearish Color
FREE
Big Figure Indicator
Vonjinirina Alfred Randrianiaina
"BIG FIGURE INDICATOR" identifica automaticamente e desenha linhas horizontais em gráficos de preços em níveis específicos, como números inteiros ou meio-números (por exemplo, 1.0000 ou 1.5000 em negociações de moedas). Esses níveis são considerados psicologicamente significativos porque representam números redondos nos quais grandes traders e investidores podem se concentrar, levando a potenciais níveis de suporte ou resistência. O indicador de grande figura pode ajudar os traders a identifica
FREE
It is a custom non-repaint indicator to identify trade opportunities in swing action as prices move within an upper and lower band. Inspired by the Keltner Channel, the most popular channel Indicator introduced by Chester Keltner. It is different with a Bollinger Bands. It represents volatility using the high and low prices, while Bollinger's studies rely on the standard deviation. The algorithm for this indicator is also available in the EntryMaximator EA. Including the option to use it or not.
FREE
Awesome Pivot Indicator
Komang Putra Riswanjaya
The Pivot Indicator is a vital tool for technical analysis used by traders in the financial markets. Designed to assist in identifying potential reversal points or trend changes, this indicator provides valuable insights into key levels in the market. Key features of the Pivot Indicator include: Automatic Calculations: The Pivot Indicator automatically calculates Pivot Point, Support, and Resistance levels based on the previous period's high, low, and close prices. This eliminates the complexity
FREE
SuperTrend Indicator
FXsolutions
4.83 (12)
This is an implementation of the well known SuperTrend Indicator. With this indicator you can see exactly the same values which will be alerted by the following SuperTrend Scanners: SuperTrend Scanner SuperTrend Scanner FREE Parameters SuperTrendATRPeriod: the period setting for the calculation of the SuperTrend SuperTrendMultiplier: the multiplier setting for the calculation of the SuperTrend
FREE
RaysFX Supertrend + Alert RaysFX Supertrend è un indicatore di tendenza superiore progettato per i trader che desiderano avere un vantaggio nel mercato. Questo indicatore utilizza una combinazione di CCI (Commodity Channel Index) e ATR (Average True Range) per identificare le tendenze del mercato e fornire segnali di trading accurati. Caratteristiche principali Indicatori CCI e ATR: Utilizza due degli indicatori più popolari e affidabili per identificare le tendenze del mercato e generare segnal
FREE
Super Channels
Muhammed Emin Ugur
Super Channels indicator is a channel indicator created by calculating support and resistance levels. It calculates by taking the average of support and resistance levels. After determining the number of candles, it takes the levels of the number of candles and creates an autonomous channel according to these levels. If you want to calculate how many candles, you must enter the number in the parameter section. Also, there are two types of modes in the indicator. The first is to calculate based o
FREE
TradingView Style Chart Watermark Transform your MetaTrader 4 charts to look as elegant and professional as TradingView. Are you tired of the default, plain look of MetaTrader? WaterMark MT4 is a lightweight, fully customizable indicator designed to enhance your charting experience by adding sleek, modern watermarks directly to your trading terminal. This indicator bridges the visual gap between standard MetaTrader charts and premium web based charting platforms. It allows you to display the cur
FREE
Pivot Points are a classic technical analysis indicator that calculates the central pivot point (PP) as well as support (S1–S3) and resistance (R1–R3) levels based on the previous day’s High, Low, and Close. The indicator allows you to: • identify key zones where the price may bounce or break through • determine the direction of the trend • find good entry points, as well as set stop loss and take profit levels Indicator settings: • enable/disable PP, R1/S1, R2/S2, R3/S3 • enable/disable price l
FREE
.................................if you need pivot point s levels............................... ............................this is a daily pivot point level creator........................... ...it is for daily pivots and show levels at times period H4 , H1 , M30 , M15 ,M 5... .................................also shows levels for 3 last days.............................. ................can use it with other indicators and see important levels...............
FREE
Indicador de Bandas de Fibonacci para Metatrader 4 . Este indicador funciona de forma similar a las conocidas Bandas de Bollinger clásicas, pero en lugar de usar la desviación estándar para trazar las bandas usa números de Fibonacci y el ATR (Average True Range). Puede usarse para trazar niveles de soporte y resistencia que pueden emplearse en sistemas de scalping de corto plazo y swing trading.  Las bandas del indicador son calculadas de la siguiente forma: Línea central : Media móvil de n peri
FREE
Free automatic Fibonacci is an indicator that automatically plots a Fibonacci retracement based on the number of bars you select on the BarsToScan setting in the indicator. The Fibonacci is automatically updated in real time as new highest and lowest values appears amongst the selected bars. You can select which level values to be displayed in the indicator settings. You can also select the color of the levels thus enabling the trader to be able to attach the indicator several times with differe
FREE
TickChart Indicator plots the tick line on the main window of MetaTrader. In the Lite version, the number of ticks is limited to 20 and the alert function described below is omitted.  The "tick-line" shows the most detailed, fastest and real-time activities of the market, which are usually hidden in bars or candles longer than 1 minute. Usually, several new tick-line segments appear while a bar of M1 time frame is completed. After the release of an important economic indicator, the number of tic
FREE
HiLoTren IQ7
Tjia Elisabeth Jasmine Canadi
3 (1)
HiLoTren IQ7 — Limites de Mercado Inteligentes e Mapeamento de Pivô Defina seus níveis de negociação com precisão de IA. HiLoTren IQ7 é um   indicador inteligente baseado em pivô   que plota automaticamente   pontos de pivô   , zonas   de resistência (R1–R3)   e   suporte (S1–S3)   diretamente no seu gráfico. Ele fornece uma estrutura visual clara para identificar   limites de mercado, zonas de reversão e níveis de continuação de tendência   — tudo calculado em tempo real. Principais Caracterí
FREE
BeST_ Classic Pivot Points is an MT4 Indicator that is based on the widely known and definitely classic Pivot Point of a market prices activity. A pivot point is calculated as an average of significant prices (high,low,close) from the performance of a market in the prior trading period. If the market in the following period trades above the pivot point it is usually evaluated as a bullish sentiment, whereas trading below the pivot point is seen as bearish. A pivot point and the associated suppo
FREE
This Expert advisor does not do any trade, but it scans the whole symbols in your market watch and scan each shares one by one in different timeframes and at the end it shows you which symbol in which timeframe has a powerful engulfing candle. Furthermore, you can define a MA period and a high and low RSI limit, and it shows you which symbols in which timeframe is going to cross the adjusted moving average, and which symbol in which timeframe is going to cross high or low limit of the RSI.  The
FREE
Newlevel
Sergey Nanov
Indicator. Zones of support and resistance levels The most reliable tool in the hands of any technical analyst is support and resistance levels.It is these levels that magically work in the market, because the price then bounces off them, on the contrary, gaining maximum acceleration, punching them and striving for a new price point.However, in practice, many beginners face enormous difficulties in building them.This is due to the fact that the price may react quite differently to them, and ofte
FREE
Multi Timeframe ZigZag Indicator
Salman A A A T Bakhash
5 (2)
Description: This indicator draw ZigZag Line in multiple time frame also search for Harmonic patterns before completion of the pattern. Features: Five instances of ZigZag indicators can be configured to any desired timeframe and inputs. Draw Harmonic pattern before pattern completion. Display Fibonacci retracement ratios. Configurable Fibonacci retracement ratios. Draw AB=CD based on Fibonacci retracement you define. You can define margin of error allowed in Harmonic or Fibonacci calculations
FREE
Trendy Stock is a price following indicator that uses Stochastic to show when the price is out of the oversold or overbought areas.  The algorithm allows you to stay longer in a trend where the bulls or bears are in control. The indicator changes color immediately the price exits oversold/overbought state. In short, the downtrend [red] bars start to paint when the buying pressure decreases while the uptrend [green] bars form as the buy pressure kicks in.  For MT5 version, follow ::     https://w
FREE
This indicator is based on Mr. Mark Fisher's ACD strategy, based on the book "The Logical Trader." - OR lines - A lines - C lines - Daily pivot range - N days pivot range - Customizable trading session - Drawing OR with the desired time Drawing levels A and C based on daily ATR or constant number - Possibility to display daily and last day pivots in color zone - Displaying the status of daily PMAs (layer 4) in the corner of the chart - Show the order of daily pivot placement with multi-day pi
FREE
Os compradores deste produto também adquirem
Neuro Poseidon MT4
Daria Rezueva
4.95 (21)
Neuro Poseidon is a new indicator by Daria Rezueva. It combines precise trading signals with adaptive TP/SL levels - creating best possible trades as a result! Message me and get  Neuro Poseidon Assistant  as a gift to automize your trading process! What makes it stand out? 1. Proven profitability on all assets and timeframes 2. Only confirmed BUY and SELL signals present on the chart 3. Adaptive TP & SL levels generated by the software for each trade 4. Easy to understand - suitable for all
Scalper Inside PRO
Alexey Minkov
4.74 (68)
Scalper Inside PRO Scalper Inside PRO is an intraday trend and scalping indicator for MetaTrader 4 that uses an exclusive algorithm to quickly detect market direction and key target levels. It automatically calculates entry, exit and multiple profit targets, and shows detailed performance statistics so you can see how different instruments and strategies performed. This helps you choose the most suitable trading instruments for the current market conditions. Additionally, you can easily integrat
M1 Sniper
Oleg Rodin
5 (23)
O M1 SNIPER é um sistema indicador de negociação fácil de usar. É um indicador de seta projetado para o período M1. O indicador pode ser usado como um sistema independente para scalping no período M1 e pode ser usado como parte do seu sistema de negociação existente. Embora este sistema de negociação tenha sido projetado especificamente para negociação no M1, ele também pode ser usado em outros períodos. Originalmente, desenvolvi este método para negociar XAUUSD e BTCUSD. Mas considero-o útil ta
Gann Made Easy
Oleg Rodin
4.84 (164)
Gann Made Easy é um sistema de negociação Forex profissional e fácil de usar, baseado nos melhores princípios de negociação usando a teoria do sr. W. D. Gann. O indicador fornece sinais precisos de COMPRA e VENDA, incluindo níveis de Stop Loss e Take Profit. Você pode negociar mesmo em movimento usando notificações PUSH. Entre em contato comigo após a compra para receber instruções de negociação e ótimos indicadores extras gratuitamente! Provavelmente você já ouviu muitas vezes sobre os métodos
O sistema PRO Renko é um sistema de negociação altamente preciso especialmente concebido para a negociação de gráficos RENKO. Trata-se de um sistema universal que pode ser aplicado a vários instrumentos de negociação. O sistema neutraliza eficazmente o chamado ruído de mercado, dando-lhe acesso a sinais de inversão precisos. O indicador é muito fácil de usar e tem apenas um parâmetro responsável pela geração de sinal. Você pode facilmente adaptar a ferramenta a qualquer instrumento de negocia
Trend Catcher ind
Ramil Minniakhmetov
5 (1)
INDICADOR TREND CATCHER O Indicador Trend Catcher analisa os movimentos de preços do mercado, utilizando uma combinação de indicadores de análise de tendências adaptativos, proprietários e personalizados pelo autor. Identifica a verdadeira direção do mercado, filtrando o ruído de curto prazo e focando a força do momentum subjacente, a expansão da volatilidade e o comportamento da estrutura de preços. Utiliza também uma combinação de indicadores personalizados de suavização e filtragem de tendê
Trend Lines PRO
Roman Podpora
5 (1)
LINHAS DE TENDÊNCIA PRO       Ajuda a entender onde o mercado está realmente mudando de direção. O indicador mostra inversões de tendência reais e pontos onde os principais participantes retornam ao mercado. Você vê     Linhas BOS     Análise de tendências e níveis-chave em prazos maiores — sem configurações complexas ou ruídos desnecessários. Os sinais não são repintados e permanecem no gráfico após o fechamento da barra. VERSÃO MT 5      -      Revela seu potencial máximo quando emparelhada co
Enigmera
Ivan Stefanov
5 (8)
ENIGMERA: O núcleo do mercado Importante: A demonstração do MQL5.com funciona no Strategy Tester e pode não refletir completamente a funcionalidade do Enigmera. Verifique a descrição, as capturas de tela e o vídeo para mais detalhes. Fique à vontade para me enviar uma mensagem com qualquer dúvida! O código do indicador foi completamente reescrito. A versão 3.0 adiciona novas funcionalidades e corrige erros acumulados desde o início do indicador. Introdução Este indicador e sistema de negociação
Dynamic Forex28 Navigator
Bernhard Schweigert
4.43 (7)
Dynamic Forex28 Navigator - A ferramenta de negociação Forex de última geração. ATUALMENTE 49% DE DESCONTO. Dynamic Forex28 Navigator é a evolução dos nossos indicadores populares de longa data, combinando o poder de três em um: Indicador Advanced Currency Strength28 (695 avaliações) + Advanced Currency IMPULSE com ALERTA (520 avaliações) + Sinais CS28 Combo (Bônus). Detalhes sobre o indicador https://www.mql5.com/en/blogs/post/758844 O que o Next-Generation Strength Indicator oferece?  Tudo
Este indicador é um indicador para análise automática de ondas que é perfeito para negociações práticas! Caso... Nota:   Não estou acostumado a usar nomes ocidentais para classificação de ondas. Devido à influência da convenção de nomenclatura de Tang Lun (Tang Zhong Shuo Zen), nomeei a onda básica como   uma caneta   e a banda de onda secundária como   um segmento   . ao mesmo tempo, o segmento tem a direção da tendência.   O segmento de tendência principal   é nomeado (esse método de nomencl
RFI levels PRO
Roman Podpora
5 (1)
O indicador mostra com precisão os pontos de reversão e as zonas de retorno de preço onde o   Principais players . Você identifica onde novas tendências estão se formando e toma decisões com máxima precisão, mantendo o controle sobre cada negociação. VERSION MT5     -     Revela seu potencial máximo quando combinado com o indicador   TREND LINES PRO. O que o indicador mostra: Estruturas de reversão e níveis de reversão com ativação no início de uma nova tendência. Exibição dos níveis de   TAKE
Genesis Matrix Pro is a professional multi-timeframe trend detection indicator designed to help traders identify high-quality market alignment with clarity and structure. It combines 12 different technical indicators into one visual alignment matrix, allowing traders to quickly see when market conditions are bullish, bearish, or neutral. A signal is generated only when the selected strategies are aligned, helping reduce noise and improve decision-making. PLEASE CONTACT ME AFTER PURCHASE TO GET
Este produto foi atualizado para o mercado de 2026 e otimizado para as versões mais recentes do MT5. AVISO DE ATUALIZAÇÃO DE PREÇO: Smart Trend Trading System está atualmente disponível por $99 . O preço aumentará para $199 após as próximas 30 compras . OFERTA ESPECIAL: Após comprar o Smart Trend Trading System, envie-me uma mensagem privada para receber o Smart Universal EA GRÁTIS e transformar seus sinais do Smart Trend em operações automatizadas. Smart Trend Trading System é um sistema de tr
MTF Supply Demand Zones
Georgios Kalomoiropoulos
4.82 (22)
Próxima geração de zonas automatizadas de oferta e demanda. Algoritmo novo e inovador que funciona em qualquer gráfico. Todas as zonas estão sendo criadas dinamicamente de acordo com a ação do preço do mercado. DOIS TIPOS DE ALERTAS --> 1) QUANDO O PREÇO ATINGE UMA ZONA 2) QUANDO UMA NOVA ZONA É FORMADA Você não recebe mais um indicador inútil. Você obtém uma estratégia de negociação completa com resultados comprovados.     Novas características:     Alertas quando o preço atinge a zona d
PZ Trend Trading
PZ TRADING SLU
4.8 (5)
O Trend Trading é um indicador projetado para lucrar o máximo possível com as tendências que ocorrem no mercado, cronometrando retrocessos e rupturas. Ele encontra oportunidades de negociação analisando o que o preço está fazendo durante as tendências estabelecidas. [ Guia de instalação | Guia de atualização | Solução de problemas | FAQ | Todos os produtos ] Negocie mercados financeiros com confiança e eficiência Lucre com as tendências estabelecidas sem ser chicoteado Reconhecer retrocessos
Step into the world of Forex trading with confidence, clarity, and precision using   Gold Indicator   a next-generation tool engineered to take your trading performance to the next level. Whether you’re a seasoned professional or just beginning your journey in the currency markets, Gold Indicator equips you with powerful insights and help you trade smarter, not harder. Built on the proven synergy of three advanced indicators, Gold Indicator focuses exclusively on medium and long-term trends eli
MetaBands M4
Vahidreza Heidar Gholami
3.5 (6)
MetaBands utiliza algoritmos poderosos e únicos para desenhar canais e detectar tendências, a fim de fornecer aos traders pontos potenciais para entrar e sair de negociações. É um indicador de canal mais um indicador de tendência poderoso. Inclui diferentes tipos de canais que podem ser mesclados para criar novos canais simplesmente usando os parâmetros de entrada. O MetaBands usa todos os tipos de alertas para notificar os usuários sobre eventos de mercado. Recursos Suporta a maioria dos algori
Versão Swing M30/H1/H4 disponível Quer pegar os grandes movimentos? Gold Signal Swing Pro (M30/H1/H4). Alvo: $20-$80+ por operação. https://www.mql5.com/en/market/product/177643 KURAMA GOLD SIGNAL PRO (MT4) — Sistema Completo de Trading XAUUSD com Filtro de 7 Camadas, TP/SL Automático e Pontuação de Qualidade SEM REPINTURA. SEM REDESENHO. SEM ATRASO. Cada sinal é permanente. O que você vê é o que recebe. BÔNUS: Compre a licença vitalícia e receba AI
Current event:  https://c.mql5.com/1/326/A2SR2025_NoMusic.gif A. O que é A2SR ?   * É um indicador técnico importante (sem repintura, sem atraso). -- Orientação : -- em https://www.mql5.com/en/blogs/post/734748/page4#comment_16532516 -- e https://www.mql5.com/en/users/yohana/blog A2SR tem uma técnica especial para determinar os níveis de Suporte (demanda) e Resistência (oferta). Ao contrário da maneira comum que vimos na rede, o A2SR tem um conceito original na determinação dos níveis reais
BTMM State Engine Pro is a MetaTrader 4 indicator for traders who use the Beat The Market Maker approach: Asian session context, kill zone timing, level progression, peak formation detection, and a multi-pair scanner from a single chart. It combines cycle state logic with a built-in scanner dashboard so you do not need the same tool on many charts at once. What it does Draws the Asian session range; session times can follow broker server offset or be set in inputs. Tracks level progression (L
Price & Time Market Structure Indicator A professional market structure tool that analyzes waves through both price and time — not price alone. Main Description NeoWave PRO is a professional market structure indicator for MetaTrader 4 designed for traders who want to move beyond traditional one-dimensional wave tools such as ZigZag, swing indicators, and basic high/low systems. Most wave indicators analyze only one thing: Price. But a real market wave is not only a price movement. A true wave de
Quant Direction
Georgios Kalomoiropoulos
Quant Direction é uma ferramenta de análise de mercado tridimensional. Ela oferece uma análise de mercado totalmente objetiva, baseada em algoritmos, que calcula simultaneamente desvios percentuais precisos em diversos parâmetros. Desenvolvido com ferramentas avançadas de modelagem com inteligência artificial e rigorosamente testado, o algoritmo foi projetado para interpretar o mercado com precisão sem precedentes. Você pode analisar qualquer par de moedas ou instrumento financeiro em sua plataf
MonsterDash Harmonic Indicator is a harmonic pattern dashboard. It recognizes all major patterns. MonsterDash is a dashboard that displays all detected patterns for all symbols and (almost) all timeframes in sortable and scrollable format. Users can add their own user defined patterns . MonsterDash can open and update charts with the pattern found. Settings MonsterDash's default settings are good enough most of the time. Feel free to fine tune them to your needs. The color settings are for thos
NAM Order Blocks
NAM TECH GROUP, CORP.
3.67 (3)
Indicador de detecção de blocos de pedidos de multi-timeframe MT4. Características - Totalmente personalizável no painel de controle do gráfico, fornece interação completa. - Oculte e mostre o painel de controle onde quiser. - Detectar OBs em vários períodos de tempo. - Selecione a quantidade de OBs para exibir. - Interface de usuário de OBs diferente. - Filtros diferentes em OBs. - Alerta de proximidade OB. - Linhas ADR de alta e baixa. - Serviço de notificação (alertas de tela | not
O Apollo SR Master é um indicador de Suporte/Resistência com recursos especiais que tornam a negociação com zonas de Suporte/Resistência mais fácil e confiável. O indicador calcula as zonas de Suporte/Resistência em tempo real, sem qualquer atraso, detectando topos e fundos de preço locais. Em seguida, para confirmar a área de Suporte/Resistência recém-formada, o indicador exibe um sinal especial que indica que a zona pode ser considerada e usada como um sinal de VENDA ou COMPRA. Nesse caso, a f
PowerBall Signals é um indicador de sinais de COMPRA/VENDA baseado na ideia de usar zonas de suporte/resistência. O indicador detecta padrões de reversão especiais com base em zonas de suporte/resistência e fornece esses sinais em seu gráfico. A ideia principal do indicador é usar a análise MTF (Multi Time Frame) e fornecer sinais com base nos níveis do seu período atual e do próximo período superior. Este método permite prever possíveis reversões de preços em qualquer mercado, seja ele de moeda
Auto Optimized Parabolic RSI: Avançado Motor de Momentum 3D A maioria dos indicadores de varejo falha porque depende de parâmetros estáticos que quebram no momento em que a volatilidade do mercado muda. O Auto Optimized Parabolic RSI resolve o problema de "obsolescência do indicador" recalculando continuamente a sua própria vantagem matemática, trazendo uma adaptação quantitativa de nível institucional diretamente para o seu terminal MT5. A Vantagem Principal: Otimização 3D em Memória Personaliz
Sinal de tendência GoldRush Arrow O indicador Sinal de tendência GoldRush Arrow fornece uma análise precisa e em tempo real das tendências, adaptada para scalpers de alta velocidade e curto prazo em XAU/USD. Criada especificamente para o intervalo de tempo de 1 minuto, esta ferramenta exibe setas direcionais para pontos de entrada claros, permitindo que os scalpers naveguem em condições de mercado voláteis com confiança. O indicador consiste em setas de alerta PRIMÁRIAS e SECUNDÁRIAS. Os sin
PZ 123 Pattern
PZ TRADING SLU
1 (1)
O 123 Pattern é um dos padrões de gráficos mais populares, poderosos e flexíveis. O padrão é composto por três pontos de preço: fundo, pico ou vale e retração de Fibonacci entre 38,2% e 71,8%. Um padrão é considerado válido quando as quebras de preços além do último pico ou vale, momento em que o indicador traça uma flecha, sobe um alerta, e o comércio pode ser colocado. [ Guia de instalação | Guia de atualização | Solução de problemas | FAQ | Todos os produtos ] Sinais de negociação claros C
Bull versus Bear
Mohamed Hassan
4.5 (18)
Send us a message after your purchase to receive more information on how to get your  BONUS  for FREE  that works in great combination with Bull vs Bear ! Bull versus Bear is an easy-to-use Forex indicator that gives traders clear and accurate signals based on clear trend retests . Forget about lagging indicators or staring at charts for hours because  Bull vs Bear provides real-time entries with no lag and no repaint, so you can trade with confidence. Bull vs Bear  helps you enter trades during
Mais do autor
FNCD (Fisher Normalized Cumulative Deviation) Indicator Overview The FNCD is a momentum oscillator that combines statistical normalization with the Fisher Transform to create a highly responsive yet smooth indicator. It measures how far price has deviated from its mean in terms of standard deviations, then applies the Fisher Transform to normalize the distribution. The result is a bounded oscillator with clear crossover signals, displayed as a two-color histogram against a signal line. How It Wo
FREE
1. STRUCTURAL STRENGTH (0-9 Scale) The indicator analyzes each currency's position relative to its daily range across all 28 major pairs: Price position within the daily high/low range is converted to a 0-9 score using a statistical distribution model Base currency receives a score proportional to its strength Quote currency receives the inverse score (9 - base score) Final structural strength = average score across all pairs the currency participates in text STRONG currencies (score ≥ 6.0) → Po
FREE
Currency Strength Meter Dashboard Indicator Overview The Currency Strength Meter Dashboard is a professional-grade MetaTrader 4 (MT4) indicator developed by fxsignalspot.com . It provides traders with a comprehensive, real-time view of currency strength across 8 major currencies (USD, EUR, GBP, CHF, CAD, AUD, JPY, NZD) and 28 currency pairs. The indicator features an interactive on-chart dashboard with multiple display modes, customizable color-coded strength zones, trend/range meters, trade bia
FREE
Awesome SnR
Michael Oko Oboh
Awesome AO 4-Color AUTO REFRESH Indicator Advanced Momentum & Zero-Cross Visualization Tool for MT4 The Awesome AO 4-Color AUTO REFRESH indicator is a powerful upgraded version of the classic Awesome Oscillator designed for professional Forex traders who want cleaner momentum visualization, automatic chart marking, and better trade confirmation. Built by FXSignalSpot , this indicator transforms the standard AO into a more advanced trading assistant by adding: 4-color momentum histogram logic Aut
FREE
Trend Mega Profit Hilo is a powerful non-repainting trend momentum indicator designed to help traders identify bullish and bearish market direction with improved clarity and stability. It combines advanced price normalization, logarithmic momentum calculation, and exponential smoothing to deliver clean trend histograms, smoothed signal lines, and early reversal indications. This indicator is built specifically for traders who want: Stable non-repainting signals Cleaner trend visualization Reduce
CloudScalper Gold
Michael Oko Oboh
CloudScalper Gold: Especialista em Rompimento de Tendência de Alta Frequência O CloudScalper Gold é um Expert Advisor (EA) premium projetado especificamente para a alta volatilidade do mercado de Ouro (XAUUSD). Entrada de Precisão: Estratégia de Stop-Order Breakout para confirmar a intenção do preço. Defesa "Cloud": Sistema de fechamento de pânico em caso de "crash" do mercado. Break-Even Inteligente: Proteção contra falsos rompimentos movendo o SL para a entrada. Segurança da Conta: Pausa autom
Em poucas palavras Este indicador combina dois especialistas — o RSI e o MACD — num único sistema. Em vez de você olhar para dois gráficos separados e tentar adivinhar, ele toma a decisão por você: quando ambos os indicadores concordam, ele desenha uma seta (compra ou venda). O mais importante: as setas não são repintadas . Depois que aparece, fica no lugar. Você pode fazer backtesting e operar ao vivo com total confiança. O que significa "Combo" Normalmente, um trader olha para o RSI (que mede
This indicator is basically a zero-line momentum oscillator with built-in buy/sell crossover signals , designed to behave like a smoothed “pressure gauge” for price direction. What the indicator does It works in two layers: 1. Main Oscillator (Subwindow line) The yellow line (buffer 0) is a custom Fisher-style normalized momentum value . It is built from: Highest close over a period Lowest close over a period Mid price (Open + Close)/2 Recursive smoothing (previous values influence current
ENTRY AND EXIT ARROWS Indicator – Description The Entry and Exit Arrows indicator is a simple yet effective momentum-based tool designed to highlight potential buy and sell opportunities directly on the chart using visual arrows. It works by comparing two internal momentum measurements with different sensitivities. When both measurements align in the same direction, the indicator confirms a stronger directional bias and plots a signal. How It Works Buy Signal (Lime Arrow Below Candle): Appea
ForceWave
Michael Oko Oboh
Product Description ForceWave is an advanced momentum and trend-strength indicator designed to help traders identify market pressure, directional strength, and potential reversals with reduced repainting behavior. It analyzes price movement using a smoothed force-wave algorithm and displays bullish and bearish momentum directly in a separate indicator window for easier market interpretation. The indicator was developed with a focus on confirmed candle calculations, helping traders reduce false s
Visible Range High Low MT4 (Non-Repainting) Overview The Visible Range High Low indicator is designed to help traders instantly identify the most critical price levels on their chart. It dynamically scans a user-defined number of bars to detect the visible range's absolute high and low, marking these pivot points directly on the chart. Key Features: Non-Repainting Logic: Once a high or low is identified and plotted, it remains fixed, allowing for reliable back-testing and historical analysis. C
Binary Signal Arrow / Scalper Arrow Indicator This is a zero-lag momentum arrow indicator that plots buy/sell signals directly on the chart when momentum reaches exhaustion points. What it shows: Lime histogram = Bullish momentum Red histogram = Bearish momentum Up arrows (Blue/Yellow) = Buy signals (momentum strengthening or weakening at thresholds) Down arrows (Pink/Yellow) = Sell signals How it triggers: The indicator plots arrows when momentum changes character after sensitivity bars (defaul
SpeedMomentum
Michael Oko Oboh
Adaptive Tick Impulse Momentum Meter PRO Institutional Non-Repainting Momentum Engine for MT4 The Adaptive Tick Impulse Momentum Meter PRO is an advanced institutional-style momentum and speed detection indicator designed for traders who want to identify explosive market moves before they fully develop. Unlike traditional indicators that rely on lagging averages or simple candle analysis, this engine combines: Tick imbalance analysis Adaptive volatility intelligence Momentum acceleration Kalman
Trend Breakout Arrows Indicator The Trend Breakout Arrows Indicator is a momentum-based signal tool designed to identify potential bullish and bearish breakout opportunities. It displays clear arrow signals directly on the price chart, helping traders quickly recognize possible trend changes and continuation setups. Up Arrow (Buy Signal) A magenta up arrow appears below a candle when bullish momentum begins to strengthen. This signal indicates that buying pressure may be overtaking selling press
Em poucas palavras Este indicador combina dois especialistas — o RSI e o MACD — num único sistema. Em vez de você olhar para dois gráficos separados e tentar adivinhar, ele toma a decisão por você: quando ambos os indicadores concordam, ele desenha uma seta (compra ou venda). O mais importante: as setas não são repintadas . Depois que aparece, fica no lugar. Você pode fazer backtesting e operar ao vivo com total confiança. O que significa "Combo" Normalmente, um trader olha para o RSI (que mede
Filtro:
Sem comentários
Responder ao comentário