Awesome Pivot Indicator
- Indicadores
-
Komang Putra Riswanjaya
 I am a freelance developer specializing in MQL4, MQL5, and Pine Script, focused on building custom trading solutions for MetaTrader and TradingView platforms.
My services include:
* Expert Advisors (EA)
* Custom Indicators
* Trading Tools & Utilities
* Strategy Automation - Versão: 1.2
- Atualizado: 13 abril 2024
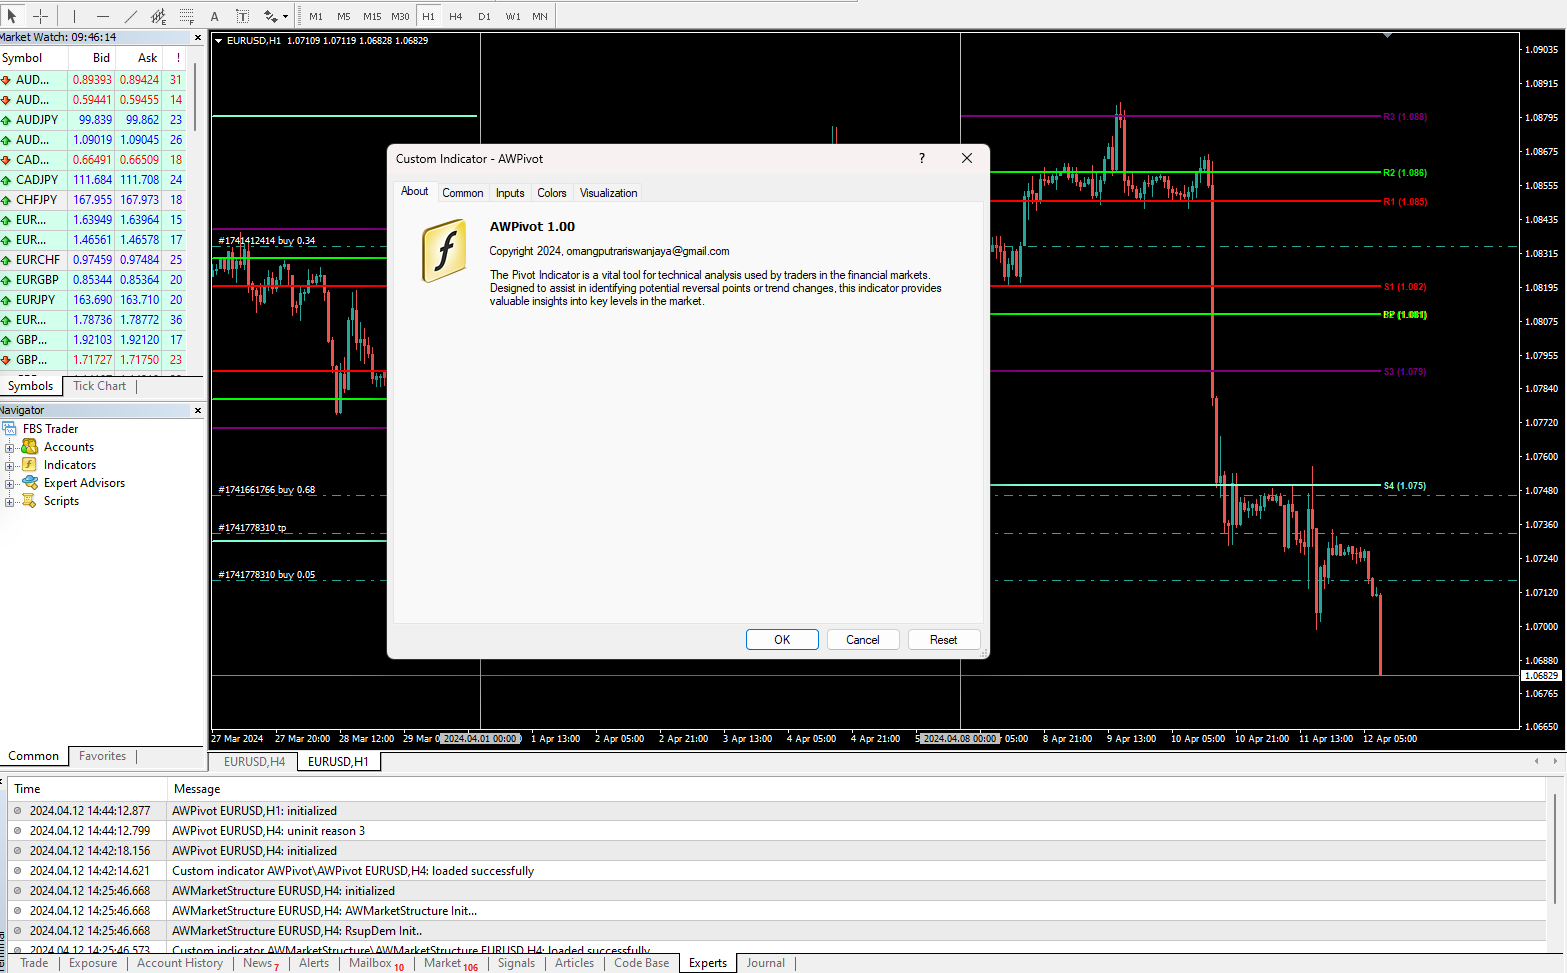
The Pivot Indicator is a vital tool for technical analysis used by traders in the financial markets. Designed to assist in identifying potential reversal points or trend changes, this indicator provides valuable insights into key levels in the market.
Key features of the Pivot Indicator include:
-
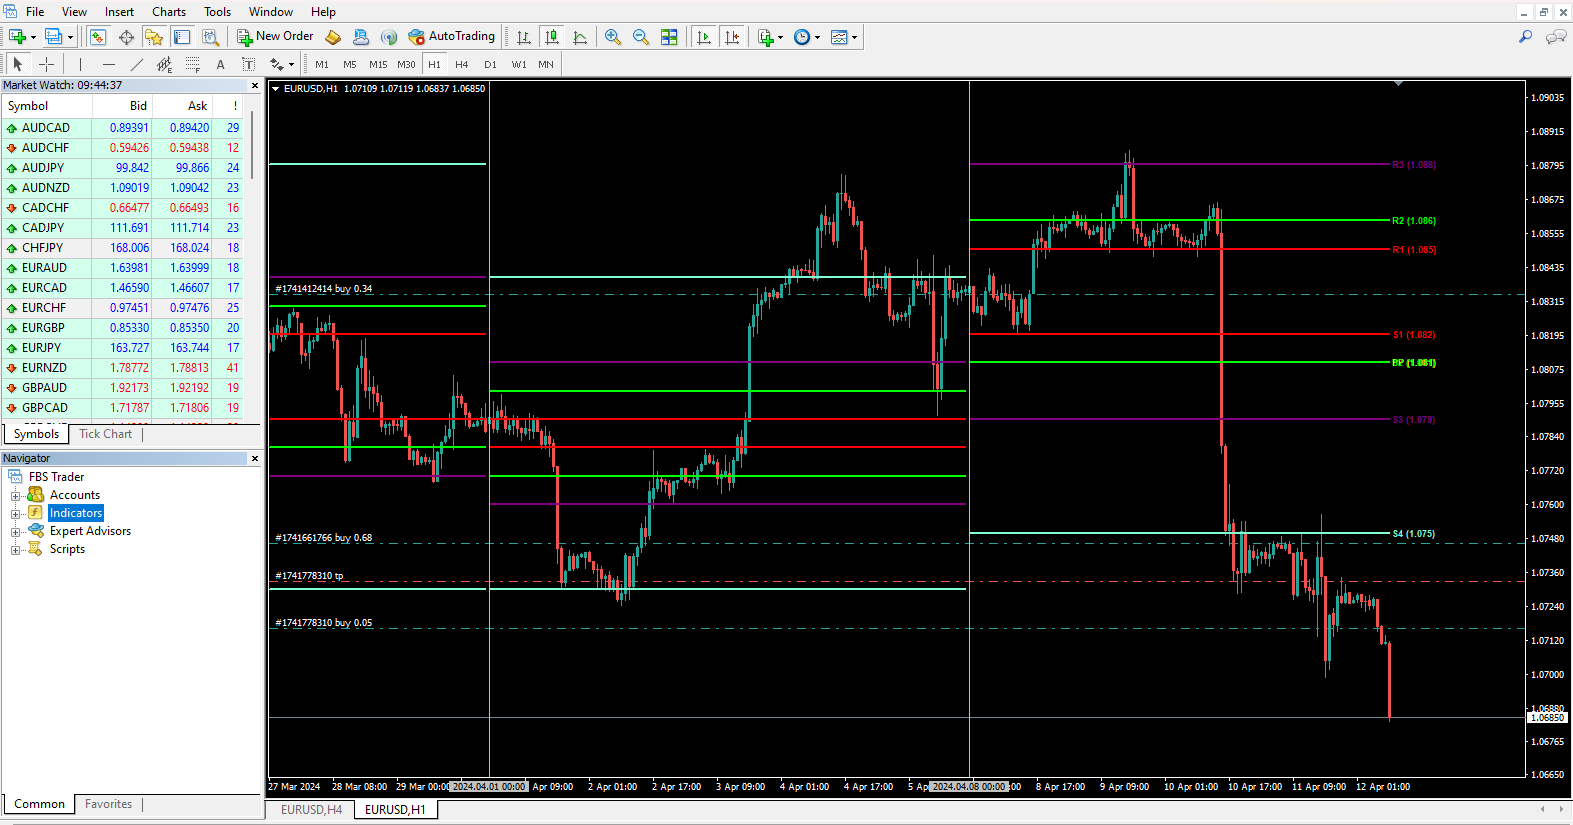
Automatic Calculations: The Pivot Indicator automatically calculates Pivot Point, Support, and Resistance levels based on the previous period's high, low, and close prices. This eliminates the complexity of manually calculating these levels.
-
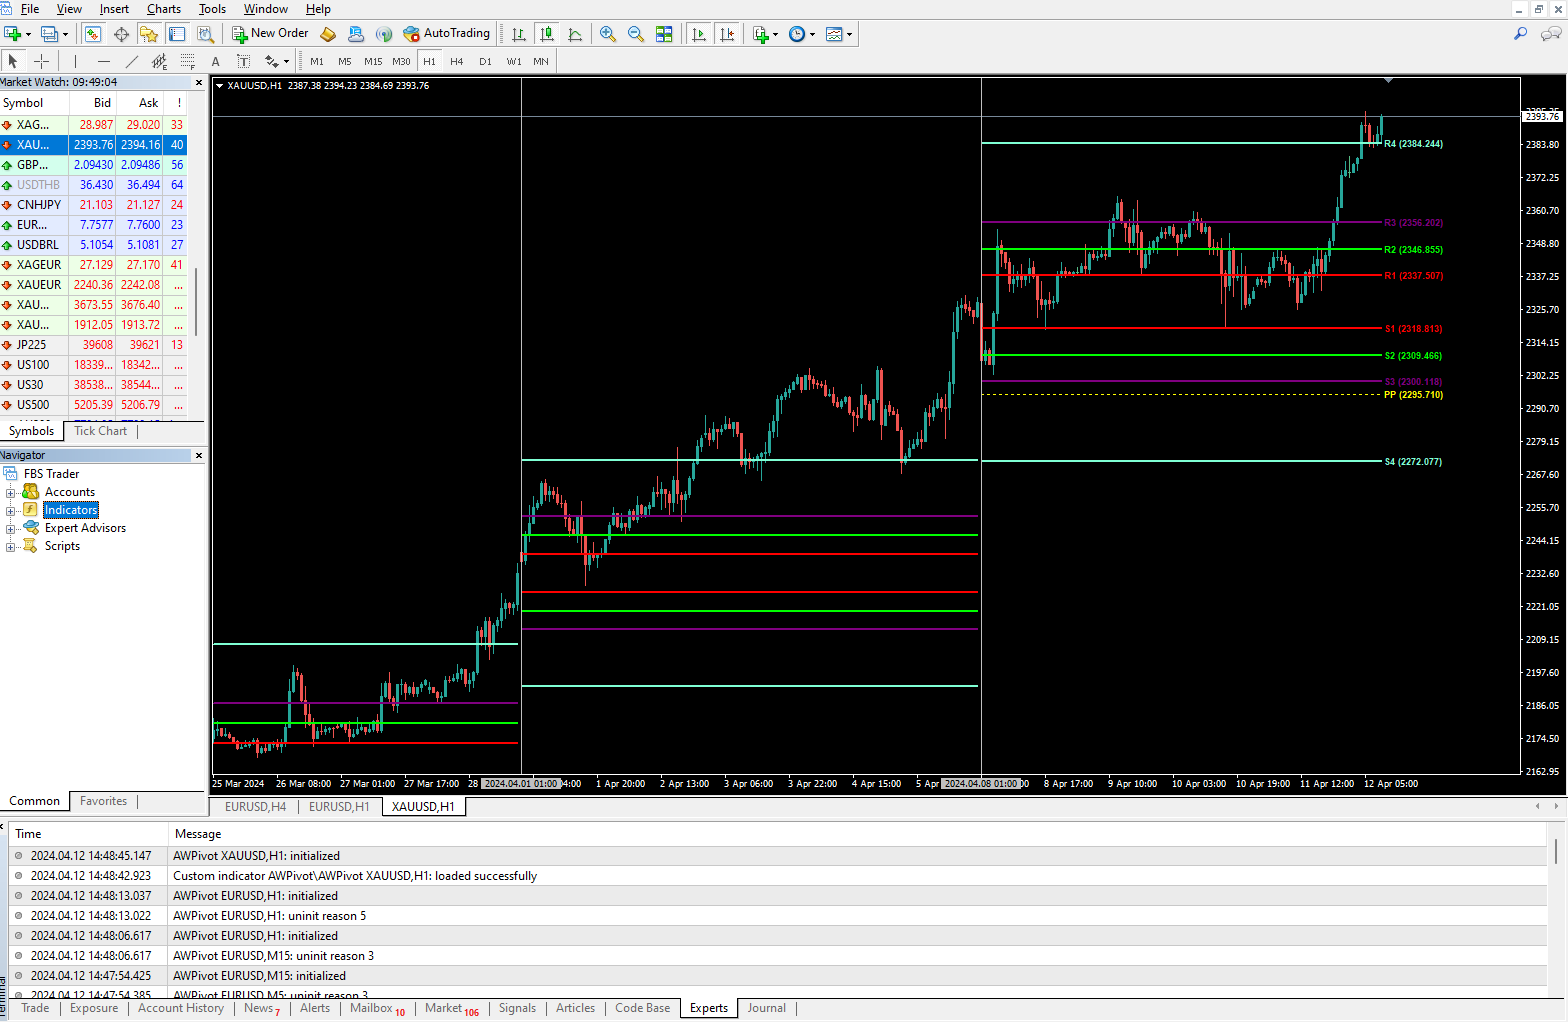
Clear Visualization: With an intuitive display, the Pivot Indicator visualizes Pivot Point, Support, and Resistance levels on price charts. This helps traders quickly identify key areas where prices may pivot.
-
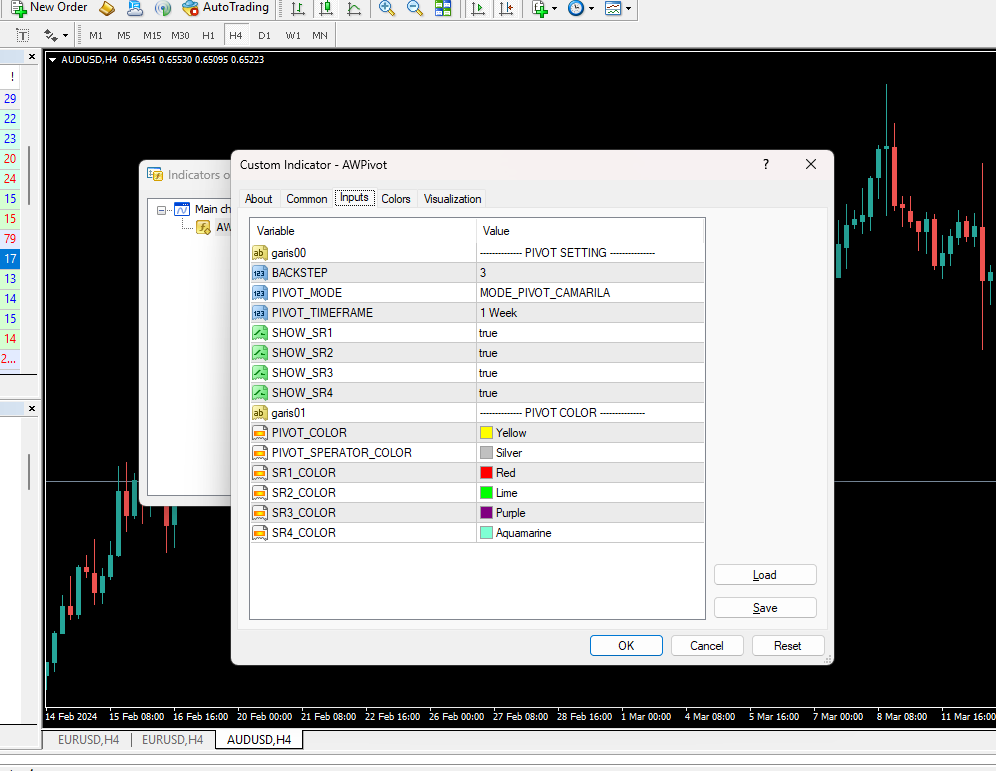
Multiple Pivot Types: The Pivot Indicator offers the ability to detect various types of pivot points, including Camarilla, Woodie, Fibonacci, Demark, and standard pivots. This enables traders to choose the pivot type that best fits their trading strategy and preferences.
-
Flexibility: The Pivot Indicator can be customized for various timeframes, ranging from intraday to long-term. This allows traders to use the tool according to their trading style and strategies.
With the Pivot Indicator's ability to detect multiple pivot types, traders can enhance their understanding of market dynamics and develop more effective trading strategies.
Note : We also have an EA version for this product, here is the link : https://www.mql5.com/en/market/product/112349
O usuário não deixou nenhum comentário para sua avaliação