Breakout Pro Scalper Solution

5
Solução Breakout Pro Scalper
Este indicador faz parte dos sistemas RPTrade Pro Solutions.

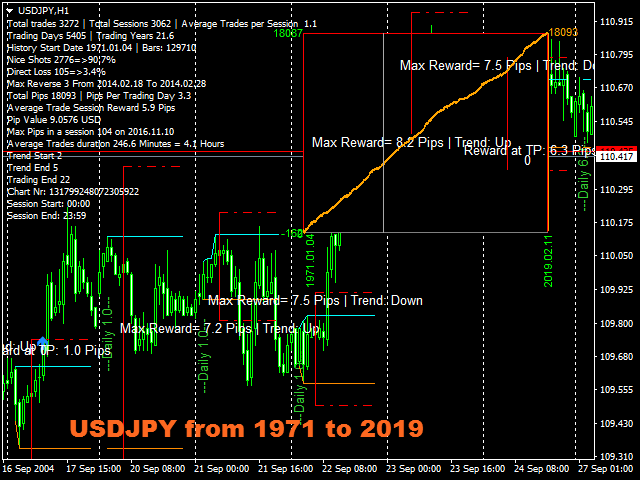
Breakout Pro Scalper Solution é um indicador de tendência diária usando Price Action, Dynamic Support e Resistances.
Ele foi projetado para ser usado por qualquer pessoa, mesmo o iniciante absoluto na negociação pode usá-lo.
NUNCA repinta.
As indicações são dadas de perto para perto.
Projetado para ser usado sozinho, nenhum outro indicador é necessário.
Dá-lhe a tendência e potencial Take Profit no início do dia.
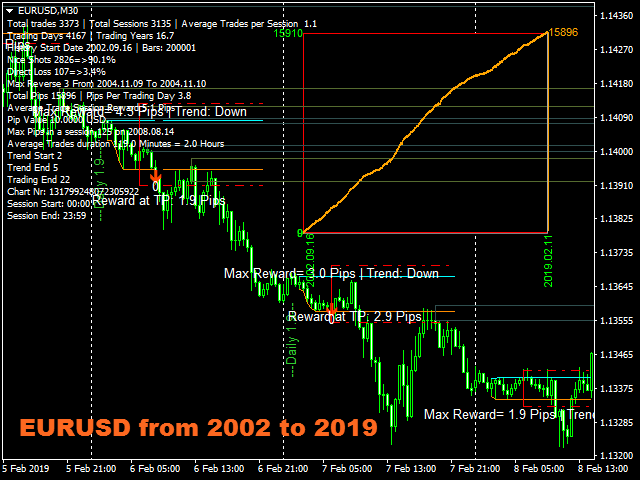
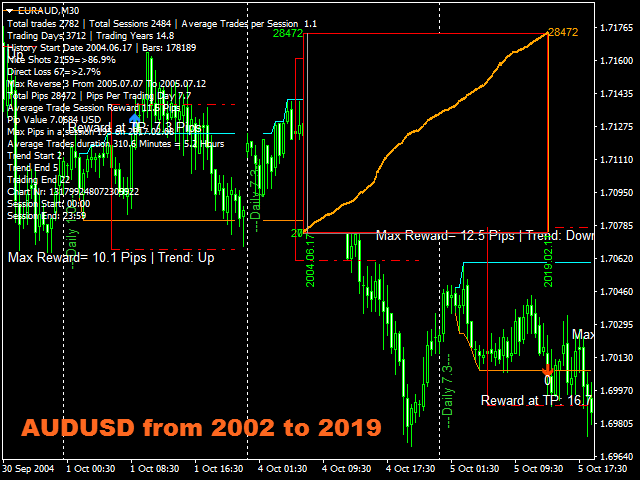
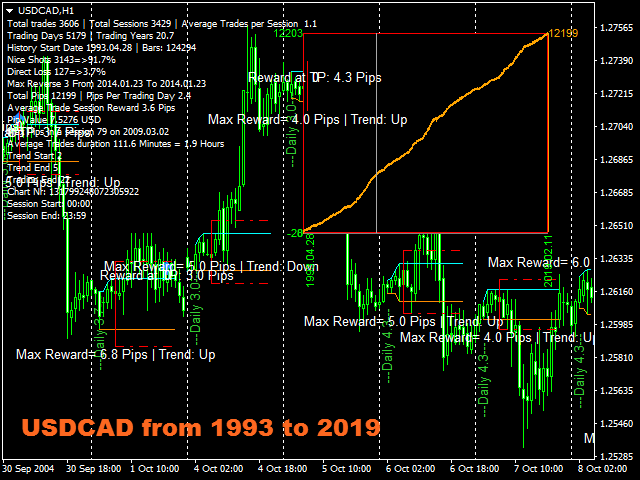
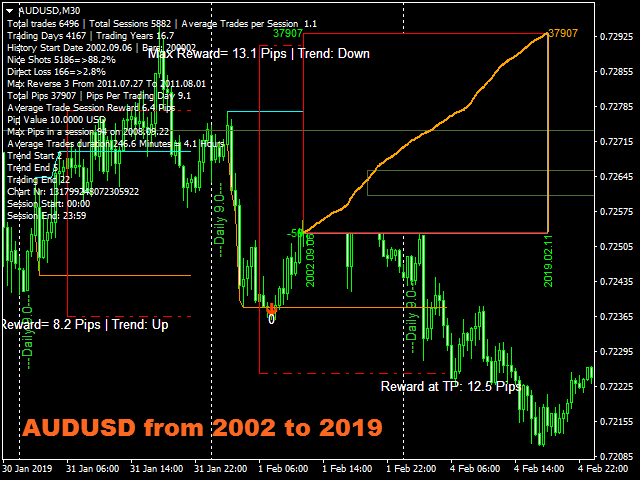
Um gráfico específico mostra o lucro potencial de acordo com os dados do histórico.


Como funciona
A solução Breakout Pro Scalper está usando uma estratégia de fuga combinada com ação de preço e suporte e resistências dinâmicos.
A tendência noturna e a volatilidade são analisadas para serem usadas no dia seguinte.
A partir desta análise são determinados os limites de breakout (linhas azul e laranja escuro) e também o Take Profit
O "sucesso" da estratégia e configurações podem ser verificados instantaneamente graças ao gráfico no gráfico.
O OnChart Graph permite ver imediatamente se existem "buracos" na estratégia e eventualmente selecionar outro TimeFrame ou Símbolo que se encaixe melhor.
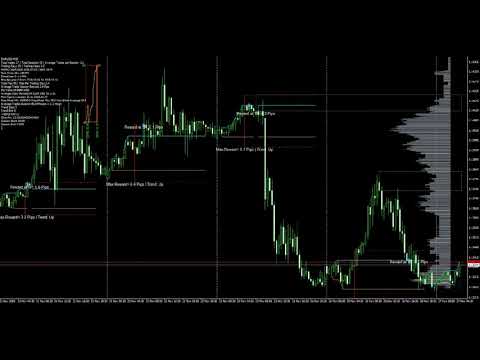
Em tempo real, de vela próxima a vela, o indicador de tendência espera que as condições do sinal sejam válidas e, em seguida, mostra por uma seta (verde para compra e laranja para venda)
As linhas pontilhadas vermelhas mostram onde colocar o Take Profit e eventual Stop Loss.
As negociações são indicadas uma a uma, nunca há duas negociações ao mesmo tempo.
A maioria dos negócios (80%) são finalizados durante o dia.


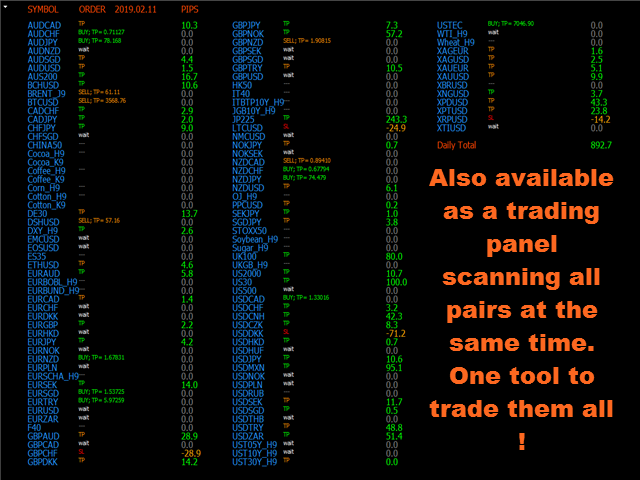
A solução Breakout Pro Scalper indica:
Onde abrir seus negócios.
Take Profit e Stop Loss.
A quantidade potencial de sementes que podem ser capturadas.


Solução Breakout Pro Scalper funciona
Com qualquer instrumento como pares de câmbio, índices, metais, futuros ou qualquer outro se as cotações forem fornecidas durante a noite.
De M15 a H1.
Com qualquer corretor.


Recursos da solução Breakout Pro Scalper
Sinais confiáveis ​​de compra/venda.
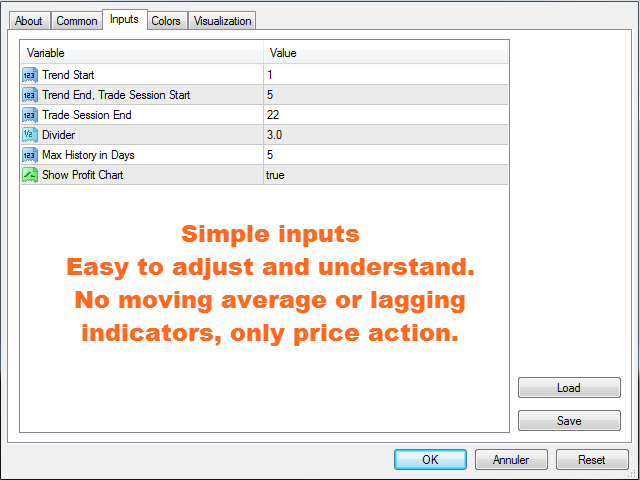
Entradas muito simples.
Alerta na tela + notificações push + notificações por e-mail
Todas as notificações são muito detalhadas e dão também Take Profit, permite negociar a partir de um dispositivo móvel.
No gráfico de pips de lucro do gráfico, mostrando o saldo de todos os dados do histórico. É fácil ver se a estratégia é consistente com o instrumento selecionado.
O gráfico On Chart é móvel com o mouse, clique duas vezes nele e mova-o para qualquer posição conveniente na tela.
Os Suportes e Resistências são exibidos no gráfico.
As linhas de nível com áreas finas e gordas são exibidas no gráfico.


Como usar a solução Breakout Pro Scalper
Basta colocá-lo em seu gráfico (s).
Basta seguir as setas e as indicações Take Profit / Stop Loss.


Entradas
Início da tendência: [Inteiro] Insira aqui a hora do início da tendência noturna. O valor padrão é 1 hora; ele se encaixa para a maioria dos pares Fx que são cotados de 0 a 23:59.
Fim da Tendência, Início da Sessão de Negociação: [Integer] Insira aqui o horário para o término da tendência noturna e início da sessão de negociação. O valor padrão se encaixa na maioria dos instrumentos.
Fim da Sessão de Negociação: [Integer] Não mostrará negociações após este horário.
Divisor: [Duplo] Divide a distância entre Trend Start e Trend End para calcular Take Profit e SL. O padrão é 3, significa que TP e SL serão 1/3 da distância de volatilidade noturna.
Histórico máximo em dias: [Integer] Define a duração do histórico em dias para as linhas de preço cinza.
Mostrar gráfico de lucro: [Bool] true = mostrar o gráfico de lucro, false = não mostrar.


Teste
Não tenha pressa, o teste é bastante lento, pois faz cálculos complicados. De qualquer forma você não terá que esperar muito para ver que a estratégia é realmente lucrativa.


Próxima versão
Um novo lançamento está para vir em breve. Ele usará diretamente Suporte e Resistências para adaptar Take Profit, Stop Loss e filtrar sinais de início de negociação.
Um terceiro usará as linhas de preço para "prever" os movimentos dos preços.
Será possível selecionar e utilizar as estratégias anteriores nos novos lançamentos.
Comentários 2
pete080368
1064
pete080368 2019.07.03 10:39 
 

incredible. Still have to find out some more details and how to avoid triggered trades, which run in the opposite direction right afterwards into a possible stopp/loss. But this simply never happens. So five stars for this masterpiece!

Produtos recomendados
BinaryScalping
Andrey Spiridonov
BinaryScalping is a professional indicator for trading binary options and scalping. The algorithm of the indicator is based on the calculation of pivot points for each time period separately, the location of the price of the trading instrument relative to the pivot points is analyzed and the probability of a trading operation is calculated. The indicator has a built-in filter of trading signals based on the global trend. The indicator is installed in the usual way and works with any trading inst
Smart Reversal Signal  is a professional indicator for the MetaTrader 4 platform; it has been developed by a group of professional traders. This indicator is designed for Forex and binary options trading. By purchasing this indicator, you will receive: Excellent indicator signals. Free product support. Regular updates. Various notification options: alert, push, emails. You can use it on any financial instrument (Forex, CFD, options) and timeframe. Indicator Parameters Perod - indicator calculat
Limitless MT4
Dmitriy Kashevich
O MT4 ilimitado é um indicador universal que se adequa a todos os comerciantes iniciantes e experientes. funciona em todos os pares de moedas, criptomoedas, ações em bruto MT4 ilimitado - já configurado e não requer configuração adicional E agora a principal coisa Por que o MT4 ilimitado? 1 falta completa de redesenho 2 dois anos de testes pelos melhores especialistas em negociação 3 a precisão dos sinais corretos excede 80% 4 teve bom desempenho nas negociações durante os comunicados d
BinaryUniversal
Andrey Spiridonov
BinaryUniversal is a signal indicator for binary options and Forex. In its work, the indicator uses a complex algorithm for generating signals. Before forming a signal, the indicator analyzes volatility, candlestick patterns, important support and resistance levels. The indicator has the ability to adjust the accuracy of the signals, which makes it possible to apply this indicator for both aggressive and conservative trading. The indicator is set in the usual way, it works on any time period and
WanaScalper MT4
Isaac Wanasolo
1 (1)
A scalping indicator based on mathematical patterns, which on average gives signals with relatively small SL, and also occasionally helps to catch big moves in the markets (more information in the video) This indicator has three main types of notifications: The first type warns of a possible/upcoming signal on the next bar The second type indicates the presence of a ready signal to enter the market/open a position The third type is for SL and TP levels - you will be notified every time price re
NostradamusMT4
Andrey Spiridonov
1 (1)
NostradamusMT4 is a powerful indicator from the set of professional trader. The indicator is based on Andrei Spiridonov's original price calculation method (ESTIMATED PRICE) for the current candle price. Advantages The indicator does not redraw. It works on any timeframes. Works with any trading instruments. Perfectly suitable for scalping and trading binary options. Parameters Color - color of the ESTIMATED PRICE FUTURE line. How to work with the indicator The indicator forms the ESTIMATED P
Desvendando o Indicador de Tendência XY Não Repaint: Seu Guia Definitivo para o Sucesso no Forex e Opções Binárias No mundo dinâmico do Forex e da negociação de opções binárias, ficar à frente da curva é fundamental. Os traders estão constantemente à procura de ferramentas que possam lhes fornecer uma vantagem competitiva, e uma dessas ferramentas poderosas que tem feito sucesso na comunidade de traders é o indicador "Non-Repainting XY Trend". Introdução: O indicador Non-Repainting XY Trend é um
This indicator works on MT4 and is very easy to use. When you receive a signal from it, you wait for that candle with the signal to close and you enter your trade at the beginning of the next new candle . A red arrow means sell and a green arrow means buy. All arrows comes with Alert  like for easy identification of trade signal. Are you okay with that? 1 minute candle 1 minute expire
This indicator is designed for scalping on low timeframes (M1-M15) in volatile markets like major forex pairs (e.g., EURUSD, GBPUSD). It generates non-repainting buy (green up arrow) and sell (red down arrow) signals based on EMA crossover confirmed by RSI momentum and MACD crossovers, minimizing false signals in ranging markets. How to Use: Attach the indicator to your MT4 chart. Look for arrows on the chart: Buy on green up arrow, Sell on red down arrow. Signals appear at the open of the new
Dear Traders this is my another tool called " Swing Master Indicator ". As the name above the indicator is designed to help you in swing trading by capturing the low and highs of the price. You may us this tool with any trading strategy and style from scalping to position trading. It is made for level of traders including newbies and advanced traders even prop-firms, hedge funds and banks to help them make sold market analysis. I create tools for serious traders who want to make a difference in
GTAS FibTdi
Riviera Systems
GTAS FidTdi is a trend indicator using combination of volatility and potential retracement levels. This indicator was created by Bernard Prats Desclaux, proprietary trader and ex-hedge fund manager, founder of E-Winvest. Description The indicator is represented as a red or green envelope above or under prices. How to use Trend detecting When the envelope is green, the trend is bullish. When it is red, the trend is bearish. Trading Once a trade is opened, GTAS FibTdi shows retracement zones wh
FREE
Powerful Binary Options
Ellan Dirgantara Tholkhah
This is the binary options signal you all have been looking for. This in a modified version of the Garuda Scalper, that has been modified for Binary Options traders. Signals are very unique! Why this is so effective for binary options is because  it is a trend following system, it understands that the trend is your friend. It takes advantage of the buying/selling after the pullback in continuation of the current trend wave.  Because  signals are generated after the pullback,   you can place shor
ReboltP
David Theodore Caro-greene
Rebalance Overlay Technology (Rebolt) enables the trader to visualize the flow of money from one chart to another chart. Rebolt Probability indicates the probability that money has flowed from one chart to another chart for a specified length of time over a number of intervals specified by the user. When Rebolt reads Cyan or Blue these are buying signs good for the length of time specified by the user or until a conflicting signal arises. When Rebolt reads Violet or Red there are selling signs g
Trend PA
Mikhail Nazarenko
5 (3)
The Trend PA indicator uses   Price Action   and its own filtering algorithm to determine the trend. This approach helps to accurately determine entry points and the current trend on any timeframe. The indicator uses its own algorithm for analyzing price changes and Price Action. Which gives you the advantage of recognizing, without delay, a new nascent trend with fewer false positives. Trend filtering conditions can be selected in the settings individually for your trading style. The indicator
Alpha Trend sign has been a very popular trading tool in our company for a long time. It can verify our trading system and clearly indicate trading signals, and the signals will not drift. Main functions: Based on the market display of active areas, indicators can be used to intuitively determine whether the current market trend belongs to a trend market or a volatile market. And enter the market according to the indicator arrows, with green arrows indicating buy and red arrows indicating se
Advanced Trend Regime
Shellard Securities (Pty) Ltd
The indicator has been designed to function on any time-frame and any pair.   This regime filter will help the trader better evaluate whether the current market is trending, and in which direction. It quickly reacts to changes in market dynamics using a series of advanced calculations. The user is able to select whether the calculation remains standard, or if a further filter constraint is added to the calculation.   A Yellow moving average of the signal has been included for the trader to smoot
VR Cub
Vladimir Pastushak
VR Cub é um indicador para obter pontos de entrada de alta qualidade. O indicador foi desenvolvido para facilitar cálculos matemáticos e simplificar a busca por pontos de entrada em uma posição. A estratégia de negociação para a qual o indicador foi escrito tem provado a sua eficácia há muitos anos. A simplicidade da estratégia de negociação é a sua grande vantagem, o que permite que até mesmo os comerciantes novatos negociem com sucesso com ela. VR Cub calcula os pontos de abertura de posição e
Owl smart levels
Sergey Ermolov
4.24 (37)
Versão MT5  |  FAQ O   Indicador Owl Smart Levels   é um sistema de negociação completo dentro de um indicador que inclui ferramentas populares de análise de mercado, como   fractais avançados de Bill Williams , Valable ZigZag que constrói a   estrutura de onda correta   do mercado e   níveis de Fibonacci que marcam os níveis exatos de entrada no mercado e lugares para obter lucros. Descrição detalhada da estratégia Instruções para trabalhar com o indicador Consultor de negociação Owl Helper Ch
Milch Cow Extra
Mohamed Nasseem
EA is primarily a Hedging and Multiples Strategy. It support to seize every opportunity in any direction as MILCH COW MIX but with multiple profit results without increasing the risk. Milch Cow Mix EA starts to open Hedge at first level only But EA opens Hedge at every level Not just opens the deals, but chooses the right time to close the open positions to begin trading again. We recommend the use of an expert with a pair of high volatility for the currency, such as GBPAUD, AUDCAD Experts inter
O PROSPERIUM é um indicador técnico completo, desenvolvido para traders que buscam máxima confiabilidade na análise e execução de operações. Criado para MetaTrader 4 e 5, ele combina diversos indicadores consagrados ( RSI, OBV, MACD, Bandas de Bollinger, ADX, Ichimoku e Média de Gravidade ) em um sistema integrado de geração de sinais de compra (CALL) e venda (PUT). Com painel estatístico avançado e cálculo automático de taxa de acerto, o PROSPERIUM fornece uma visão clara da performance em temp
This advisor enters the market at the opening of   London Market . It has a automatic function that give buy (arrow up green) and sell (arrow down red) signal when the indicator met high probabilities requirements.Once the signal is generated it is the trader discretions to start the order button and do trade manually. Stop loss are base on ATR. Recommended Take profit is 20pips.  The trading system is suitable for both experienced traders and beginners.  Timeframe is  M5 . Minimum account bal
Scalping Entry Points - é um sistema de negociação manual que pode se ajustar aos movimentos de preços e dar sinais para abrir negociações sem redesenhar. O indicador determina a direção da tendência pelo nível central de suporte e resistência. O indicador de ponto fornece sinais para entradas e saídas. Adequado para negociação intradiária manual, escalpelamento e opções binárias. Funciona em todos os prazos e instrumentos de negociação. O indicador dá vários tipos de alertas. Como usar o produ
It will be the best tool for you to make a profit! Through unique algorithms You're going to see an amazing amount of right trading signals Make huge profits every day and realize more possibilities!   Like the car no money to buy it, the love of the girls dare not to pursue?Or the credit card bill is not paid, the rent does not have the extra money to settle?Or are you fed up with being bossed around by your boss and Hope to get more people's respect?Can't afford to buy the things you want ? wa
Market Maestro: Your Ideal Partner for Automated Forex Trading If you're looking for a reliable assistant for trading in the currency market, Market Maestro is exactly what you need. This modern Forex bot is built using the latest technologies and algorithms, allowing it to effectively analyze market data and make informed trading decisions in real-time. Key Features of Market Maestro 1. Multicurrency Capability for Broad Opportunities Market Maestro can work with a wide range of currency pairs,
Gold Titan King Scalper
Dodong Christian Arnon
Indicator Description GOLD TITAN KING SIGNAL INDICATOR High-Precision Gold Scalping Buy/Sell Signals – Manual Trading Assistant Overview The Gold Titan King Signal Indicator is a manual trading assistant tool designed for high-frequency scalping on Gold (XAUUSD) and other major pairs. It generates clear BUY/SELL signals with precise entry levels, along with adjustable Stop Loss and Take Profit levels displayed directly on the chart. ️ This tool is NOT an EA. It does not execute trades
Новая версия индикатора консолидаций Consolidation box Generator. Предыдущая версия тут . Примеры настроек на индикатор тут . На данный момент этот инструмент анализа рынка уже нельзя назвать просто индикатором. Потому как это торговая стратегия. Наше ноу-хау заключается в том, что данный индикатор не требует огромного количества тестов в тестере стратегий. В индикаторе реализован блок статистики - при нанесении на график вам сразу будет видна результативность работы стратегии. Вы можете настро
Towers
Yvan Musatov
Towers - Trend indicator, shows signals, can be used with optimal risk ratio. It uses reliable algorithms in its calculations. Shows favorable moments for entering the market with arrows, that is, using the indicator is quite simple. It combines several filters to display market entry arrows on the chart. Given this circumstance, a speculator can study the history of the instrument's signals and evaluate its effectiveness. As you can see, trading with such an indicator is easy. I waited for an a
This indicator is designed for scalping in the Forex market and trading binary options. A signal appears at the opening of a new candle. Usage Recommendations: For Binary Options: It is recommended to open trades when a signal appears on the first candle. A buy signal appears when the blue X replaces the red one, while a sell signal occurs when the red X replaces the blue one, as shown in the screenshots. For the Forex Market: Enter a trade when a signal appears as described above. It is advisa
FREE
A binary options styled indicator to trade fair value gaps and line breaks. Its robust nature makes it standout from other binary options indicators.   With the right setup strategy, which I will provide after purchase, you will enjoy smooth operations of the indicator. BinaryBlockBreaker is coded with third-party applications such as  http://www.mt2trading.com/?ref=1341  Please signup and download the needed software to provide smooth user experience. 
Trade with super Support and Resistance Breakout system. are you looking for the most sophisticated tools for your daily trading ? this tools are perfect for you, it has a most comprehensive breakout identification spot on all market (Forex, CFD, indice, etc) Limited offer :  10 copy for 30$ Indicator parameter: Depth: to arrange how deep to calculates the support and resistance zone Deviation Back-step the demonstration result you can see on the media file below.
Os compradores deste produto também adquirem
Indicador Miraculous – Ferramenta 100% Não Repintável para Forex e Opções Binárias Baseada no Quadrado de Nove de Gann Este vídeo apresenta o Indicador Miraculous , uma ferramenta de negociação altamente precisa e poderosa, desenvolvida especificamente para traders de Forex e Opções Binárias . O que torna este indicador único é a sua base no lendário Quadrado de Nove de Gann e na Lei da Vibração de Gann , tornando-o uma das ferramentas de previsão mais precisas disponíveis na negociação moderna.
Meravith
Ivan Stefanov
5 (1)
O indicador analisa o volume de cada ponto e calcula os níveis de exaustão do mercado para esse volume. Ele consiste em três linhas: Linha de exaustão do volume altista Linha de exaustão do volume baixista Linha que indica a tendência do mercado. Esta linha muda de cor para refletir se o mercado é altista ou baixista. Você pode analisar o mercado a partir de qualquer ponto inicial que escolher. Uma vez que uma linha de exaustão de volume seja atingida, identifique um novo ponto de início para o
BinaryIndicator
Andrey Spiridonov
BinaryIndicator is a highly accurate indicator for trading binary options. It shows excellent results in scalping. This indicator is based in multifactor analysis of trend indicators, as well as confirmation oscillators, which in the end gives an increased accuracy of signals. Advantages of the indicator Increased accuracy of signals. Excellent results when trading binary options with a short expiration time from M30 to M1 . It works on any timeframes. Works with any trade symbols. Parameters
The Hurricane Indicator
Paul Nicholas Clevett
5 (1)
Currently switched to the 4 hour chart - but use other time frames for confirmation. :-)  I change my main time frame based on the market movement at the time. The Hurricane Forex Indicator is a multi time frame indicator that includes such things as Trade Notifications, Trade Calculator, Momentum Indicator, risk reward and much more. We have a free Trade room for our users as well. Please check out the video for full details of how this indicator works as it has over 15 years worth of developme
This indicator is a multifunctional technical analysis tool based on the combination of an adaptive exponential moving average and volatility filters calculated through the Average True Range (ATR). It is designed to accurately identify the current price direction, highlight key trend reversal areas, and visualize potential turning zones. The algorithm is built upon the dynamic construction of a trend ribbon using two levels of volatility — outer and inner ranges. The outer boundaries serve as i
Rtc ML Ai Predictor MT4
Muhammad Faisal Sagala
Rtc ML Ai | Predictor CORE MACHINE LEARNING ENGINE Adaptive ML Market Predictor – Multi-Bar Trend & Candle Forecast What This Indicator Does This indicator is a  real-time market prediction engine  designed to analyze price behavior and estimate  future market tendencies . Unlike conventional indicators, this system  does not rely on static parameters or historical curve-fitting , but adapts its internal state dynamically during live market operation. Instead of using static rules, the indic
FFx Engulfing Setup Alerter gives trade suggestions with Entry, Target 1, Target 2 and StopLoss. Below are the different options available: Entry suggestion - pips to be added over the break for the entry 3 different options to calculate the SL - by pips, by ATR multiplier or at the pattern High/Low 3 different options to calculate the 2 TPs - by pips, by ATR multiplier or at Risk/Reward Offset the dashboard - any place on the chart Remove the suggestion once the price reached the SL line Lines
FFx InsideBar Setup Alerter gives trade suggestions with Entry, Target 1, Target 2 and StopLoss. Below are the different options available: Entry suggestion - pips to be added over the break for the entry Minimum candle size - to avoid too close buy/sell entry suggestions 3 different options to calculate the SL - by pips, by ATR multiplier or at the pattern High/Low 3 different options to calculate the 2 TPs - by pips, by ATR multiplier or at Risk/Reward Offset the dashboard - any place on the c
FFx OutsideBar Setup Alerter gives trade suggestions with Entry, Target 1, Target 2 and StopLoss. Below are the different options available: Entry suggestion - pips to be added over the break for the entry. 3 different options to calculate the SL - by pips, by ATR multiplier or at the pattern High/Low. 3 different options to calculate the 2 TPs - by pips, by ATR multiplier or at Risk/Reward. Offset the dashboard - any place on the chart. Remove the suggestion once the price reached the SL line.
FFx PinBar Setup Alerter gives trade suggestions with Entry, Target 1, Target 2 and StopLoss. Below are the different options available: Entry suggestion - pips to be added over the break for the entry Minimum candle size - to avoid too small candles 3 different options to calculate the SL - by pips, by ATR multiplier or at the pattern High/Low 3 different options to calculate the 2 TPs - by pips, by ATR multiplier or at Risk/Reward Offset the dashboard - any place on the chart Remove the sugges
Automatic, live & interactive picture of all trendlines. Assign push, email and sound alerts to the lines of your choice and be informed about price rollback, breakout, rollback after breakout, number of rollbacks, line expiration by double breakout. Correct, drag or delete the lines and interactively tune the line system. https://youtu.be/EJUo9pYiHFA . Chart examples https: //www.mql5.com/en/users/efficientforex Price Interaction Events All events are effective immediately and only after one
The purpose of this new version of the MT4 standard indicator provided in your platform is to display in a sub-window multiple timeframes of the same indicator with its divergences. See the example shown in the picture below. But the display isn't like a simple MTF indicator. This is the real display of the indicator on its timeframe. Here's the options available in the FFx divergences indicator: Select the timeframes to be displayed (M1 to Monthly) Define the width (number of bars) for each tim
The purpose of this new version of the MT4 standard indicator provided in your platform is to display in a sub-window multiple timeframes of the same indicator with its divergences. See the example shown in the picture below. But the display isn't like a simple MTF indicator. This is the real display of the indicator on its timeframe. Here's the options available in the FFx divergences indicator: Select the timeframes to be displayed (M1 to Monthly). Define the width (number of bars) for each ti
The FFx Dashboard MTF alerter will show you on a single chart all the timeframes (M1 to Monthly) with their own status for the indicator. 2 Alert Options: Single timeframe: each selected timeframe alert separately when a signal occurs Multi timeframes: all selected timeframes must agree for an alert to be triggered Both options have an input to select the timeframes to be used for the alert(s). How to Understand the Status: Green/Red square: histogram above/below 0 line Green square + Red bord
The FFx Dashboard MTF alerter will show you on a single chart all the timeframes (M1 to Monthly) with their own status for the indicator. 2 Alert Options: Single timeframe: each selected timeframe alert separately when a signal occurs Multi timeframes: all selected timeframes must agree for an alert to be triggered Both options have an input to select the timeframes to be used for the alert(s). How to understand the status: Green/Red square: RSI above/below 50 line Green square + Red border: R
The FFx Dashboard MTF alerter will show you on a single chart all the timeframes (M1 to Monthly) with their own status for the indicator. 2 Alert Options: Single timeframe: each selected timeframe alert separately when a signal occurs Multi timeframes: all selected timeframes must agree for an alert to be triggered Both options have an input to select the timeframes to be used for the alert(s). How to understand the status: Green/Red square: Stoch above/below 50 line Green square + Red border:
The FFx Dashboard MTF alerter will show you on a single chart all the timeframes (M1 to Monthly) with their own status for the indicator. 2 Alert Options: Single timeframe: each selected timeframe alert separately when a signal occurs Multi timeframes: all selected timeframes must agree for an alert to be triggered Both options have an input to select the timeframes to be used for the alert(s). How to understand the status: Green/Red square: Price above/below Cloud (Kumo) Green square + Red bo
The FFx Dashboard MTF alerter will show you on a single chart all the timeframes (M1 to Monthly) with their own status for the indicator. 2 Alert Options: Single timeframe: each selected timeframe alert separately when a signal occurs Multi timeframes: all selected timeframes must agree for an alert to be triggered Both options have an input to select the timeframes to be used for the alert(s). How to understand the status: Green/Red square: MA pointing Up/Down Green square + Red border: MA po
The FFx Dashboard MTF alerter will show you on a single chart all the timeframes (M1 to Monthly) with their own status for the indicator. 2 Alert Options: Single timeframe: each selected timeframe alert separately when a signal occurs. Multi timeframes: all selected timeframes must agree for an alert to be triggered. Both options have an input to select the timeframes to be used for the alert(s). How to understand the status: Green square: Price above PSAR Red square: Price below PSAR Options
The FFx Dashboard MTF alerter will show you on a single chart all the timeframes (M1 to Monthly) with their own status for the indicator. 2 Alert Options: Single timeframe: each selected timeframe alert separately when a signal occurs Multi timeframes: all selected timeframes must agree for an alert to be triggered Both options have an input to select the timeframes to be used for the alert(s). How to understand the status: Green/Red square: CCI above/below levels (ie. 100/-100) Grey square: C
The FFx Dashboard MTF alerter will show you on a single chart all the timeframes (M1 to Monthly) with their own status for the indicator. 2 Alert Options: Single timeframe: each selected timeframe alert separately when a signal occurs Multi timeframes: all selected timeframes must agree for an alert to be triggered Both options have an input to select the timeframes to be used for the alert(s). How to understand the status: Green/Red square: ADX above level Grey square: ADX below level Red bor
The FFx Dashboard MTF alerter will show you on a single chart all the timeframes (M1 to Monthly) with their own status. 2 Alert Options: Single timeframe: each selected timeframe alert separately when a signal occurs Multi timeframes: all selected timeframes must agree for an alert to be triggered Both options have an input to select the timeframes to be used for the alert(s). How to understand the status: Green/Red square: bullish/bearish candle Options available in the FFx Dashboard Alerter
The [GRAFF] III manual trading system is based on multiple MetaTrader (MT4) indicators. Together, the entire PACK of GRAFF III indicators makes an advanced trading tool. The system consists of over 20 different custom-built indicators which have been carefully selected and tested in the long term to produce strong and efficient trading signals. The particular indicators are based on different mathematical formulas, so the entire system is calibrated to remove false signals from its own indicator
This indicator allows you to see the strength of the trend on all timeframes. It can be used for all currency pairs. The indicator can be displayed in the form of a column (from left to right): status buy / sell / strong buy / strong sell, strength of the trend in percentage, pips last candle, body candle now, remaining time, and the timeframe of M1 to MN. Information contained below (from left to right): total trend percent, sell percent, buy percent.
FFx Universal Strength Meter PRO is more than a basic strength meter. Instead of limiting the calculation to price, it can be based on any of the 19 integrated strength modes + 9 timeframes. With the FFx USM, you are able to define any period for any combination of timeframes. For example, you can set the dashboard for the last 10 candles for M15-H1-H4… Full flexibility! Very easy to interpret... It gives a great idea about which currency is weak and which is strong, so you can find the best pai
A simplistic indicator informing a user on RSI divergence by sending messages to mobile device and email. The indicator draws 2 vertical lines, marking two RSI extrema that formed the divergence. You get the alert, open the charts and make a decision. The indicator does not show past divergences, thus when you attach it to a chart for the first time you see nothing. Graphics and alerts will appear as soon as divergences do. Drop it in Tester to see how it works. Parameters: RSIPeriod - number of
Pan PrizMA CD Phase is an analogue of the МetaТrader 5 indicator , and is an option based on the Pan PrizMA indicator. Details . Averaging by a quadric-quartic polynomial increases the smoothness of lines, adds momentum and rhythm. Extrapolation by the sinusoid function near a constant allows adjusting the delay or lead of signals. The value of the phase - wave status parameter (which is close in meaning to the trigonometric phase or the angle of the radius-vector rotation in the trigonometric p
Mais do autor
PipsMinerFast
Remi Passanello
3 (2)
PipsMinerFast is mainly a trend follower with a bit of price action. At first sight, you will think: "Oh well, one more indi showing everything I've missed today but not giving a clue about what will happen..." Okay, you can believe this when just looking at it but start a test it and you will see that PipsMinerFast: Shows you the trend immediately Is not repainting Has minimum lagging Counts pips immediately Adapts to your spread level Works from M1 to H1 Is heading in the right direction 90% o
Scalp Tool
Remi Passanello
5 (1)
Scalp Tool é um indicador de tendência de contador muito eficiente. Ele foi projetado para ser usado por qualquer pessoa, até mesmo o novato completo em negociação pode usá-lo. Scalp Tool não redesenha. As indicações são dadas de próximo a próximo ou de próximo a um nível visível. A ferramenta Scalp pode ser usada sozinha, nenhum outro indicador é necessário. Ferramenta de couro cabeludo indica Onde abrir seus negócios. Quando fechá-los. Onde colocar ordens de parada. Com uma precisão superi
Trend Wave
Remi Passanello
5 (5)
Trend Wave é uma ferramenta de negociação avançada; indicador de tendência e contra-comércio baseado em Suportes e Resistências. Trend Wave foi projetado para ter uma negociação ativa a qualquer momento O Trend Wave não está atrasado As indicações são dadas no início de uma nova vela A onda de tendência indica A janela do indicador mostra a contagem real de S e R para obter a tendência geral A linha branca mostra a tendência instantânea. Na janela principal do gráfico, setas coloridas são ex
Trend Compound
Remi Passanello
3 (2)
Trend Compound is a trend indicator using a mix of 3 internal other indicators. Please have a look at "how to test in the tester" at the bottom of this page before to test. It's designed to be used by anyone, even the complete newbie in trading can use it. Trend Compound does not repaint . Indications are given from close to close. Trend Compound can be used alone , no other indicators are required. Trend Compound indicates Where to open your trades. When to close them. The potential quantity o
Waxter D1
Remi Passanello
Usa Take Profit, Stop Loss e Trailing Stop. Também pode funcionar como um switch sem SL/TP Possui um sistema Martingale e Anti Martingale para os jogadores. Funciona com qualquer par Muitos arquivos .Set disponíveis. Como funciona WAXTER é um EA Trend-Wise, significa que sua estratégia é negociar na direção da tendência. WAXTER está usando uma estratégia de tendência combinada com ação de preço e suporte e resistências dinâmicos. O indicador WAX incorporado específico é usado para determinar a
BPSPanel
Remi Passanello
BPS Panel Breakout Pro Scalper Solution Panel This indicator is part of the   RPTrade Pro Solutions  systems. BPS Panel   is a daily trend indicator using Price Action, Dynamic Support and Resistances. It's designed to be used by anyone, even the absolute beginner in trading can use it. NEVER repaints . Indications are given   from close to close . Designed to   be used alone , no other indicators are required. Gives you the trend and potential Take Profit at the beginning of the day. How doe
Escalpelador de Tendências Diárias (DTS) Este indicador faz parte dos sistemas RPTrade Pro Solutions. DTS é um indicador de tendência diária usando Price Action, Dynamic Support e Resistances. Ele foi projetado para ser usado por qualquer pessoa, mesmo o iniciante absoluto na negociação pode usá-lo. NUNCA repinta. As indicações são dadas de perto para perto. Projetado para ser usado sozinho, nenhum outro indicador é necessário. Dá-lhe a tendência e potencial Take Profit no início do dia. Com
Barbeador de mercado   Cambista de mercado Este indicador faz parte dos sistemas RPTrade Pro Solutions. Market Scalper é um indicador de tendência diária usando Price Action, Dynamic Support e Resistances. Ele foi projetado para ser usado por qualquer pessoa, mesmo o iniciante absoluto na negociação pode usá-lo. NUNCA repinta. As indicações são dadas de perto para perto. Projetado para ser usado sozinho, nenhum outro indicador é necessário. Dá-lhe indicações claras e simples Como funciona Ma
O Comerciante Diário   Este indicador faz parte dos sistemas RPTrade Pro Solutions. O Daily Trader é um indicador diário que usa apenas estatísticas. Ele foi projetado para ser usado por qualquer pessoa, mesmo o iniciante absoluto na negociação pode usá-lo. NUNCA repinta. As indicações são dadas de perto para perto. Projetado para ser usado sozinho, nenhum outro indicador é necessário. Dá-lhe indicações claras e simples Como funciona O sistema estatístico analisa o histórico para encontrar re
GannRS Trend Scalper   GannRS is an advanced trading tool based on Gann Law and Supports and Resistances. designed to have an   active trading at any time not lagging Indications are given at the beginning of a new candle Please watch the full tutorial video. How to use GannRS Very easy to set up... Put it on your chart Adjust inputs Inputs Show Resistance and support : [bool]  true = Shows R/S on chart false = does not show Show Levels :[bool]  true = Shows levels on the chart false = does n
Scalper Pro Line é um indicador de tendência curta usando Price Action. Ele foi projetado para ser usado por qualquer pessoa, mesmo o iniciante absoluto na negociação pode usá-lo. NUNCA repinta. As indicações são dadas de perto para perto. Projetado para ser usado sozinho, nenhum outro indicador é necessário. Um gráfico específico mostra o lucro e eventual rebaixamento de acordo com os dados do histórico. Como funciona A Scalper Pro Line está usando um indicador de tendência interno combinado
TrendSwift
Remi Passanello
TrendSwift Ele foi projetado para ser usado por qualquer pessoa, até mesmo o iniciante em negociação pode usá-lo. NUNCA repinta. As indicações são dadas de perto a perto. Projetado para ser usado sozinho, nenhum outro indicador é necessário. Como funciona TrensSwift está usando um indicador de tendência interno combinado com uma ação de preço e sistema Fibonacci. A estratégia é aplicada estritamente sem qualquer recálculo posterior, suavização ou interpolação. O "sucesso" da estratégia pode s
UniversalTrader
Remi Passanello
4.64 (11)
Universal Trader (UT) This EA is part of the  RPTrade Pro Solutions  systems. UT  is a trading robot using a trend and oscillator indicators.  It's designed to be used by anyone, even the absolute beginner in trading can use it. Designed for every TimeFrames Uses Takes Profit, Stop Loss and Trailing stop. Can also work as a switch without SL/TP Works with any pairs How does it work UT is a trend follower.  It's using A build in Supertrend Indicator to find trades entries and Parabolic SAR to S
Netting Scalper
Remi Passanello
5 (2)
Este robô faz parte dos sistemas RPTrade Pro Solutions. O Netting Scalper é um robô de negociação rápido usando a dinâmica de ticks e o sistema de compensação. Ele foi projetado para ser usado por qualquer pessoa, mesmo o iniciante absoluto na negociação pode usá-lo. Projetado para M1 SOMENTE Usa Take Profit, Stop Loss e Trailing Stop. Também pode funcionar como um switch sem SL/TP Funciona com qualquer par Como funciona O Netting Scalper é um scalper M1 rápido. Não está usando nenhum indicado
GannRS Trend Scalper   GannRS is an advanced trading tool based on Gann Law and Supports and Resistances. designed to have an   active trading at any time not lagging Indications are given at the beginning of a new candle Please watch the full tutorial video. How to use GannRS Very easy to set up... Put it on your chart Adjust inputs Inputs Show Resistance and support : [bool]  true = Shows R/S on chart false = does not show Show Levels :[bool]  true = Shows levels on the chart false = does n
Straddle Scalper
Remi Passanello
Visão geral: Straddle scalper é um EA que abre straddles em determinadas horas e/ou dias. O Take Profit é gerado dinamicamente usando a relação ATR. Requisitos: Uma conta de cobertura é necessária para abrir straddles. Uma otimização estrita (em preços abertos) é obrigatória. O que é um straddle? Um straddle é a ação de abrir uma compra e uma venda ao mesmo tempo. Como funciona este EA? Após ser otimizado com sucesso, o EA abrirá um straddle em cada nova barra (H1 Timeframe) designada pe
Filtro:
sinergymy
415
sinergymy 2020.08.21 18:03 
 

O usuário não deixou nenhum comentário para sua avaliação

pete080368
1064
pete080368 2019.07.03 10:39 
 

incredible. Still have to find out some more details and how to avoid triggered trades, which run in the opposite direction right afterwards into a possible stopp/loss. But this simply never happens. So five stars for this masterpiece!

Responder ao comentário