EMA Zone

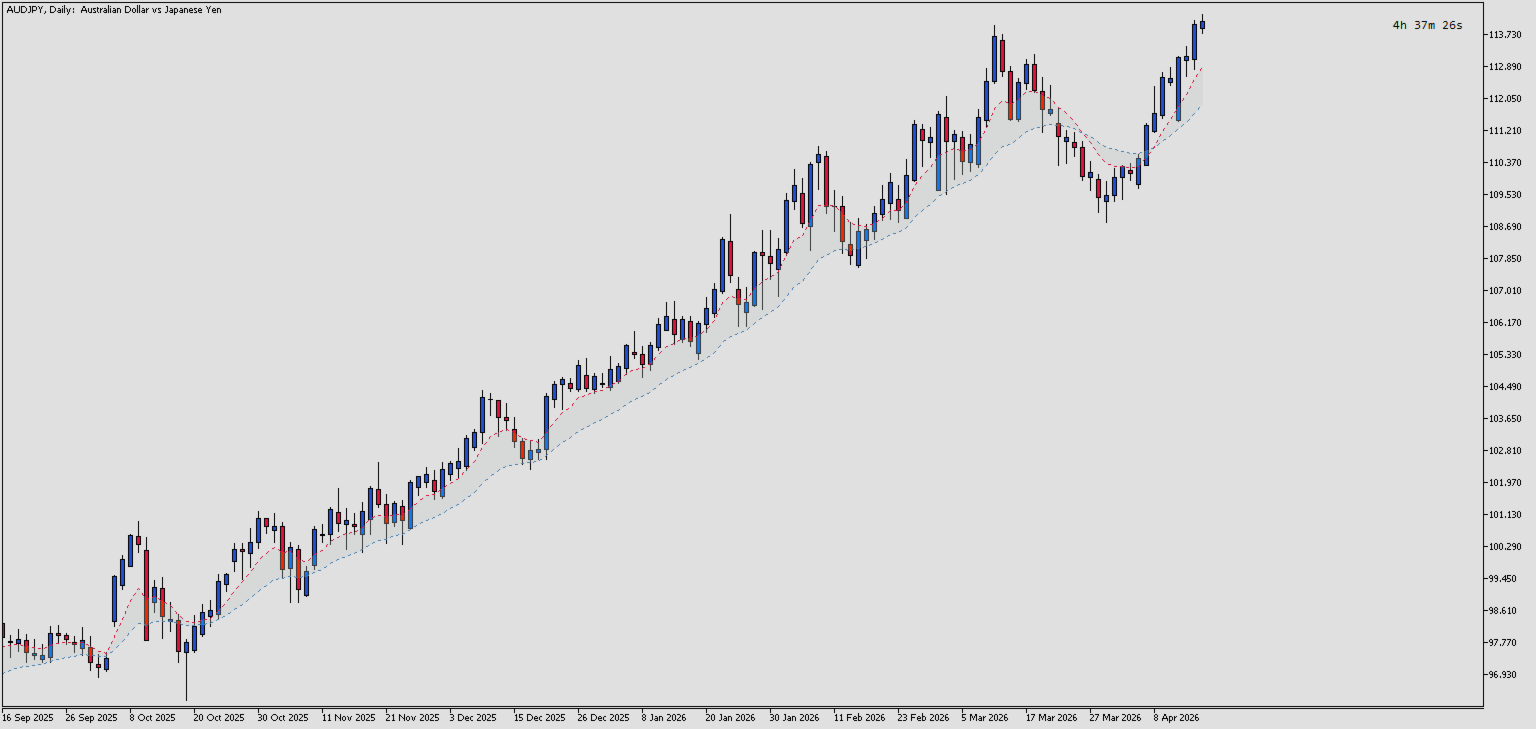
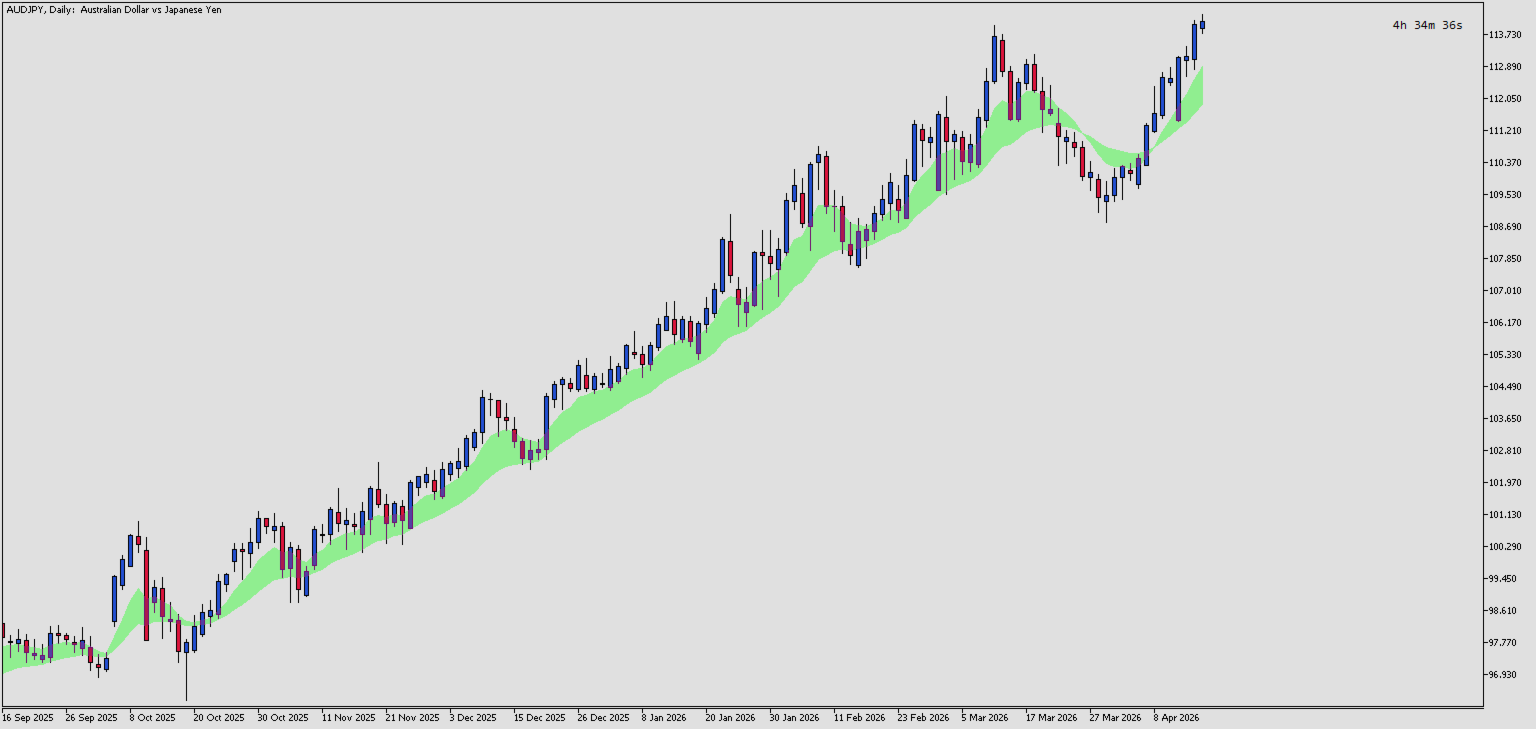
EMA Zone is a professional technical indicator for MetaTrader 5 that visualizes the relationship between two Exponential Moving Averages (EMAs) by displaying a filled zone between them. This visual representation helps traders quickly identify trend direction, momentum strength, and potential pullback continuation zones.

Key Features:

  • Dual EMA Visualization — Displays both Fast and Slow EMA lines with customizable periods
  • Zone Fill — Automatically fills the area between the two EMAs, making trend gaps visually apparent
  • Customizable Colors — Full control over line colors and zone fill color
  • Toggle Visibility — Option to show/hide individual components (Fast line, Slow line, Zone)
  • Lightweight & Efficient — Uses native MQL5 indicator handles for optimal performance

Trading Applications:

  • Trend Identification — When Fast EMA is above Slow EMA, zone color indicates bullish momentum
  • Trend Strength — Wider zones indicate stronger momentum; narrower zones suggest consolidation
  • Crossover Signals — Visual crossovers when the zone collapses and inverts
  • Support/Resistance Zones — The EMA zone can act as dynamic support/resistance

How It Works:

The indicator calculates two EMAs (Fast and Slow) and fills the area between them. When price trends strongly, the gap between EMAs widens. During consolidation, the zone narrows, signaling potential breakout opportunities.


Features

  • Dual EMA Lines — Displays Fast and Slow EMA as dotted lines directly on the main chart
  • Zone Fill — Fills the area between the two EMAs with a configurable color for easy visual identification of trend gaps
  • Customizable Periods — Adjust Fast EMA (default: 8) and Slow EMA (default: 21) periods to suit any trading style
  • Color Customization — Set individual colors for Fast line, Slow line, and Zone fill to match your chart theme
  • Visibility Controls — Toggle visibility of Fast line, Slow line, and Zone independently for flexible display options
  • Native Performance — Uses built-in iMA() handles for efficient calculation without lag
  • Multi-Timeframe Compatible — Works on any timeframe and any symbol supported by MT5
  • Non-Repainting — Calculations are based on closed candles; values do not change after bar completion

Input Parameters

EMA Settings

  • Inp Fast Period (default: 8) — The period for the Fast EMA. Lower values make the line more responsive to recent price changes. Typical values: 8-13 for short-term analysis.
  • Inp Slow Period (default: 21) — The period for the Slow EMA. Higher values create a smoother, less reactive line. Typical values: 21-50 for medium-term trend analysis.

Display Settings

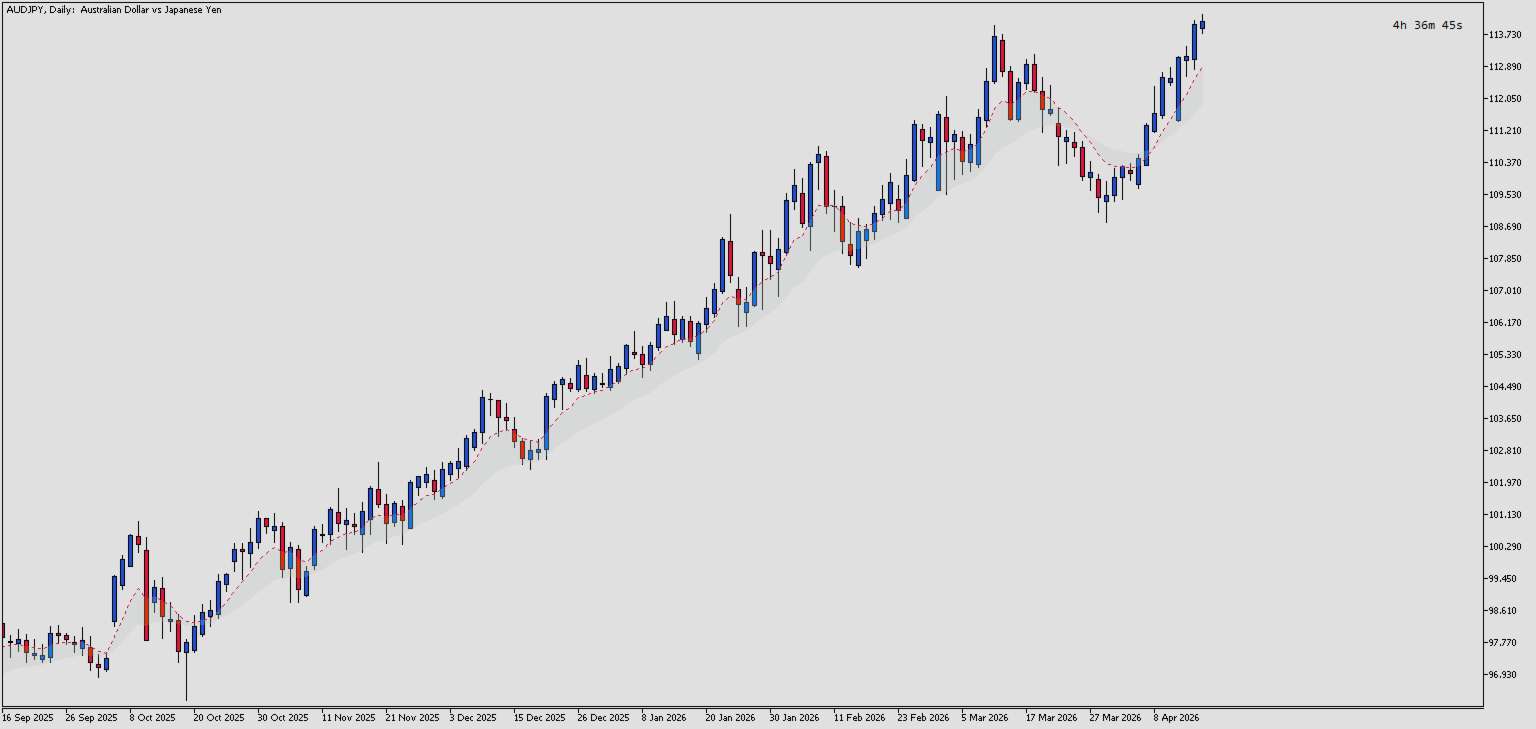
  • Inp Show Fast Line (default: true) — Controls visibility of the Fast EMA line. Set to false to hide it and focus only on the Slow EMA and Zone.
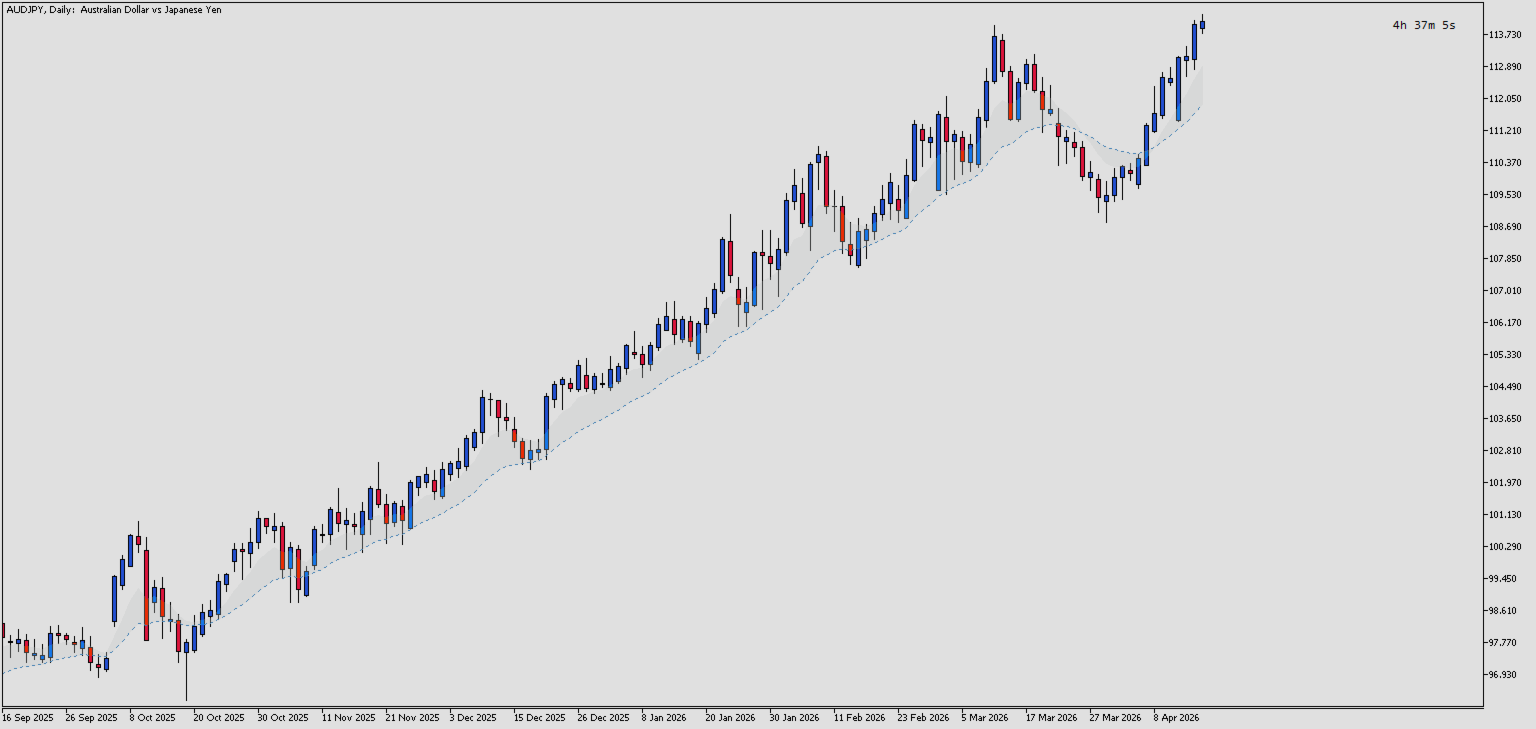
  • Inp Show Slow Line (default: true) — Controls visibility of the Slow EMA line. Set to false to hide it and focus only on the Fast EMA and Zone.
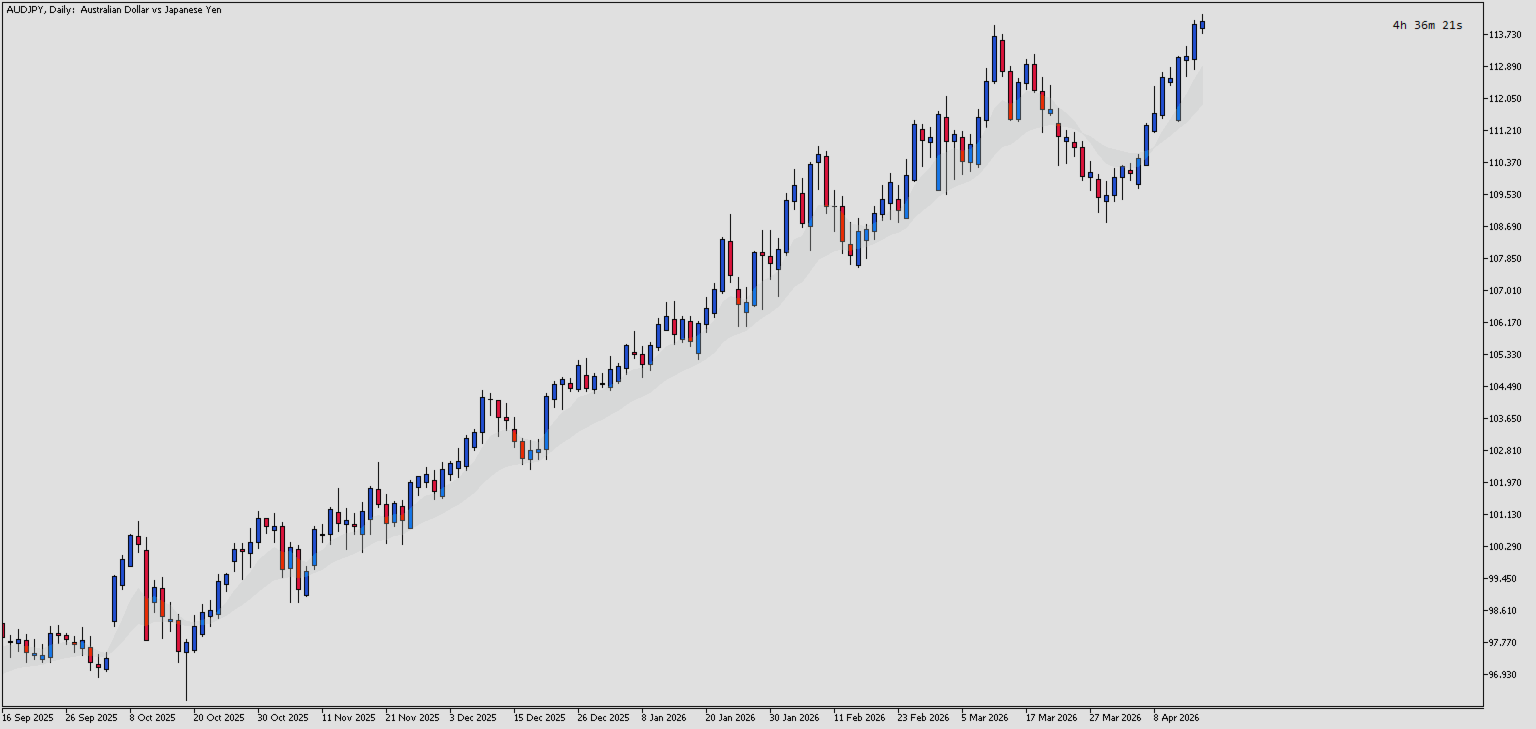
  • Inp Show Zone (default: true) — Controls visibility of the filled zone between the two EMAs. Set to false to display only the EMA lines without the fill.
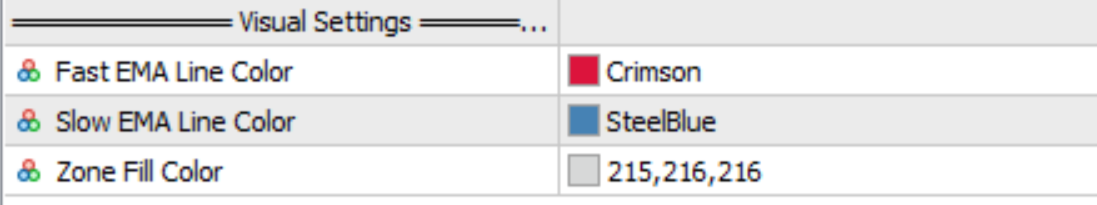
Visual Settings

  • Inp Fast Color (default: clrCrimson) — Color of the Fast EMA line. Choose a color that contrasts well with your chart background.
  • Inp Slow Color (default: clrSteelBlue) — Color of the Slow EMA line. Choose a distinct color from the Fast EMA for easy differentiation.
  • Inp Zone Color (default: clrLightGray) — Color of the filled zone between the EMAs. Semi-transparent or light colors work best to avoid obscuring price candles.


Produtos recomendados
Cvd Divergence
Thalles Nascimento De Carvalho
CVD Divergence – Análise Profissional de Fluxo e Divergências O CVD Divergence é um indicador técnico desenvolvido para detectar divergências confiáveis entre o preço e o Cumulative Delta Volume (CVD). Ele identifica com precisão momentos em que o fluxo real de ordens não confirma o movimento do preço, revelando possíveis reversões, exaustões e manipulações institucionais. O indicador combina leitura de volume agressivo com análise estrutural do preço, entregando sinais claros, objetivos e antec
FXC iDeM-DivergencE MT5 Indicator This is an advanced DeMarker indicator that finds trend-turn divergences on the current symbol. The indicator detects divergence between the DeMarker and the price movements as a strong trend-turn pattern. Main features: Advanced divergence settings Price based on Close, Open or High/Low prices Give Buy/Sell open signals PUSH notifications E-mail sending Pop-up alert Customizeable Information panel Input parameters: DeM Period: The Period size of the DeMarker in
FXC iMACD-DivergencE MT5 Indicator This is an advanced MACD indicator that finds trend-turn divergences on the current symbol. The indicator detects divergence between the MACD and the price movements as a strong trend-turn pattern. Main features: Advanced divergence settings Price based on Close, Open or High/Low prices Give Buy/Sell open signals PUSH notifications E-mail sending Pop-up alert Customizeable Information panel Input parameters: MACD Fast-EMA: The Fast-EMA variable of the MACD indi
Stochastic R
Antony Augustine
Stochastic  Reversal  allows you to recognize reversals professionally. Stochastic Indicator: This technical indicator was developed by George Lane more than 50 years ago. The reason why this indicator survived for so many years is because it continues to show consistent signals even in these current times. The Stochastic indicator is a momentum indicator that shows you how strong or weak the current trend is. It helps you identify overbought and oversold market conditions within a trend.  Rules
MACDivergence MTF MT5
Pavel Zamoshnikov
4 (5)
Advanced ideas of the popular MACD indicator: It detects and displays classic and reverse divergences (two methods of detecting divergences). It uses different color to highlight an uptrend and a downtrend. Two methods of determining a trend: а) MACD crosses the 0 level (classic signal); б) MACD crosses its own average (early signal). This is a multi-timeframe indicator: it can display MACD data from other timeframes. Two methods of drawing: classic histogram and line. It generates sound and vis
RBreaker
Zhong Long Wu
RBreaker Gold Indicators é uma estratégia de negociação intradiária de curto prazo para futuros de ouro que combina duas abordagens: o seguimento de tendência e as reversões intradiárias. Ela permite capturar lucros durante mercados em tendência e também realizar lucros oportunamente e operar na direção oposta quando o mercado se reverte. Esta estratégia foi classificada por 15 anos consecutivos entre as dez estratégias de negociação mais lucrativas pela revista americana Futures Truth. Ela pos
The Trend Duration Forecast MT5 indicator is designed to estimate the probable lifespan of a bullish or bearish trend. Using a Hull Moving Average (HMA) to detect directional shifts, it tracks the duration of each historical trend and calculates an average to forecast how long the current trend is statistically likely to continue. This allows traders to visualize both real-time trend strength and potential exhaustion zones with exceptional clarity. KEY FEATURES Dynamic Trend Detection:   Utiliz
Noize Absorption Index - is the manual trading system that measures the difference of pressure between bears forces and bulls forces. Green line - is a noize free index that showing curent situation. Zero value of index shows totally choppy/flat market.Values above zero level shows how powerfull bullish wave is and values below zero measures bearish forces.Up arrow appears on bearish market when it's ready to reverse, dn arrow appears on weak bullish market, as a result of reverse expectation.
Histograma de Rendimento L&S Caicai Aviso Importante: Este indicador é uma ferramenta integrante do robô automatizado EA Caicai Long and Short Pair Trading . Este indicador exibe visualmente o desvio percentual (Yield %) do spread atual de um par em relação à sua própria média histórica. É excelente para visualizar rapidamente o potencial financeiro bruto de uma distorção. Principais Funcionalidades: Visualização em Percentual: Entenda facilmente o tamanho da distorção em termos percentuais. Múl
The Optimized MACD Divergence indicator is a powerful tool designed to identify potential trading opportunities by detecting divergences between price action and the MACD indicator. It combines classic divergence analysis with candlestick pattern recognition and volume filtering to provide more accurate and reliable signals. How it Works The indicator operates on the following principles: MACD Calculation:   It calculates the MACD indicator using user-defined parameters for fast EMA, slow EMA,
Fractals
Mikhail Nazarenko
The Fractals indicator displays on the chart only fractals with the specified parameters in the indicator settings. This allows you to more accurately record a trend reversal, excluding false reversals. According to the classical definition of a fractal, it is a candlestick - an extremum on the chart, which was not crossed by the price of 2 candles before and 2 candles after the appearance of a fractal candle. This indicator provides the ability to adjust the number of candles before and after t
Nova AC Trader is a modern automation of the Accelerator Oscillator (AC) — a Bill Williams momentum tool designed to detect shifts in market acceleration before trends fully form. This EA transforms the indicator’s early-warning nature into a structured trading system that reacts only when momentum changes are clear and consistent. Instead of waiting for the trend to be obvious, Nova AC Trader identifies when market acceleration starts to turn — offering opportunities at the earliest stage of mo
Supertrend indicator uses a combination of a moving average and average true range to detect the trend of a trading instrument. Supertrend indicator for MetaTrader 5 easily shows the trend as a line following the price. Triple SuperTrend Histo indicator  calculate  three supertrends to show the trend as a histogram. Changing the color from red to green means you can BUY , from green to red means you can SELL . Description of the method of drawing a histogram. The price is above the EMA 200,
The  SuperTrend Advance Trading  is a widely-used technical indicator based on  SuperTrend Strategy + Price Action + EMA . How it works: -  Buy/Sell Signals  can be generated when the trend reverses, the conditions of Price action, TrendLine and EMA are met. - After the  Signal  appears, be patient and wait until the candle closes, at that time place the order as soon as possible. You may have time to review your entry, consider whether it is a good entry or not. - Carefully review the entry, up
Rainbow EA MT5
Jamal El Alama
Description : Rainbow EA MT5 is a simple Expert advisor based on   Rainbow MT5 indicator witch is based on Moving average with period 34. The indicator is incorporated in the EA, therefore, it is not required for the EA to operate, but if you wish, you can download it from   my product page . The Expert Advisor settings are as follows : Suitable for Timeframes up to H1 The parameters below can be set according to your trading rules. StopLoss ( Stop Loss in pips) TakeProfit ( Take Profit in pips
Gekko MACD Plus
Rodrigo Galeote
3 (3)
Nome:  Gekko MACD Plus Tipo:  Osciladores Descrição: Este é o indicador MACD customizado da Gekko Trading, a versão customizada do famoso MACD. Use o MACD tradicional mas com a vantagem de configurar diferentes tipos de sinal de entrada e várias formas de ser alertado todas vez que houver um possível ponto de entrada ou saída do mercado. Parâmetros de Entrada: Fast MA Period:  Período da Média Móvel Rápida do MACD (padrão 12); Slow MA Period:  Período da Média Móvel Lenta do MACD (padrão 26); Si
The indicator identifies divergences between chart and RSI, with the possibility of confirmation by stochastics or MACD. A divergence line with an arrow appears on the chart when divergence is detected after the current candle has expired. There are various filter parameters that increase the accuracy of the signals. To identify a divergence, point A must be set in the RSI, then point B Value must be edited, which sets the difference between point A and point B. The indicator can be used for tim
Schaff Trend Cycle STC
Mohammad Taher Halimi Tabrizi
The Schaff Trend Cycle indicator is the product of combining Slow Stochastics and the moving average convergence/divergence (MACD). The MACD has a reputation as a trend indicator, but it's also notorious for lagging due to its slow responsive signal line. The improved signal line gives the STC its relevance as an early warning sign to detect currency trends. this indicator is converted from Trading View code of STC Indicator - A Better MACD [SHK]
Advanced Trading Chaos  The main purpose of the indicator is to help the trader detect the signals described by Bill Williams in his books to make a quick and correct trading decision. 1)Bullish/Bearish Reversal Bar(BDB) 2) Divergent Bar(DB) 3) Second Sage Signal — the third consecutive Awesome Oscillator bar  4) Working fractals (Fractals that worked above/below the red forehead  5) Three bar coloring modes 5.1) Coloring of bars according to the AO indicator (Including the squatting bar) 5.2
Технический индикатор Universal Oscillator является комбинацией торговых сигналов самых популярных и широко используемых осцилляторов. Индикатор представлен гистограммами, а также линиями fast и slow MA, что позволяет расширить список получаемых торговых рекомендаций и работать как по тренду, так и в боковом движении рынка. Таким образом, гистограммы позволяют определить момент пробоя ценовых значений и движение в новой фазе рынка, а линии указывают на зоны перекупленности и перепроданности.  Ос
The " Stochastic Advanced " indicator displays the signals of the 'Stochastic" indicator directly on the chart without the presence of the indicator itself at the bottom of the screen. The indicator signals can be displayed not only on the current timeframe, but also on a timeframe one level higher. In addition, we have implemented a filter system based on the Moving Average indicator. Manual (Be sure to read before purchasing) | Version for MT4 Advantages 1. Displaying the signals of the "Stoch
The   Trendlines Oscillator   helps traders identify trends and momentum based on the normalized distances between the current price and the most recently detected bullish and bearish trend lines. The indicator features bullish and bearish momentum, a signal line with crossings, and multiple smoothing options. USAGE The   Trendlines Oscillator   works by systematically: Identifying pivot highs and lows. Connecting pivots to form bullish (support) and bearish (resistance) trendlines. Measuring
Stochastic Divergen MT5
Komang Putra Riswanjaya
2 (1)
Overview The Stochastic Divergence Indicator is a tool designed to help identify potential market turning points by analyzing divergences between price and the Stochastic Oscillator. It highlights divergence signals visually on the chart, assisting traders in observing possible trend changes. Key Features No Repaint: Once a signal is formed, it remains on the chart. Adjustable Parameters: Settings can be modified to fit different trading preferences and timeframes. Visual Display: Arrows are plo
Vortex MT5
KEENBASE SOFTWARE SOLUTIONS
The Vortex Indicator was first presented by Douglas Siepman and Etienne Botes in January 2010 edition of Technical Analysis of Stocks & Commodities. Despite its based on a complex implosion phenomenon, the vortex is quite simple to interpret. A bullish signal is generated when +VI line cross above the -VI line and vice versa. The indicator is mostly used as a confirmation for trend trading strategies. The Vortex was inspired by the work of Viktor Schauberger, who studied the flow of water in tur
SuperTrend Catcher
Wycliffe Wanjala Wanyonyi
Supertrend Catcher (MT5 Indicator) A clean, visual “smart structure” indicator that helps you spot momentum shifts fast. It draws recent Order Blocks (OB) with Break of Structure (BOS) , a dynamic baseline (support/resistance), entry/SL/TP suggestions , and a compact info panel . It now includes real-time alerts (terminal/push/sound) when a fresh signal appears.   Why traders like it Clear structure at a glance: BOS lines + filled OB zones show where price imbalanced and where it may return. Act
Fit line supports to extrapolation next movement of market, support for buy/sell decision. Indicator using spline algorithm to extrapolation.  You can change number of spline with parameter "PointsNumber" and number of extrapolation point with "ExtrapolateBars". Eextrapolation points will be save into csv format, with prefix in parameter "PointsPrefix", and store in folder File of Data Folder.
TRI Visualizer
Yoshimi Mon 三 Ura
TRI Visualizer MT5 – Thermodynamic Market Analysis Overview The TRI (Thermal Range Indicator) Visualizer Enhanced is a rare market analysis indicator that goes beyond conventional technical analysis, applying principles of thermodynamics from physics. It interprets market price fluctuations as “thermodynamic energy,” enabling the highly accurate detection of subtle market changes that are often overlooked. Innovative Mechanisms 1. Dual Calculation Engines Classic TRI Mode Formula: |Close
MACD Color Histogram
German David Nino Cifuentes
5 (1)
O indicador MACD Histogram é uma versão atualizada do indicador MACD, projetada para facilitar aos traders a compreensão das tendências do mercado e das mudanças de momentum. Ao contrário do MACD original, esta versão inclui um histograma, que é um gráfico de barras que mostra a diferença entre duas linhas: a linha MACD e a linha de sinal. Veja como funciona: quando a linha MACD está acima da linha de sinal, sugere um mercado de alta, e as barras do histograma são mostradas em verde. Por outro l
O MACD Multicurrency Scanner MT5 é um indicador de trading avançado projetado para analisar múltiplos pares de moedas usando a estratégia de Convergência e Divergência da Média Móvel (MACD). Esta ferramenta é perfeita para traders que buscam otimizar seu desempenho de trading ao identificar potenciais sinais de compra e venda em vários períodos de tempo. Com sua interface amigável, o MACD Multicurrency Scanner MT5 capacita os traders a tomarem decisões informadas. Ao fornecer alertas em tempo re
RSI MultiTF
Mael Francois Claude Deman
RSI-MULTI – Multi-Timeframe Trend & Volatility Indicator Description: RSI-MULTI is a powerful monitoring tool based on the Money Flow Index (MFI), specifically designed for   swing traders . It allows you to analyze   trend direction and volatility across multiple timeframes simultaneously , without switching between charts. Thanks to a clear and intuitive visual interface (built-in HUD), MFI-MULTI displays: The trend direction per timeframe , calculated from the   average angle of the
Os compradores deste produto também adquirem
SuperScalp Pro
Van Minh Nguyen
4.55 (20)
SuperScalp Pro – Sistema avançado de indicador de scalping com múltiplos filtros SuperScalp Pro é um sistema avançado de indicador de scalping que combina o clássico Supertrend com múltiplos filtros inteligentes de confirmação. O indicador opera de forma eficiente em todos os timeframes de M1 a H4 e é especialmente adequado para XAUUSD, BTCUSD e principais pares Forex. Pode ser usado como sistema independente ou integrado de forma flexível a estratégias de trading existentes. O indicador integra
Entry In The Zone and SMC Multi Timeframe is a real-time 2-in-1 market analysis tool that combines market structure analysis and a No Repaint BUY / SELL signal system into a single indicator, built on Smart Money Concepts (SMC) — a widely adopted framework used by professional traders to understand market structure. This indicator helps you see the market more clearly, make decisions based on structure rather than guesswork, and focus on high-probability zones where price is more likely to react
Divergence Bomber
Ihor Otkydach
4.9 (86)
Cada comprador deste indicador recebe adicionalmente, e de forma gratuita: A ferramenta exclusiva "Bomber Utility", que acompanha automaticamente cada operação, define os níveis de Stop Loss e Take Profit e fecha operações de acordo com as regras da estratégia; Arquivos de configuração (set files) para ajustar o indicador em diferentes ativos; Set files para configurar o Bomber Utility nos modos: "Risco Mínimo", "Risco Balanceado" e "Estratégia de Espera"; Um vídeo tutorial passo a passo que aju
Azimuth Pro
Ottaviano De Cicco
5 (6)
Azimuth Pro V2: Estrutura Fractal Sintética e Entradas Confirmadas para MT5 Visão geral Azimuth Pro é um indicador de estrutura swing multinível da Merkava Labs . Quatro camadas de swing aninhadas, VWAP ancorado em swings, detecção de padrões ABC, filtragem estrutural de três timeframes e entradas confirmadas em barra fechada — um gráfico, um fluxo de trabalho dos micro-swings aos macro-ciclos. Este não é um produto de sinais cegos. É um fluxo de trabalho baseado em estrutura para traders que v
Quantum TrendPulse
Bogdan Ion Puscasu
5 (23)
Apresentando   Quantum TrendPulse   , a ferramenta de negociação definitiva que combina o poder do   SuperTrend   ,   RSI   e   Stochastic   em um indicador abrangente para maximizar seu potencial de negociação. Projetado para traders que buscam precisão e eficiência, este indicador ajuda você a identificar tendências de mercado, mudanças de momentum e pontos de entrada e saída ideais com confiança. Principais características: Integração SuperTrend:   siga facilmente a tendência predominante do
Gann Made Easy   é um sistema de negociação Forex profissional e fácil de usar, baseado nos melhores princípios de negociação usando a teoria do sr. W. D. Gann. O indicador fornece sinais precisos de COMPRA e VENDA, incluindo níveis de Stop Loss e Take Profit. Você pode negociar mesmo em movimento usando notificações PUSH. Entre em contato comigo após a compra para receber instruções de negociação e ótimos indicadores extras gratuitamente! Provavelmente você já ouviu muitas vezes sobre os método
Se você comprar este indicador, receberá meu Gerenciador de Operações Profissional + EA  GRATUITAMENTE. Primeiramente, vale ressaltar que este Sistema de Trading é um Indicador Não Repintado, Não Redesenho e Não Atrasado, o que o torna ideal tanto para o trading manual quanto para o automatizado. Curso online, manual e download de predefinições. O "Sistema de Trading Inteligente MT5" é uma solução completa de trading projetada para traders novos e experientes. Ele combina mais de 10 indicadores
FX Trend MT5 NG
Daniel Stein
5 (4)
FX Trend NG: A Nova Geração de Inteligência de Tendência Multi-Mercado Visão Geral FX Trend NG é uma ferramenta profissional de análise de tendências e monitoramento de mercado em múltiplos períodos de tempo. Permite compreender a estrutura completa do mercado em segundos. Em vez de alternar entre vários gráficos, você visualiza instantaneamente quais ativos estão em tendência, onde o momentum está enfraquecendo e onde existe alinhamento forte entre diferentes timeframes. Oferta de Lançamento
OmniSync Projection
Antonio-alin Teculescu
5 (1)
Chronos Fractal Engine is an innovative price projection indicator for MetaTrader 5, designed to transform your technical analysis by intelligently identifying and projecting historical price patterns. Built upon an advanced correlation algorithm and the fractal principles of the market, this powerful tool visualizes potential future price movements, giving you a unique edge in your trading decisions. What is Chronos Fractal Engine? At its core, the Chronos Fractal Engine employs a sophisticat
Apresentando       Quantum Breakout PRO   , o inovador Indicador MQL5 que está transformando a maneira como você negocia Breakout Zones! Desenvolvido por uma equipe de traders experientes com experiência comercial de mais de 13 anos,       Quantum Breakout PRO       foi projetado para impulsionar sua jornada comercial a novos patamares com sua estratégia de zona de fuga inovadora e dinâmica. O Quantum Breakout Indicator lhe dará setas de sinal em zonas de breakout com 5 zonas-alvo de lucro e su
Power Candles MT5
Daniel Stein
4.75 (8)
Power Candles – Sinais de entrada baseados em força para qualquer mercado Power Candles leva a análise de força comprovada da Stein Investments diretamente para o seu gráfico de preços. Em vez de reagir apenas ao preço, cada candle é colorido com base na força real do mercado, permitindo identificar instantaneamente a construção de momentum, aceleração de força e transições limpas de tendência. Uma única lógica para todos os mercados Power Candles funciona automaticamente em todos os símbolos de
CGE Trading Suite
Carl Gustav Johan Ekstrom
5 (2)
Institutional-Grade Analytics for MT5 C GE Trading Suite delivers the analytical edge typically reserved for professional trading desks. The platform integrates a full suite of analytical tools into one seamless workflow: dynamic grid mapping, liquidity behavior analysis, ECM, trend lines, MIDAS, trade cycles, and directional channel projections. Together, these provide a unified view of market structure and momentum. Directional clarity is further enhanced by the capital flow index, which meas
Veja qual estrategia realmente funciona no seu simbolo - antes de arriscar dinheiro real. Power Bar detecta barras de preco extremas em qualquer simbolo e qualquer timeframe, e entao faz backtest instantaneo de 3 estrategias de trading diferentes para que voce possa comparar taxas de acerto, fatores de lucro e P&L lado a lado. Tudo em um unico painel interativo. Sem suposicoes. Sem curve-fitting. Apenas dados. O que torna o Power Bar unico? A maioria dos indicadores fornece um sinal e deixa voc
Meridian Pro
Ottaviano De Cicco
5 (1)
Meridian Pro: Matriz Profissional de Tendência Multi-Timeframe para MT5 Visão geral Meridian Pro é uma matriz de tendência multi-timeframe da Merkava Labs que comprime estado direcional, força, condição de momentum e concordância da matriz em um painel compacto. Um motor adaptativo, aplicado consistentemente de M1 a W1. Sem ajuste por símbolo. Sem acúmulo de indicadores. Uma leitura estruturada em todos os ativos e todos os timeframes. Oferta de lançamento — Obtenha o Meridian Pro por USD 99 (in
Grabber System MT5
Ihor Otkydach
4.83 (23)
Apresento a você um excelente indicador técnico: Grabber, que funciona como uma estratégia de trading “tudo incluído”, pronta para usar. Em um único código estão integradas ferramentas poderosas de análise técnica de mercado, sinais de entrada (setas), funções de alertas e notificações push. Cada comprador deste indicador também recebe gratuitamente: Utilitário Grabber: ferramenta para gerenciamento automático de ordens abertas Vídeo tutorial passo a passo: como instalar, configurar e operar com
Trend Screener Pro MT5
STE S.S.COMPANY
4.85 (104)
Desbloqueie o poder da negociação de tendências com o indicador Trend Screener: sua solução definitiva de negociação de tendências, alimentada por lógica difusa e sistema de múltiplas moedas! Eleve sua negociação de tendências com o Trend Screener, o revolucionário indicador de tendências alimentado por lógica difusa. É um poderoso indicador de acompanhamento de tendências que combina mais de 13 ferramentas e recursos premium e 3 estratégias de negociação, tornando-o uma escolha versátil para to
Vamos ser honestos primeiro. Nenhum indicador sozinho vai te tornar lucrativo. Se alguém te disser o contrário, está te vendendo um sonho. Qualquer indicador que mostre setas perfeitas de compra/venda pode ser feito para parecer impecável — basta dar zoom na parte certa da história e tirar um print das operações vencedoras. Nós não fazemos isso.  SMC Intraday Formula é uma ferramenta. Ela lê a estrutura do mercado para você, identifica as zonas de maior probabilidade de preço e mostra exatament
Btmm state engine pro
Garry James Goodchild
5 (4)
BTMM State Engine Pro is a MetaTrader 5 indicator for traders who use the Beat The Market Maker approach: Asian session context, kill zone timing, level progression, peak formation detection, and a multi-pair scanner from a single chart. It combines cycle state logic with a built-in scanner dashboard so you do not need the same tool on many charts at once. What it does Draws the Asian session range; session times can follow broker server offset or be set in inputs. Tracks level progression (L
Atomic Analyst MT5
Issam Kassas
3.94 (31)
Primeiramente, vale ressaltar que este Indicador de Negociação não repinta, não redesenha e não apresenta atrasos, tornando-o ideal tanto para negociação manual quanto automatizada. Manual do utilizador: configurações, entradas e estratégia. O Analista Atômico é um Indicador de Ação de Preço PA que utiliza a força e o momentum do preço para encontrar uma vantagem melhor no mercado. Equipado com filtros avançados que ajudam a remover ruídos e sinais falsos, e aumentam o potencial de negociação.
Crystal Heikin Ashi Signals
Muhammad Jawad Shabir
5 (2)
Crystal Heikin Ashi Signals - Professional Trend & Signal Detection Indicator Advanced Heikin Ashi Visualization with Intelligent Signal System for Manual & Automated Trading Final Price: $149 ---------> Price goes up $10 after every 10 sales . Limited slots available — act fast . Overview Crystal Heikin Ashi Signals is a professional-grade MetaTrader 5 indicator that combines pure Heikin Ashi candle visualization with an advanced momentum-shift detection system. Designed for both manual traders
Smart Stop Indicator – Precisão inteligente de stop-loss diretamente no seu gráfico Visão geral O Smart Stop Indicator é a solução ideal para traders que desejam definir seu stop-loss de forma clara e metódica, sem adivinhações ou decisões baseadas apenas na intuição. A ferramenta combina lógica clássica de price action (topos mais altos, fundos mais baixos) com um sistema moderno de detecção de rompimentos para identificar onde realmente deve estar o próximo nível lógico de stop. Seja em tend
FX Power MT5 NG
Daniel Stein
5 (31)
FX Power: Analise a Força das Moedas para Decisões de Negociação Mais Inteligentes Visão Geral FX Power é a sua ferramenta essencial para compreender a força real das principais moedas e do ouro em quaisquer condições de mercado. Identificando moedas fortes para comprar e fracas para vender, FX Power simplifica as decisões de negociação e revela oportunidades de alta probabilidade. Quer você prefira seguir tendências ou antecipar reversões usando valores extremos de Delta, esta ferramenta adap
Dark Absolute Trend MT5
Marco Solito
4.57 (14)
Dark Absolute Trend   is an Indicator for intraday trading. This Indicator is based on   Trend Following  strategy but use also candlestick patterns and Volatility. We can enter in good price with this Indicator, in order to follow the main trend on the current instrument. It is advised to use low spread ECN brokers. This Indicator does   Not repaint   and   N ot lag . Recommended timeframes are M5, M15 and H1. Recommended working pairs: All. I nstallation and  Update Guide   -  Troubleshooting
RelicusRoad Pro: Sistema Operacional Quantitativo de Mercado 70% DE DESCONTO ACESSO VITALÍCIO (TEMPO LIMITADO) - JUNTE-SE A 2.000+ TRADERS Por que a maioria dos traders falha mesmo com indicadores "perfeitos"? Porque eles operam Conceitos Únicos no vácuo. Um sinal sem contexto é uma aposta. Você precisa de CONFLUÊNCIA . RelicusRoad Pro não é um simples indicador de seta. É um Ecossistema Quantitativo de Mercado completo. Ele mapeia a "Estrada do Valor Justo", distinguindo ruído de rupturas estru
Market Structure Order Block Dashboard MT5 é um indicador MT5 desenvolvido para traders que querem ler a estrutura de mercado e as principais zonas de reação do preço diretamente no gráfico. Ele combina BOS, ChoCH, Order Blocks, Fair Value Gaps (FVG), Liquidity, Kill Zones, Volume Profile e um dashboard compacto para uma análise rápida. Este indicador foi pensado para traders que usam estrutura de mercado, conceitos ICT e Smart Money como base para tomada de decisão. Ele pode ajudar a identifica
ARICoins
Temirlan Kdyrkhan
ARICoin is a powerful trading companion designed to generate high-probability entry signals with dynamic TP/SL/DP levels based on volatility. Built-in performance tracking shows win/loss stats, PP1/PP2 hits, and success rates all updated live. Key Features: Buy/Sell signals with adaptive volatility bands Real-time TP/SL/DP levels based on ATR Built-in MA Filter with optional ATR/StdDev volatility Performance stats panel (Success, Profit/Loss, PP1/PP2) Alerts via popup, sound, push, or email Cust
ARIPoint
Temirlan Kdyrkhan
ARIPoint is a powerful trading companion designed to generate high-probability entry signals with dynamic TP/SL/DP levels based on volatility. Built-in performance tracking shows win/loss stats, PP1/PP2 hits, and success rates all updated live. Key Features: Buy/Sell signals with adaptive volatility bands Real-time TP/SL/DP levels based on ATR Built-in MA Filter with optional ATR/StdDev volatility Performance stats panel (Success, Profit/Loss, PP1/PP2) Alerts via popup, sound, push, or email Cu
Meravith Scanner
Ivan Stefanov
5 (1)
O MERAVITH SCANNER é um indicador profissional de mercados financeiros para MetaTrader 5 que consolida várias ferramentas analíticas em um único sistema integrado. Ele realiza todos os cálculos automaticamente usando uma metodologia proprietária de preço médio ponderado por volume (VWAP), eliminando completamente a interpretação subjetiva. O indicador funciona em todas as classes de ativos (Forex, Ações, Índices, Commodities, Criptomoedas) e em todos os prazos, de M1 a Mensal. O princípio fundam
Market Structure Patterns
Samuel Manoel De Souza
4.47 (19)
Disponível para   MT4   e   MT5 . Junte-se ao canal Market Structure Patterns para baixar os materiais disponíveis para estudos e informações adicionais. Postagens relacionadas: Market Structure Patterns - Introdução Além dos Order Blocks “Bonitinhos”: Utilizando Análise Volumétrica Real com Market Structure Patterns & Timeless Charts Market Structure Patterns – Complete SMC Indicator Guide (Concepts + Settings) Market Structure Patterns   é um indicador baseado em   smart money concepts   que
Blahtech Supply Demand MT5
Blahtech Limited
4.54 (13)
Was: $299  Now: $99  Supply Demand uses previous price action to identify potential imbalances between buyers and sellers. The key is to identify the better odds zones, not just the untouched ones. Blahtech Supply Demand indicator delivers functionality previously unavailable on any trading platform. This 4-in-1 indicator not only highlights the higher probability zones using a multi-criteria strength engine, but also combines it with multi-timeframe trend analysis, previously confirmed swings a
Mais do autor
Trades History Visualizer is a MetaTrader 5 indicator that displays your trading history directly on the chart, providing a clear visual representation of past trades with additional information. Key Features: Visual trade history display with entry arrows Entry, Stop Loss, and Take Profit horizontal lines Color-coded connector lines between entry and exit points (green for profit, red for loss) Risk-Reward ratio display for each closed trade Profit/Loss amount display option Pip display option
Candle Timer and Spread Display is a lightweight MetaTrader 5 indicator that shows the remaining time until the current candle closes, with an optional spread display. The indicator helps traders track candle timing and monitor spread conditions directly on the chart. Key Features: Real-time countdown timer showing hours, minutes, and seconds until candle close Spread monitoring with live pip/point value display Flexible positioning - place the display in any of the four chart corners Customizab
DrillDown Timeframe is a MetaTrader 5 utility that enables seamless navigation between higher and lower timeframes with visual area highlighting. Draw a rectangle on any timeframe and instantly drill down to see the same price region on a lower timeframe. How it works: Set the Higher and Lower Timeframes in the indicator's variables (Example 1h / 15min) On the selected higher timeframe, press 'B' to create a draggable/resizable rectangle (Blue) in the visible chart area.  Select (double click o
Quick Symbol Switcher is a lightweight MetaTrader 5 indicator that provides fast, keyboard-driven symbol switching directly from your chart. Type a prefix or alias, click or navigate with arrow keys, and instantly switch to any symbol in your Market Watch. Key Features: Instant Symbol Search: Type any prefix to filter symbols in real-time Keyboard Navigation: Use arrow keys to browse, Enter to select, Escape to close Mouse Click Support: Click any item in the dropdown menu to switch instantly Ca
Center Watermark is a lightweight and unobtrusive indicator that displays a customizable watermark text in the center of your MetaTrader 5 chart. Perfect for traders who want to clearly identify the current symbol and timeframe at a glance, or for content creators who need to brand their chart screenshots and recordings. This utility runs efficiently with zero indicator buffers and automatically centers itself on any chart size. The watermark stays in the background and does not interfere with c
Apply Template to All Charts is a lightweight MetaTrader 5 utility script that instantly applies a chart template to all open charts with a single execution. Perfect for traders who manage multiple charts and want to maintain consistent visual settings, indicators, and color schemes across their entire workspace. The script automatically detects the correct template path and apply the. It provides detailed feedback including the template location, list of open charts, and success/failure counts.
Crosshair Sync is a lightweight MetaTrader 5 utility that synchronizes your crosshair position across all open charts in real-time. When analyzing multiple timeframes or symbols, simply press Shift+X to activate the synchronized crosshair, and move your mouse to see the exact same time point highlighted on every chart simultaneously. Key Features: Multi-Chart Synchronization : Automatically syncs the vertical time line across all open charts, allowing you to analyze the same time point on differ
Position Tool Visualizer is a visual trading utility for MetaTrader 5 that helps traders plan and manage their risk-reward ratios directly on the chart. The tool provides three draggable horizontal lines for Entry, Stop Loss, and Take Profit levels, along with filled rectangles showing the risk and reward zones. Key Features: Three Draggable Lines — Entry (blue), Stop Loss (red), and Take Profit (green) lines that can be moved freely on the chart Automatic RR Calculation — Displays the risk-rewa
Currency Strength Monitor is a professional multi-currency strength indicator for MetaTrader 5 that analyzes and displays the relative strength of 8 major currencies (USD, EUR, GBP, AUD, NZD, JPY, CHF, CAD) in real-time. The indicator calculates strength values by aggregating price movements across 28 currency pairs and normalizing them using ATR, providing traders with a clear visual representation of which currencies are strengthening or weakening. Key Features: Multi-Currency Analysis — Monit
Volume with EMA is a professional volume indicator for MetaTrader 5 that displays tick volume with a configurable Exponential Moving Average (EMA) overlay. The indicator enhances volume analysis by color-coding bars based on candle direction and their position relative to the EMA, providing traders with clear visual cues for volume strength and market momentum. Key Features: Volume Histogram with Candle-Matched Colors — Volume bars are color-coded based on candle direction (bullish/bearish), mak
EMA Toggle is a lightweight MetaTrader 5 indicator that displays up to 5 customizable Exponential Moving Averages (EMAs) with instant keyboard-toggle visibility. Each EMA can be independently configured with its own period, color, line width, and style, and toggled on/off using dedicated keyboard shortcuts for rapid chart customization during analysis. if you value a clean chart but still benefit from using EMAs, then this indicator is for you. Toggle on each EMA easily via the keyboard shortcut
Volume Peak Zone is a professional MetaTrader 5 indicator that automatically identifies and visualizes high-volume price zones based on volume profile analysis. The indicator calculates volume distribution across specified price levels and highlights the zones with the highest trading activity, helping traders identify key support and resistance areas / Supply and Demand. Key Features: Dual Timeframe Support — Analyze volume zones from two independent timeframes simultaneously Flexible Range Sel
Filtro:
Sem comentários
Responder ao comentário