FibPiv Zones PRO
- Indicadores
- Versão: 2.2
- Ativações: 5
Fibonacci Pivot Zone Indicator for MetaTrader
Short Description
FibPiv Zones is a technical analysis indicator combining Fibonacci-based levels and pivot point calculations to display support and resistance zones directly on the chart.
Overview
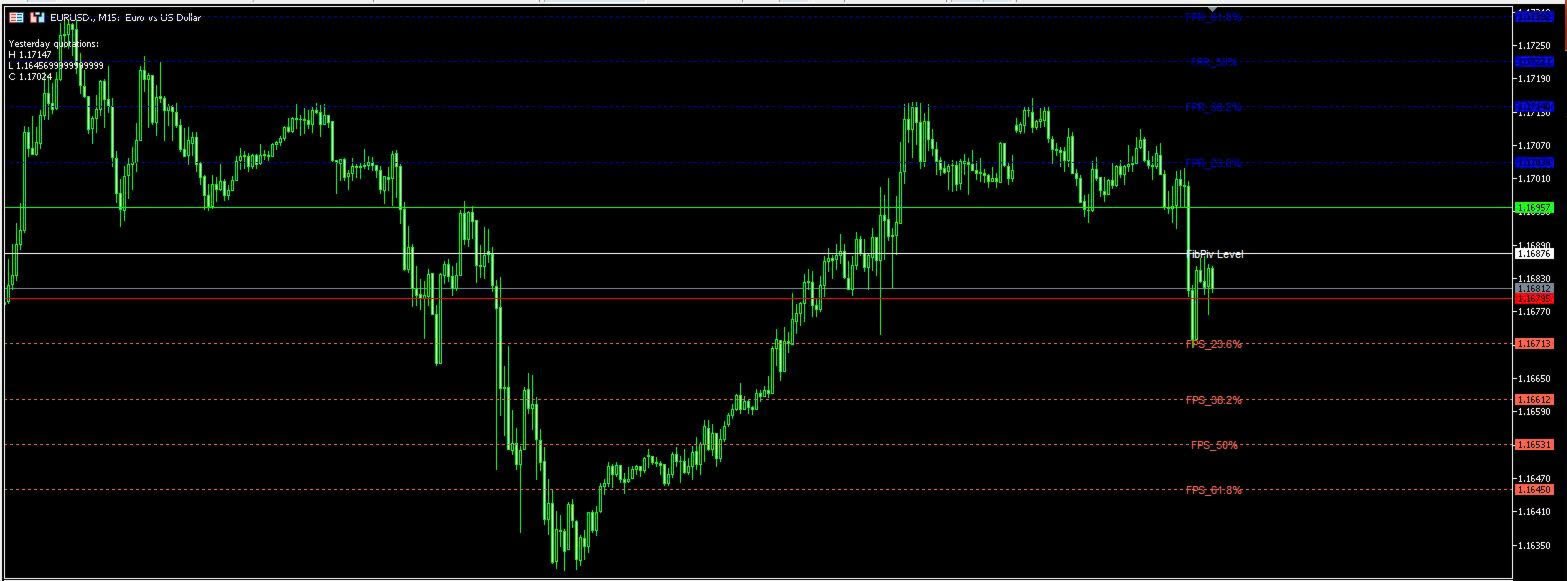
FibPiv Zones is a chart analysis indicator designed to visualize market structure using Fibonacci calculations and pivot point levels.
The indicator automatically generates:
- Fibonacci-based support zones
- Fibonacci-based resistance zones
- Pivot reference levels
- Multi-timeframe level projections
It is intended for traders using support/resistance and price structure analysis workflows.
Main Features
Fibonacci and Pivot Zone Calculation
The indicator combines:
- Fibonacci level calculations
- Pivot point calculations
- Dynamic support and resistance visualization
Levels are calculated automatically based on selected settings and timeframe configuration.
Support and Resistance Visualization
The indicator displays multiple market structure zones directly on the chart.
Functions:
- Resistance zone visualization
- Support zone visualization
- Structured level observation
Displayed levels may be used as part of broader technical analysis workflows.
Multi-Timeframe Support
The indicator supports:
- Current timeframe calculations
- Higher timeframe projection
- Cross-timeframe market observation
This allows traders to monitor larger market structures while remaining on the active chart timeframe.
Alert System
Optional notifications are available when price approaches configured levels.
Supported Alert Types:
- Pop-up alerts
- Sound notifications
Alerts can be enabled or disabled through the input settings.
Input Parameters
Main configurable settings include:
- Timeframe selection
- Fibonacci level configuration
- Pivot calculation method
- Zone colors
- Visualization settings
- Alert activation
These settings allow the indicator to adapt to different trading styles and market conditions.
Usage Applications
The indicator may be used for:
- Support and resistance analysis
- Market structure observation
- Intraday workflows
- Swing trading analysis
- Technical chart analysis
It can also be combined with:
- Trend-following systems
- Oscillators
- Price action analysis
- Multi-timeframe confirmation workflows
Example Workflows
Support Zone Observation
Price interaction near lower Fibonacci pivot zones may be monitored as part of broader market analysis.
Resistance Zone Observation
Price interaction near upper Fibonacci pivot zones may be monitored together with trend or momentum analysis.
Trade Management Planning
Displayed levels may also be used as reference areas for:
- Position planning
- Risk management workflows
- Technical chart observation
Compatibility
Supported Markets:
- Forex
- Stocks
- Indices
- Commodities
- Cryptocurrency
Supported Timeframes:
- All MetaTrader timeframes
The indicator supports multi-timeframe chart operation.
Operational Notes
General Recommendations:
- Test settings according to instrument volatility
- Adjust Fibonacci configurations depending on timeframe selection
- Use additional confirmation methods where appropriate
Indicator behavior may vary depending on market conditions and parameter configuration.
The indicator is intended as a technical analysis tool and does not provide guaranteed market prediction.
Conclusion
FibPiv Zones is a Fibonacci and pivot-based technical analysis indicator combining:
- Fibonacci level calculations
- Pivot zone visualization
- Multi-timeframe support
- Support and resistance analysis
- Configurable alert functions
The indicator is designed for traders using market structure and technical chart analysis workflows.
Suggested Tags
Fibonacci Indicator, Pivot Points, Support Resistance, MT5 Indicator, Technical Analysis, Market Structure, Forex Indicator, Swing Trading, Intraday Trading, Multi Timeframe