QQE Divergen MT5
- Indicadores
-
Komang Putra Riswanjaya
 I am a freelance developer specializing in MQL4, MQL5, and Pine Script, focused on building custom trading solutions for MetaTrader and TradingView platforms.
My services include:
* Expert Advisors (EA)
* Custom Indicators
* Trading Tools & Utilities
* Strategy Automation - Versão: 1.0
- Ativações: 10
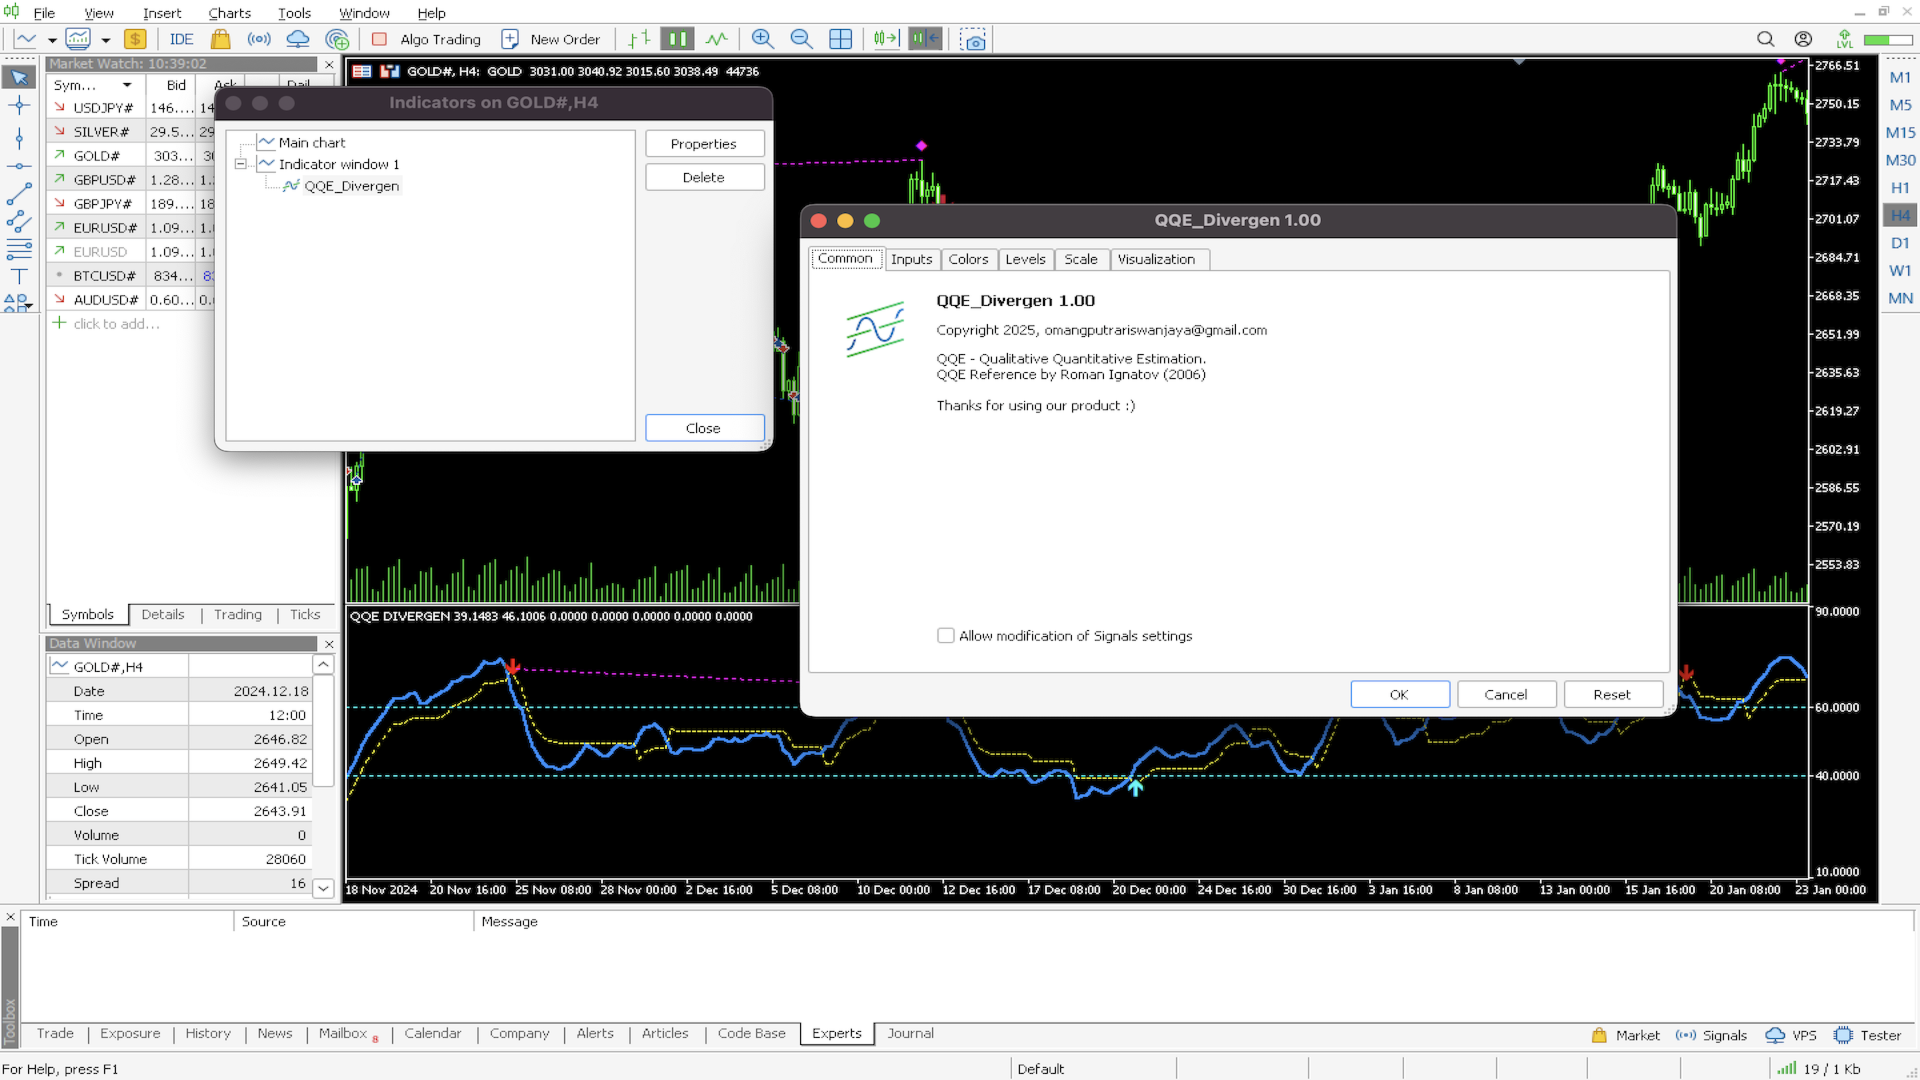
QQE Divergen– Advanced Trading Indicator
Overview
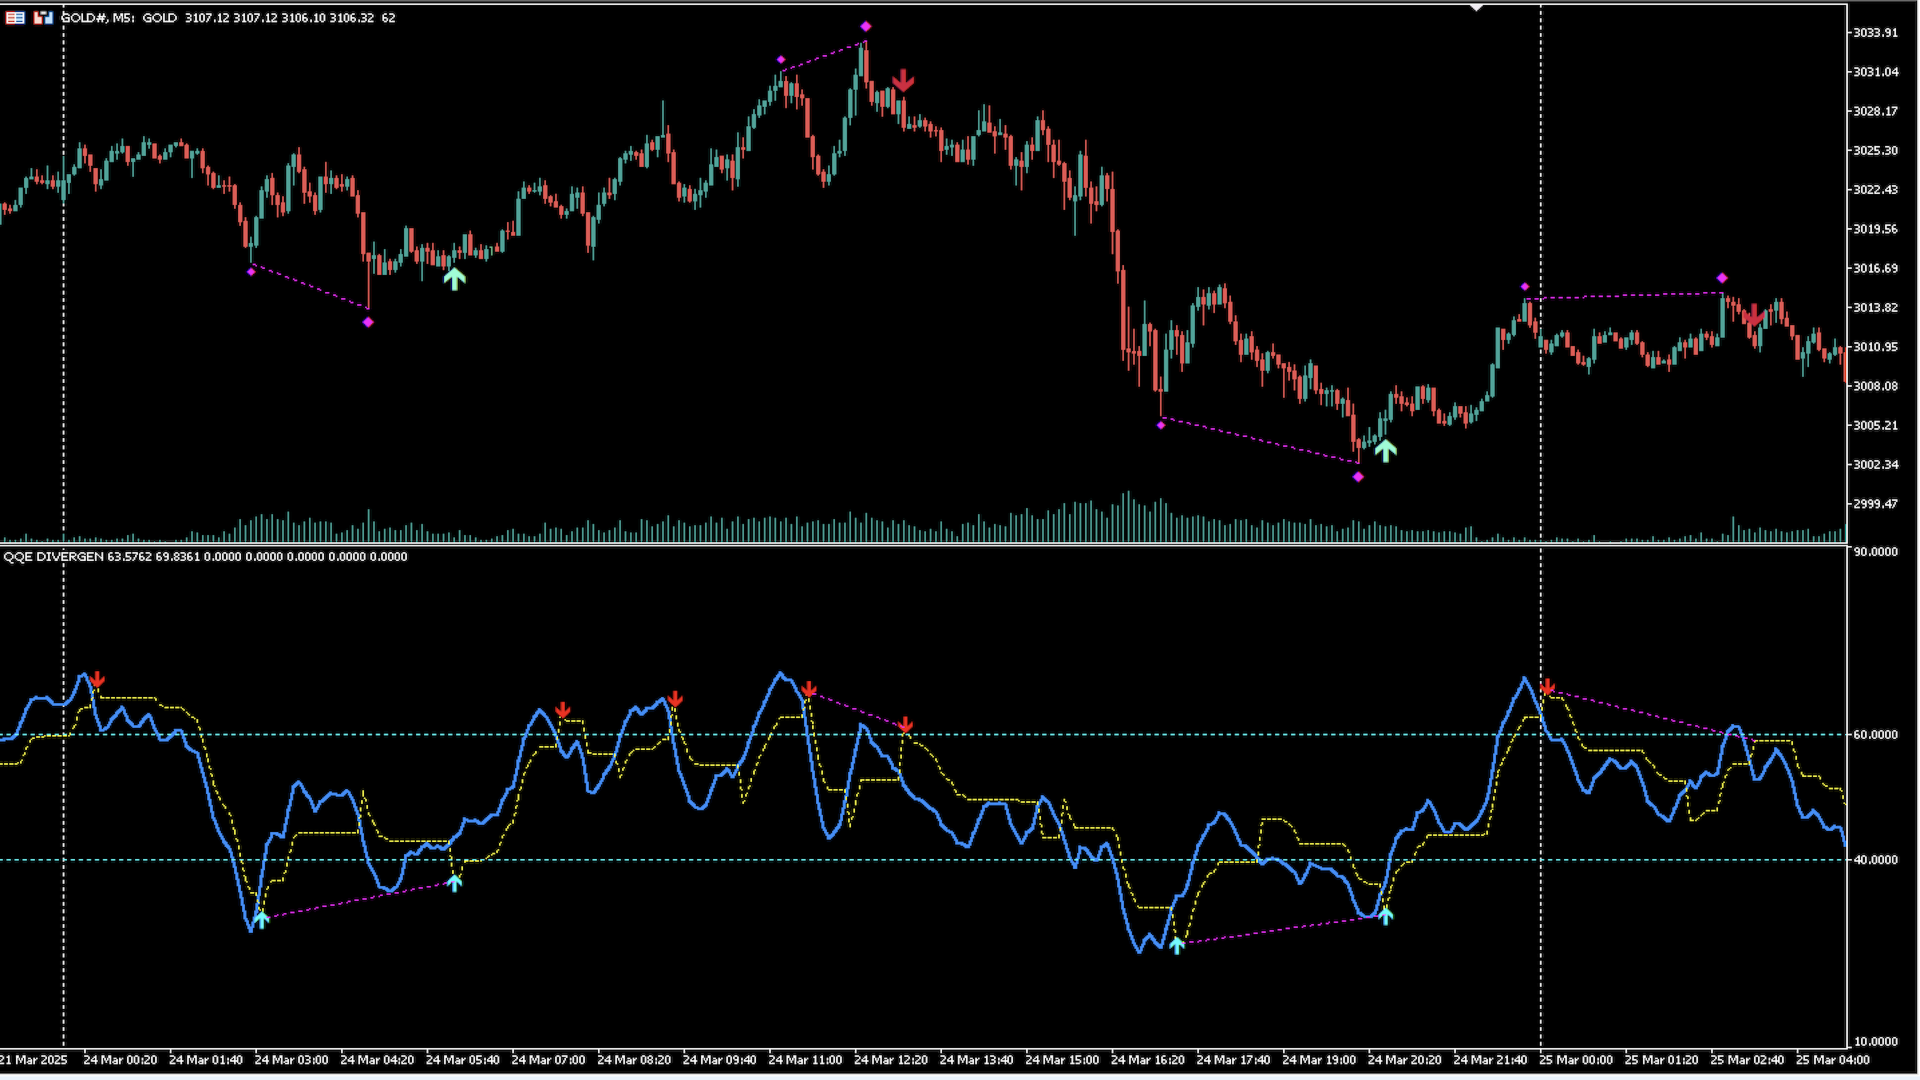
The QQE (Quantitative Qualitative Estimation) indicator is a powerful trading tool designed to enhance trend detection and market momentum analysis. QQE is an advanced version of the RSI (Relative Strength Index) that utilizes smoothed moving averages and dynamic trailing levels to generate highly accurate signals.
QQE Divergen improves upon the traditional QQE by integrating divergence detection, making it even more effective for identifying trend reversals and continuation patterns with precision.
Features :
- Highly Accurate & Non-Repainting– Ensures reliable signals without redrawing.
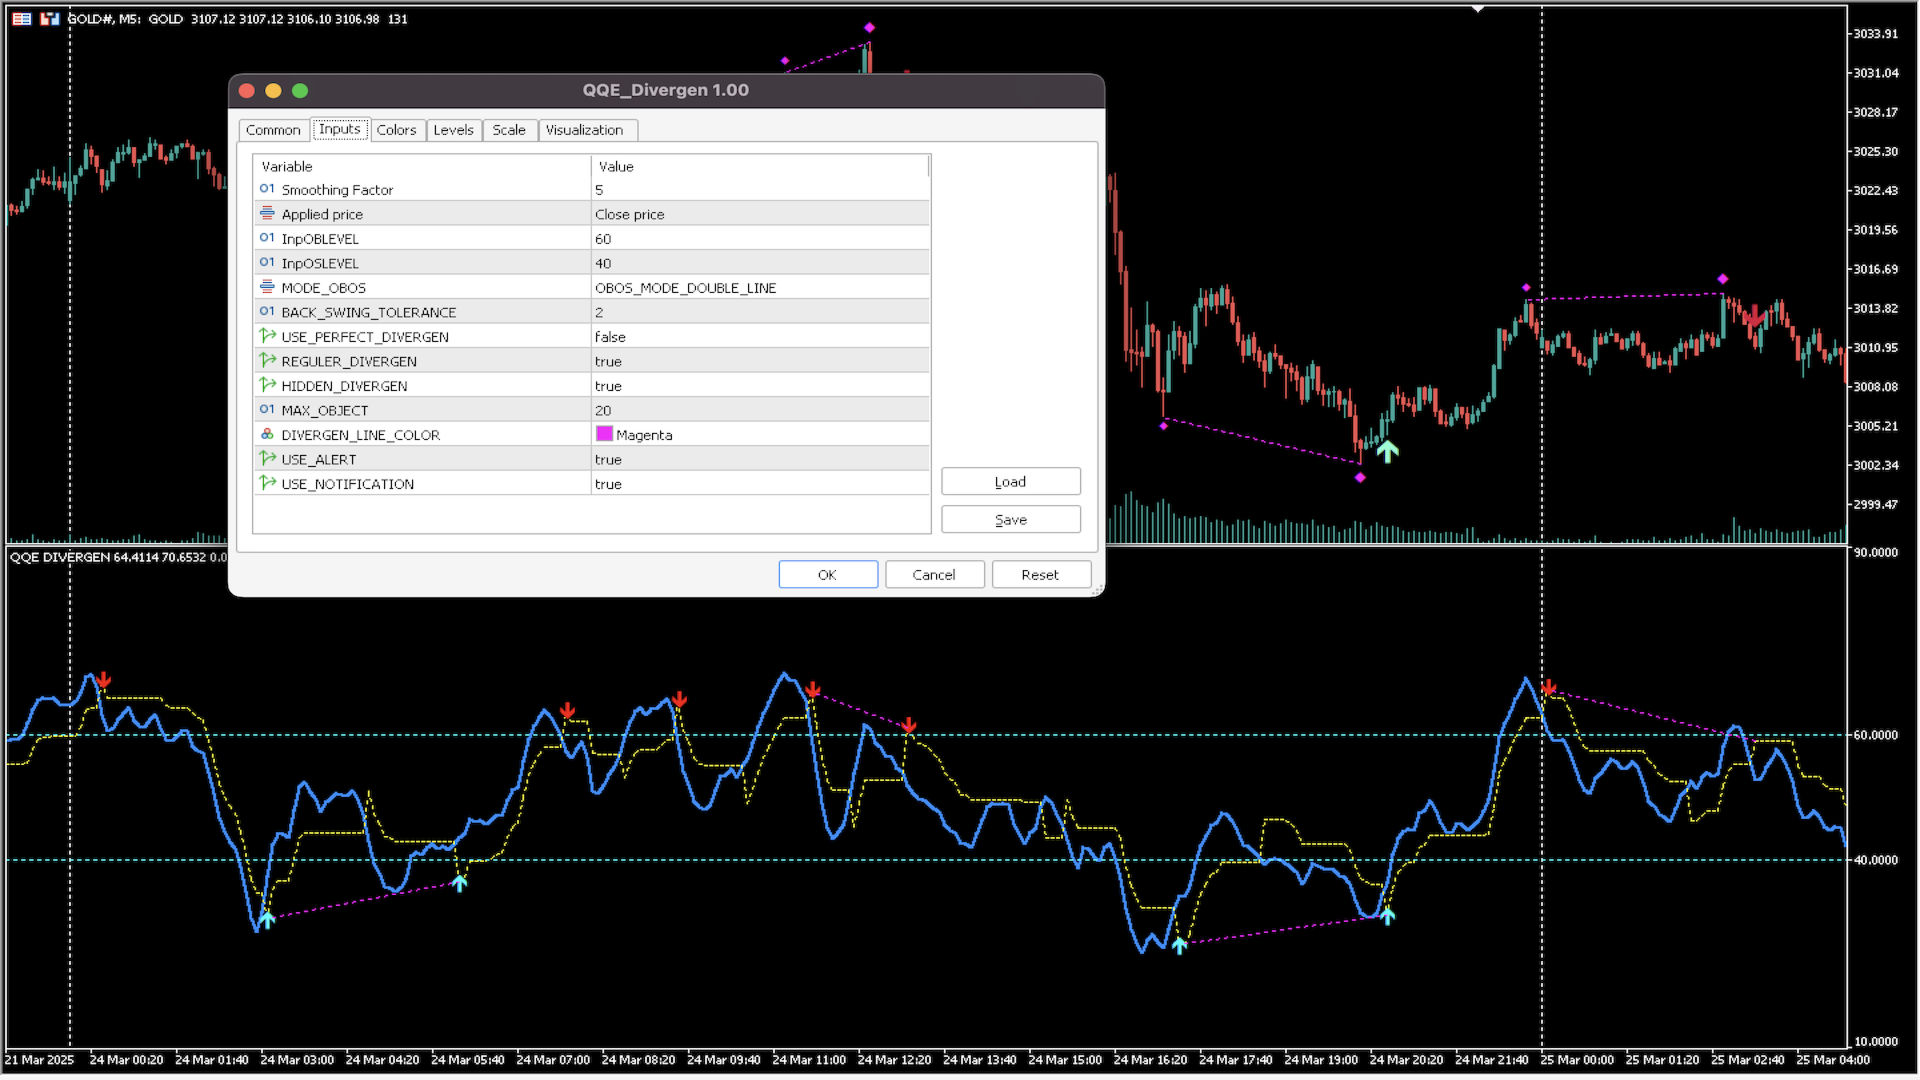
- Multiple Methods Available– Customize it based on your trading needs.
- User-Friendly Interface– Simple and easy to use.
- Built-in Alerts & Push Notifications– Get notified instantly when a signal appears.
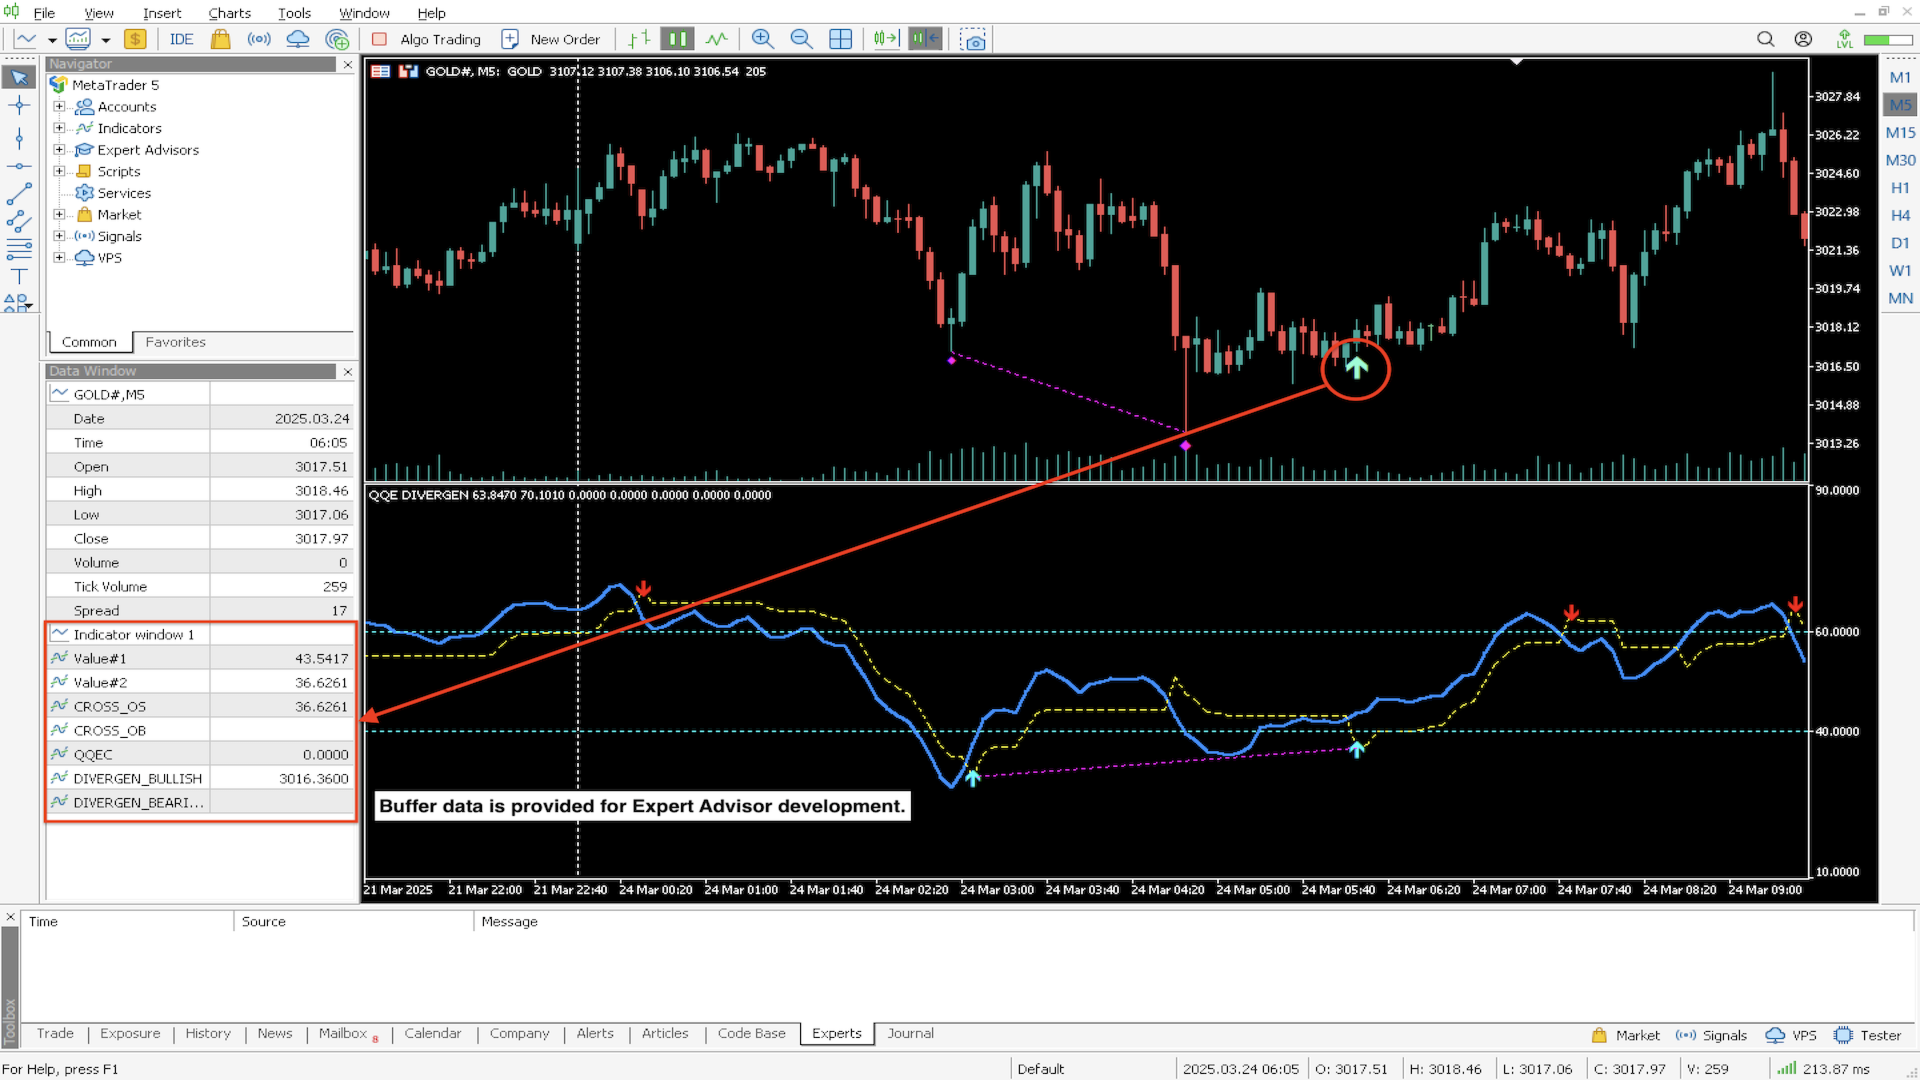
- Data Buffers for EA Development– Seamless integration with automated strategies.
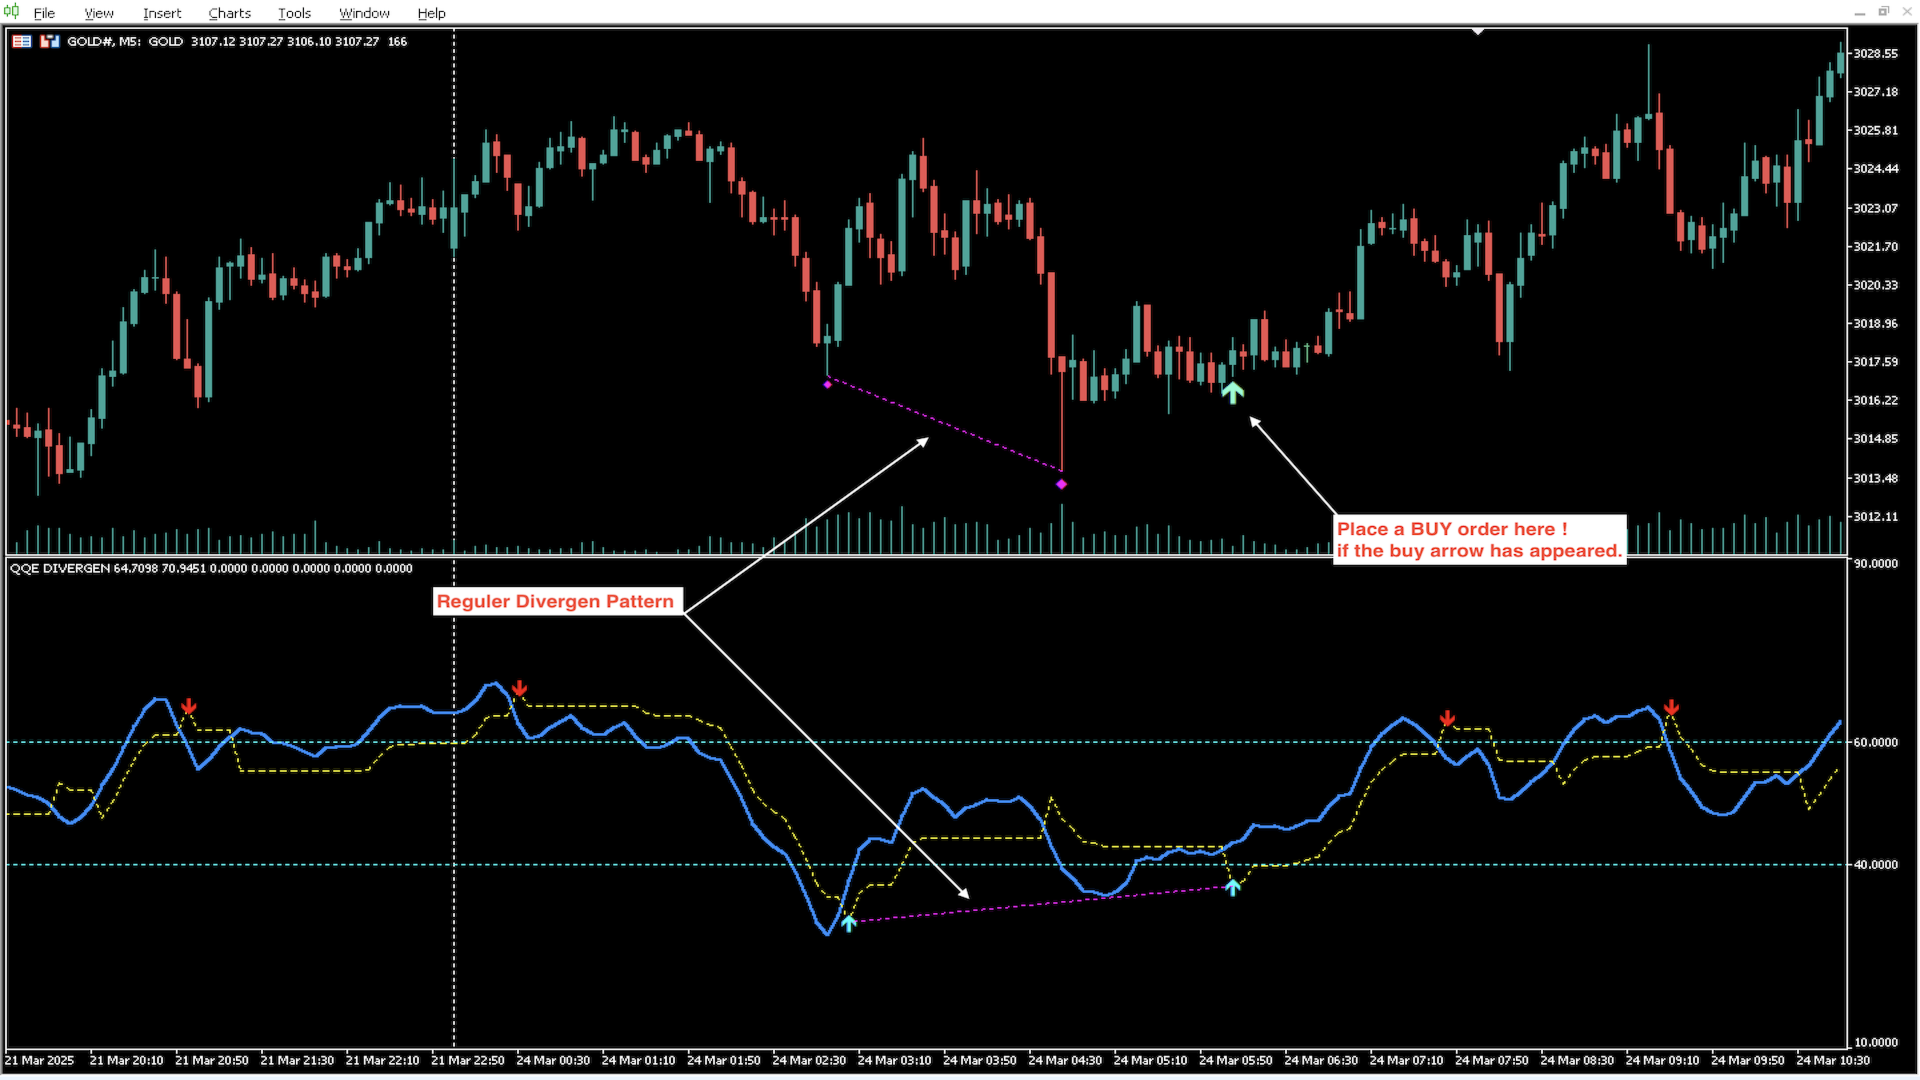
How To Use :
Simply wait for the up/down arrow to appear on your chart to indicate a buy/sell opportunity. It’s that easy!
Perfect for both manual traders and EA developers, QQE Divergen provides a powerful yet simple approach to market analysis. Ready to take your trading to the next level?
Try it today!