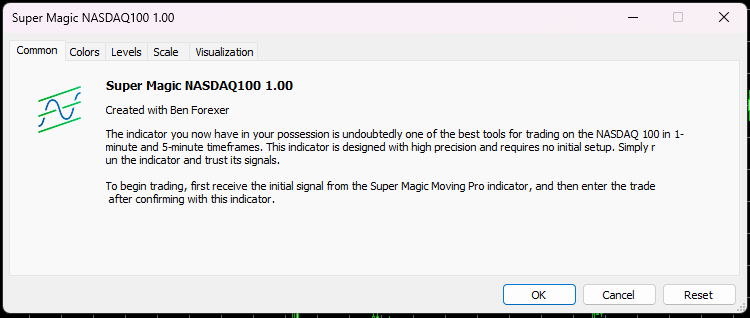
Super Magic NASDAQ100

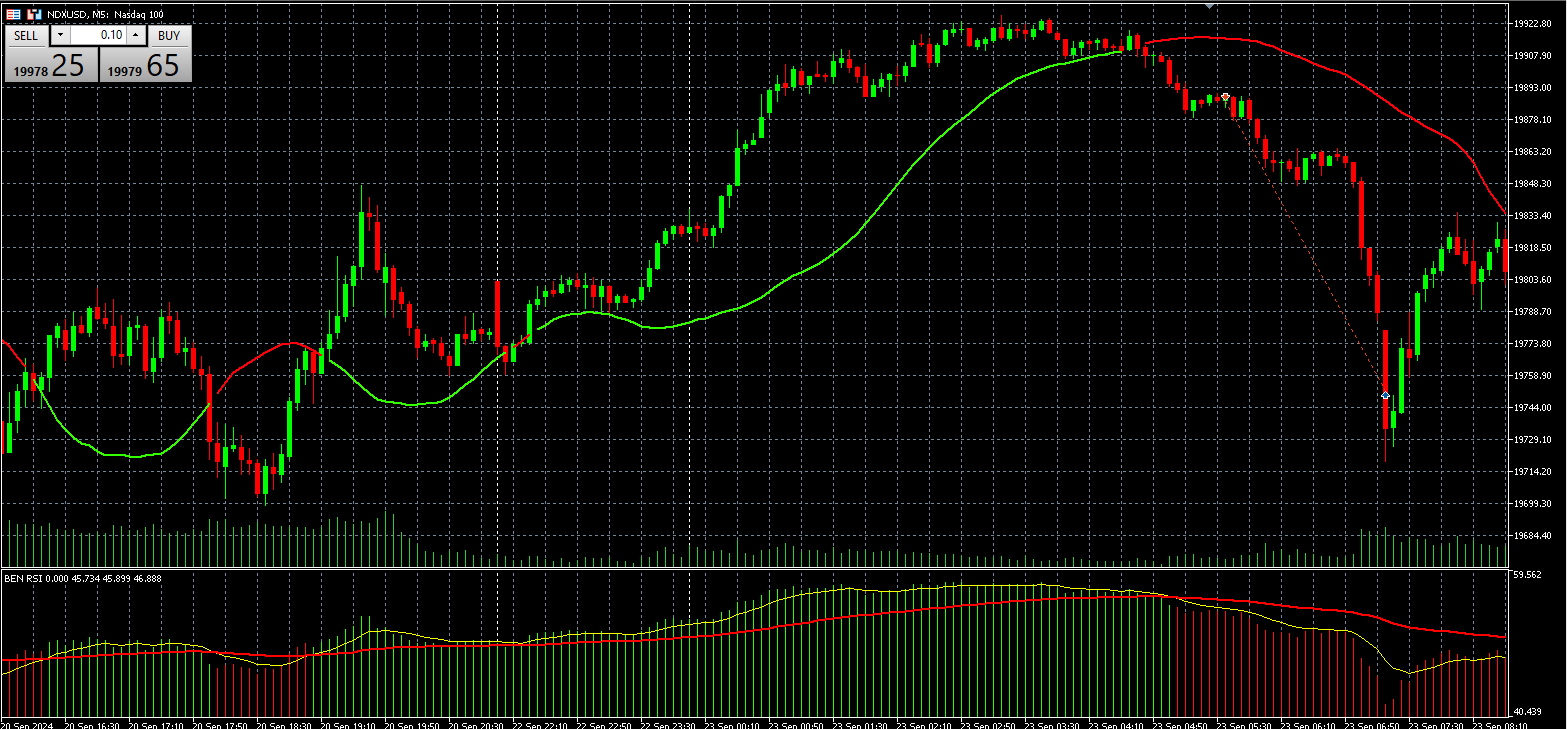
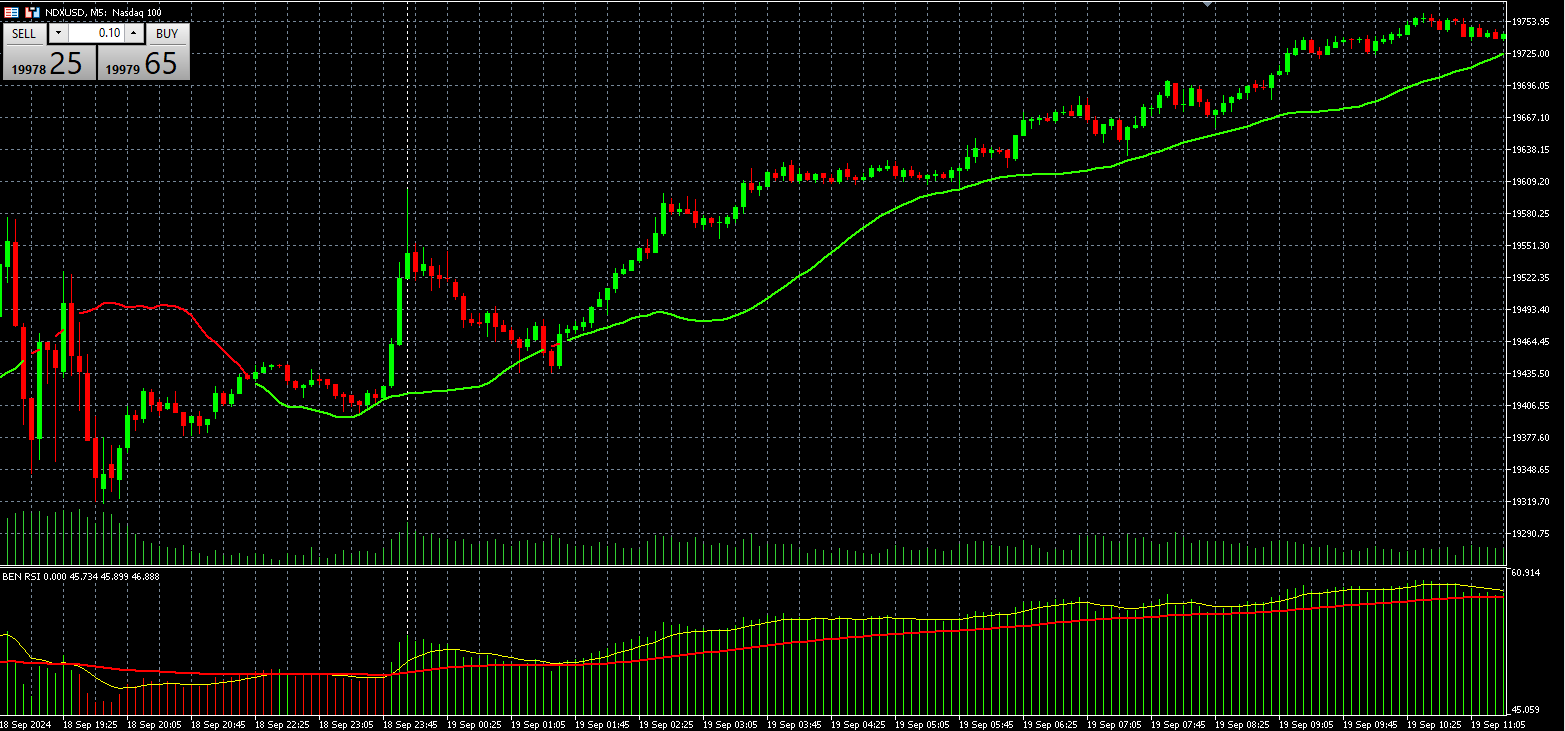
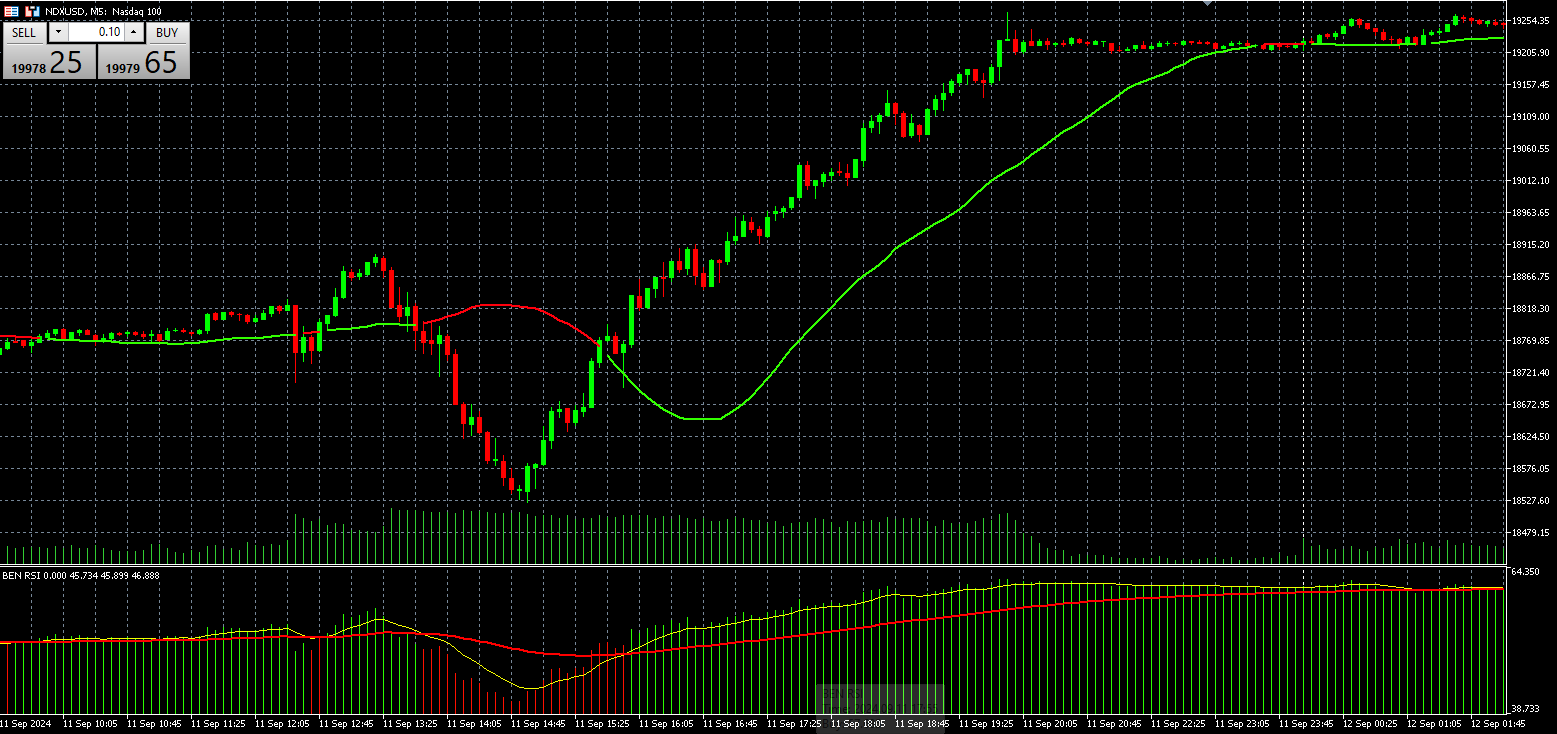
O indicador que você tem em mãos é, sem dúvida, uma das melhores ferramentas para operar no mercado do NASDAQ 100 em intervalos de tempo de 1 minuto e 5 minutos. Este indicador também funciona em outros intervalos de tempo, mas foi projetado especificamente para esses dois. Ele foi desenvolvido com alta precisão e não requer configurações iniciais. Basta executar o indicador e confiar em seus sinais.

Precisão e Eficiência

Esta ferramenta foi rigorosamente calibrada, combinando múltiplos indicadores otimizados com proporções douradas, projetados especificamente para o NASDAQ. Foi testado por um ano e mostrou rentabilidade constante. Ao contrário de muitos indicadores no mercado, este realmente foi feito para ajudar você a alcançar transações lucrativas de forma consistente.

Rentabilidade e Retorno do Investimento

Uma das principais características deste indicador é seu rápido retorno sobre o investimento. Após algumas transações bem-sucedidas, o custo que você pagou por esta ferramenta será rapidamente recuperado. Este indicador não só fornece sinais precisos de entrada, mas também ajuda você a sair no melhor momento para maximizar seus lucros.

Estratégia Mágica Tripla NASDAQ

Este indicador é parte de um sistema de três indicadores chamado estratégia mágica tripla NASDAQ 100. O indicador atual é o componente principal desta estratégia, fornecendo a exatidão e precisão necessárias para que você opere com confiança.

Como Usar e Guia de Negociação

Para começar a operar, primeiro obtenha um sinal inicial do Super Magic Moving Pro. Assim que a primeira vela cruzar completamente a média móvel, e o histograma do indicador confirmar uma mudança de cor, é o momento ideal para entrar na operação.

Nota Importante: Se a vela ainda não cruzou a média móvel, é melhor esperar, pois isso muitas vezes indica que pode haver divergência no mercado e que o sinal pode não estar completamente confirmado. As divergências geralmente fornecem uma boa visão sobre as mudanças potenciais do mercado e oferecem as melhores oportunidades para entrar.

Saída da Operação

O terceiro indicador do sistema, Super Magic SL NASDAQ100, foi projetado para ajudar você a sair no melhor momento. Com esta ferramenta, você pode gerenciar suas operações de forma eficaz e sair quando necessário para bloquear os lucros.

Resumo

Este indicador permite que você opere com confiança e estratégias razoáveis, ajudando a aproveitar as oportunidades de lucro no mercado do NASDAQ. Ferramentas financeiras como esta não são comuns, então aproveite esta oportunidade de ouro para melhorar sua taxa de sucesso em negociações.

Oferta Especial

O preço deste produto será de 500 dólares, mas por tempo limitado estará disponível por 150 dólares. Não perca esta incrível oportunidade!


Produtos recomendados
CosmiCLab SMC FIBO CosmiCLab SMC FIBO is a professional trading indicator designed for traders who use Smart Money Concepts (SMC), market structure analysis and Fibonacci retracement levels. The indicator automatically detects market swings and builds Fibonacci levels based on the latest impulse movement. It also identifies market structure changes such as BOS (Break of Structure) and CHOCH (Change of Character), helping traders understand the current market direction. CosmiCLab SMC FIBO also pr
Noize Absorption Index - is the manual trading system that measures the difference of pressure between bears forces and bulls forces. Green line - is a noize free index that showing curent situation. Zero value of index shows totally choppy/flat market.Values above zero level shows how powerfull bullish wave is and values below zero measures bearish forces.Up arrow appears on bearish market when it's ready to reverse, dn arrow appears on weak bullish market, as a result of reverse expectation.
**   All Symbols   x   All Timeframes   scan just by pressing scanner button ** Discount: The price is $50$, But now it is just $39, Limited time offer is active. *** Contact me  to send you instruction and add you in "Trend Reversal group" for sharing or seeing experiences with other users. Introduction: Trendlines are the most famous technical analysis in trading . Trendlines continually form on the charts of markets across all the different timeframes providing huge opportunities for traders
O indicador SMC Venom Model BPR é uma ferramenta profissional para os traders que trabalham com o conceito Smart Money (SMC). Identifica automaticamente dois padrões principais no gráfico de preços: FVG   (Fair Value Gap) é uma combinação de três velas, em que existe um gap entre a primeira e a terceira velas. Forma uma zona entre níveis onde não há suporte de volume, o que geralmente leva a uma correção de preço. BPR   (Balanced Price Range) é uma combinação de dois padrões FVG que formam uma
Volume Profile V6
Andrey Kolesnik
4.67 (3)
Indicador de perfil de volume de mercado + oscilador inteligente. Funciona em praticamente todos os instrumentos — pares de moedas, ações, futuros, criptomoedas, tanto em volumes reais quanto em ticks. É possível configurar a definição automática do intervalo de construção do perfil (por exemplo, por uma semana ou um mês, etc.), bem como definir o intervalo manualmente movendo os limites (duas linhas verticais: vermelha e azul). É exibido na forma de um histograma. A largura do histograma em um
Antes de tudo, vale ressaltar que esta Ferramenta de Negociação é um Indicador Não Repintante, Não Redesenhante e Não Atrasado, o que a torna ideal para negociação profissional. Curso online, manual do utilizador e demonstração. O Indicador de Conceitos de Ação de Preço Inteligente é uma ferramenta muito poderosa tanto para traders novos quanto experientes. Ele combina mais de 20 indicadores úteis em um único, combinando ideias avançadas de negociação como Análise do Trader do Círculo Interno
O nível Premium é um indicador único com mais de 80% de precisão nas previsões corretas! Este indicador foi testado pelos melhores Especialistas em Negociação por mais de dois meses! O indicador do autor você não encontrará em nenhum outro lugar! A partir das imagens você pode ver por si mesmo a precisão desta ferramenta! 1 é ótimo para negociar opções binárias com um tempo de expiração de 1 vela. 2 funciona em todos os pares de moedas, ações, commodities, criptomoedas Instruções: Assim
"Impulses and Corrections 5" is created to help traders navigate the market situation. The indicator shows multi-time frame upward and downward "Impulses" of price movements. These impulses are the basis for determining the "Base" , which is composed of zones of corrections of price movements, as well as "Potential" zones for possible scenarios of price movement. Up and down impulses are determined based on a modified formula of Bill Williams' "Fractals" indicator. The last impulse is always "U
RBreaker
Zhong Long Wu
RBreaker Gold Indicators é uma estratégia de negociação intradiária de curto prazo para futuros de ouro que combina duas abordagens: o seguimento de tendência e as reversões intradiárias. Ela permite capturar lucros durante mercados em tendência e também realizar lucros oportunamente e operar na direção oposta quando o mercado se reverte. Esta estratégia foi classificada por 15 anos consecutivos entre as dez estratégias de negociação mais lucrativas pela revista americana Futures Truth. Ela pos
The "MR Volume Profile Rectangles 5" indicator is a charting tool that displays trading volume at different price levels rather than time intervals. A key concept in volume profile is the point of control (POC) —the price level with the highest volume traded during the session or time range. While tools like VWAP or OBV provide volume trends, the "MR Volume Profile Rectangles 5" indicator offers granular detail about where the most market activity occurs at specific price levels. This makes it a
Cansado de traçar linhas de suporte e resistência? A Resistência de suporte é um indicador de período múltiplo que detecta e plota automaticamente linhas de suporte e resistência no gráfico com um toque muito interessante: conforme os níveis de preços são testados ao longo do tempo e sua importância aumenta, as linhas se tornam mais espessas e mais escuras. [ Guia de instalação | Guia de atualização | Solução de problemas | FAQ | Todos os produtos ] Melhore sua análise técnica da noite para o d
TRI Visualizer
Yoshimi Mon 三 Ura
TRI Visualizer MT5 – Thermodynamic Market Analysis Overview The TRI (Thermal Range Indicator) Visualizer Enhanced is a rare market analysis indicator that goes beyond conventional technical analysis, applying principles of thermodynamics from physics. It interprets market price fluctuations as “thermodynamic energy,” enabling the highly accurate detection of subtle market changes that are often overlooked. Innovative Mechanisms 1. Dual Calculation Engines Classic TRI Mode Formula: |Close
Pro Gold System Indicator
PEDRO JOAQUIM GONCALVES GOMES
ADVANCED FUNCTIONALITIES: Trend Score (0-100) with visual bar Intelligent signals with adjustable strength (1-10) Risk management with automatic TP/SL Audible and visual alerts Price zones with smooth filling Multi-indicator analysis (RSI, ATR, BB, EMAs) DESIGN FEATURES Modern Visual: Smooth and well-spaced lines (EMA with 2-3px width) Vibrant and professional colors (Sky Blue, Orange, Gold) Modern arrows (code 233/234) for buy/sell signals Configurable dark/light theme Adjustable transparency f
Price Magnet — Price Density and Attraction Levels Indicator Price Magnet is a professional analytical tool designed to identify key support and resistance levels based on statistical Price Density. The indicator analyzes a specified historical period and detects price levels where the market spent the most time. These zones act as “magnets,” attracting price action or forming a structural base for potential reversals. Unlike traditional Volume Profile tools, Price Magnet focuses on price-time d
Was: $249  Now: $99   Market Profile defines a number of day types that can help the trader to determine market behaviour. A key feature is the Value Area, representing the range of price action where 70% of trading took place. Understanding the Value Area can give traders valuable insight into market direction and establish the higher odds trade. It is an excellent addition to any system you may be using. Inspired by Jim Dalton’s book “Mind Over Markets”, this indicator is designed to suit the
This Indicator enhances the default Relative Strength Index (RSI) by introducing several improvements. First, it visually highlights overbought and oversold regions by changing the RSI color from white to red. Second, it includes additional reference lines at 20, 40, 50, 60, and 80, providing a clearer framework for assessing RSI values. The most notable feature is the use of the middle 50-line to indicate the current market cycle. The color of the 50-line dynamically reflects the cycle: green f
Cumulative delta indicator As most traders believe, the price moves under the pressure of market buying or selling. When someone redeems an offer standing in the cup, the deal is a "buy". If someone pours into the bid standing in the cup - the deal goes with the direction of "sale". The delta is the difference between purchases and sales. A cumulative delta - the difference between the cumulative sum of purchases and sales for a certain period of time. It allows you to see who is currently contr
Mine Farm
Maryna Kauzova
Mine Farm is one of the most classic and time-tested scalping strategies based on the breakdown of strong price levels. Mine Farm is the author's modification of the system for determining entry and exit points into the market... Mine Farm - is the combination of great potential with reliability and safety. Why Mine Farm?! - each order has a short dynamic Stop Loss - the advisor does not use any risky methods (averaging, martingale, grid, locking, etc.) - the advisor tries to get the most
Fibo Channels
Jeffrey Quiatchon
Fibo Daily Channel Indicator The  Indicator is a powerful tool for traders, providing precise daily support and resistance levels based on Fibonacci retracement and extension calculations. This indicator automatically draws key pivot points (PP, R1, R2, S1, S2) as well as additional extension levels (R3, R4, S3, S4), helping traders identify potential reversal and breakout zones with ease. It includes customizable alerts and push notifications, allowing traders to receive updates whenever the pr
DAILY OH/OL SDEV QUANT MODEL - STATISTICAL TRADING WITH PRECISION RISK MANAGEMENT TRADE WITH MATHEMATICAL CERTAINTY - KNOW YOUR EXACT STOP-LOSS AND TAKE-PROFIT BEFORE YOU ENTER This indicator analyzes 5,000+ days of price history to give you: Exact entry levels (sigma bands locked at daily open) Exact stop-loss distance (from M
Stratos Pali mt5
Michela Russo
4.5 (8)
Stratos Pali Indicator is a revolutionary tool designed to enhance your trading strategy by accurately identifying market trends. This sophisticated indicator uses a unique algorithm to generate a complete histogram, which records when the trend is Long or Short. When a trend reversal occurs, an arrow appears, indicating the new direction of the trend. Important Information Revealed Leave a review and contact me via mql5 message to receive My Top 5 set files for Stratos Pali at no cost ! Down
Este é sem dúvida o indicador de reconhecimento automático de formação de preço harmônico mais completo que você pode encontrar para a MetaTrader Platform. Ele detecta 19 padrões diferentes, leva as projeções de Fibonacci tão a sério quanto você, exibe a Zona de Reversão Potencial (PRZ) e encontra níveis adequados de stop loss e take-profit. [ Guia de instalação | Guia de atualização | Solução de problemas | FAQ | Todos os produtos ] Detecta 19 formações harmônicas de preços diferentes Traça
Your Trend Friend
Luigi Nunes Labigalini
5 (1)
A tendência é sua amiga! Veja a cor do indicador e faça suas operações nessa direção. Ele não repinta. Ou seja, depois que cada candle se fecha, a cor dele é definitiva e não irá se alterar. Você pode focar em movimentos mais curtos e rápidos ou tendências mais longas, basta testar o que melhor se encaixa no seu operacional de acordo com o ativo e tempo gráfico usado. Altere o parâmetro de entrada "Length" e o indicador irá se adaptar automaticamente (quanto maior ele for, maior a tendência an
PipFinite Exit EDGE MT5
Karlo Wilson Vendiola
4.87 (31)
Did You Have A Profitable Trade But Suddenly Reversed? In a solid strategy, exiting a trade is equally important as entering. Exit EDGE helps maximize your current trade profit and avoid turning winning trades to losers. Never Miss An Exit Signal Again Monitor all pairs and timeframes in just 1 chart www.mql5.com/en/blogs/post/726558 How To Trade You can close your open trades as soon as you receive a signal Close your Buy orders if you receive an Exit Buy Signal. Close your Sell orders if
Volality Index Scalper
Lesedi Oliver Seilane
5 (1)
Volality Index scalper indicator  Meant for Volality pairs such as Volality 10, 25, 50, 75 and 100 The indicator works on all timeframes from the 1 minute to the monthly timeframe the indicator is non repaint the indicator has 3 entry settings 1 color change on zero cross 2 color change on slope change 3 color change on signal line cross Orange line is your sell signal Blue line is your buy signal.
Crash 1000 Scalping Indicator for the Crash 1000 Deriv Synthetic Index. Introduction The Crash 1000 Scalping Indicator is a specialized tool designed for the Crash 1000 index on the Deriv Synthetic market. This indicator is particularly useful for scalping on the M1 timeframe, helping traders to identify precise entry and exit points for buy positions. It is designed to be non-repainting, providing clear signals with audible alerts and push notifications, and is compatible with mobile devices th
No Demand No Supply MT5
Trade The Volume Waves Single Member P.C.
No Demand No Supply   This indicator identifies   No Demand –No Supply candles to your chart and plots volume bars colored according to the signal. It can be applied to all timeframes or to a specific one only. It can also be used as regular volume indicator  with exceptional future of WEIGHTED VOLUME. Furthermore is has an alert notification, sound and email when a signals occurs. The indicator does not repaint but the alert will come on two candles back due to the definition of No Demand No Su
##   ONLY GOLD ##   Тiльки Золото ## **Mercaria Professional Trading Zones - Complete Guide** ## **Mercaria Professional Trading Zones - Повний посібник** ### **How Mercaria Zones Work / Як працюють зони Mercaria** **English:** Mercaria Zones is an advanced trading indicator that identifies high-probability support and resistance areas using ZigZag extremes combined with mathematical zone calculations. The indicator works on multiple timeframes simultaneously, providing a comprehensive view
Delta Profile Volume
Teresinha Moraes Correia
Descrição Técnica do Indicador – Delta Profile para MetaTrader 5 O Delta Profile é um indicador desenvolvido para o MetaTrader 5 com foco em análise detalhada do fluxo de volume dentro de um intervalo definido de candles. Ele organiza e exibe informações sobre o desequilíbrio de volumes positivos (associados a movimentos de alta) e negativos (associados a movimentos de baixa) em diferentes níveis de preço. O resultado é uma visão clara dos pontos do gráfico onde há maior concentração de negócios
# DRAWDOWN INDICATOR V4.0 - The Essential Tool to Master Your Trading ## Transform Your Trading with a Complete Real-Time Performance Overview In the demanding world of Forex and CFD trading, **knowing your real-time performance** isn't a luxury—it's an **absolute necessity**. The **Drawdown Indicator V4.0** is much more than a simple indicator: it's your **professional dashboard** that gives you a clear, precise, and instant view of your trading account status. --- ## Why This Indicator
Os compradores deste produto também adquirem
Azimuth Pro
Ottaviano De Cicco
5 (6)
PROMOÇÃO DE LANÇAMENTO O preço do Azimuth Pro está inicialmente definido em 299$ para os primeiros 100compradores. O preço final será de 499$ . A DIFERENÇA ENTRE ENTRADAS RETAIL E INSTITUCIONAIS NÃO É O INDICADOR — É A LOCALIZAÇÃO. A maioria dos traders entra em níveis de preço arbitrários, perseguindo momentum ou reagindo a sinais atrasados. As instituições esperam o preço atingir níveis estruturados onde oferta e demanda realmente mudam. Azimuth Pro mapeia esses níveis automaticamente: VWA
ARICoins
Temirlan Kdyrkhan
ARICoin is a powerful trading companion designed to generate high-probability entry signals with dynamic TP/SL/DP levels based on volatility. Built-in performance tracking shows win/loss stats, PP1/PP2 hits, and success rates all updated live. Key Features: Buy/Sell signals with adaptive volatility bands Real-time TP/SL/DP levels based on ATR Built-in MA Filter with optional ATR/StdDev volatility Performance stats panel (Success, Profit/Loss, PP1/PP2) Alerts via popup, sound, push, or email Cust
AriX
Temirlan Kdyrkhan
1 (4)
AriX Indicator for MT5 A powerful trend-following and signal-evaluation tool AriX is a custom MT5 indicator that combines Moving Averages and ATR-based risk/reward logic to generate clear buy/sell signals. It visualizes dynamic SL/TP levels, evaluates past trade outcomes, and displays win/loss statistics in a clean on-chart panel. Key features include: Buy/Sell signals based on MA crossovers ATR-based SL/TP1/TP2/TP3 levels with visual lines and labels Signal outcome tracking with real-time stat
ARIPoint
Temirlan Kdyrkhan
ARIPoint is a powerful trading companion designed to generate high-probability entry signals with dynamic TP/SL/DP levels based on volatility. Built-in performance tracking shows win/loss stats, PP1/PP2 hits, and success rates all updated live. Key Features: Buy/Sell signals with adaptive volatility bands Real-time TP/SL/DP levels based on ATR Built-in MA Filter with optional ATR/StdDev volatility Performance stats panel (Success, Profit/Loss, PP1/PP2) Alerts via popup, sound, push, or email Cu
OmniSync Projection
Antonio-alin Teculescu
5 (1)
Chronos Fractal Engine is an innovative price projection indicator for MetaTrader 5, designed to transform your technical analysis by intelligently identifying and projecting historical price patterns. Built upon an advanced correlation algorithm and the fractal principles of the market, this powerful tool visualizes potential future price movements, giving you a unique edge in your trading decisions. What is Chronos Fractal Engine? At its core, the Chronos Fractal Engine employs a sophisticat
Este indicador é um indicador para análise automática de ondas que é perfeito para negociações práticas! Caso... Nota:   Não estou acostumado a usar nomes ocidentais para classificação de ondas. Devido à influência da convenção de nomenclatura de Tang Lun (Tang Zhong Shuo Zen), nomeei a onda básica como   uma caneta   e a banda de onda secundária como   um segmento   . ao mesmo tempo, o segmento tem a direção da tendência.   O segmento de tendência principal   é nomeado (esse método de nomencl
Introduction to X3 Chart Pattern Scanner X3 Cherart Pattern Scanner is the non-repainting and non-lagging indicator detecting X3 chart patterns including Harmonic pattern, Elliott Wave pattern, X3 patterns, and Japanese Candlestick patterns. Historical patterns match with signal patterns. Hence, you can readily develop the solid trading strategy in your chart. More importantly, this superb pattern scanner can detect the optimal pattern of its kind. In addition, you can switch on and off individu
RelicusRoad Pro: Sistema Operacional Quantitativo de Mercado 70% DE DESCONTO ACESSO VITALÍCIO (TEMPO LIMITADO) - JUNTE-SE A 2.000+ TRADERS Por que a maioria dos traders falha mesmo com indicadores "perfeitos"? Porque eles operam Conceitos Únicos no vácuo. Um sinal sem contexto é uma aposta. Você precisa de CONFLUÊNCIA . RelicusRoad Pro não é um simples indicador de seta. É um Ecossistema Quantitativo de Mercado completo. Ele mapeia a "Estrada do Valor Justo", distinguindo ruído de rupturas estru
GEM Signal Pro - Indicador Profissional de Trading Entradas precisas. Zero repaint. Uma decisão de cada vez. GEM Signal Pro é um indicador profissional de seguimento de tendência, desenvolvido para MetaTrader 4 e MetaTrader 5. Foi projetado para traders que exigem sinais limpos e acionáveis, sem o ruído, o atraso ou as falsas promessas que afetam a maioria dos indicadores de varejo. Cada sinal é avaliado por um mecanismo proprietário de confirmação em múltiplas camadas. O que torna o GEM Signal
O indicador " Dynamic Scalper System MT5 " foi desenvolvido para o método de scalping, operando dentro de ondas de tendência. Testado nos principais pares de moedas e ouro, é possível a compatibilidade com outros instrumentos de negociação. Fornece sinais para a abertura de posições de curto prazo ao longo da tendência, com suporte adicional para o movimento dos preços. O princípio do indicador: As setas grandes determinam a direção da tendência. Um algoritmo para gerar sinais de scalping sob
CGE Trading Suite
Carl Gustav Johan Ekstrom
5 (1)
CGE Trading Suite delivers the analytical edge typically reserved for professional trading desks. This 1440p optimized platform integrates a full suite of analytical tools into one seamless workflow: dynamic grid mapping, liquidity behavior analysis, ECM, trend lines, MIDAS, trade cycles, and directional channel projections. Together, these provide a unified view of market structure and momentum. Directional clarity is further enhanced by the capital flow index, which measures currency basket st
ARIScalping
Temirlan Kdyrkhan
ARIScalp is a powerful trading companion designed to generate high-probability entry signals with dynamic TP/SL/DP levels based on volatility. Built-in performance tracking shows win/loss stats, PP1/PP2 hits, and success rates all updated live. Key Features: Buy/Sell signals with adaptive volatility bands Real-time TP/SL/DP levels based on ATR Built-in MA Filter with optional ATR/StdDev volatility Performance stats panel (Success, Profit/Loss, PP1/PP2) Alerts via popup, sound, push, or email Cus
TPA True Price Action indicator reveals the true price action of the market makers through 100% non-repainting signals strictly at the close of a candle! TPA shows entries and re-entries, every time the bulls are definitely stronger than the bears and vice versa. Not to confuse with red/green candles. The shift of power gets confirmed at the earliest stage and is ONE exit strategy of several. There are available now two free parts of the TPA User Guide for our customers. The first "The Basics"
Matreshka
Dimitr Trifonov
5 (2)
Matreshka self-testing and self-optimizing indicator: 1. Is an interpretation of the Elliott Wave Analysis Theory. 2. Based on the principle of the indicator type ZigZag, and the waves are based on the principle of interpretation of the theory of DeMark. 3. Filters waves in length and height. 4. Draws up to six levels of ZigZag at the same time, tracking waves of different orders. 5. Marks Pulsed and Recoil Waves. 6. Draws arrows to open positions 7. Draws three channels. 8. Notes support and re
Cyclic Impulse MT5 — Este indicador técnico estrutura gráficos e identifica movimentos cíclicos de preços. Permite encontrar reversões em movimentos cíclicos de preços e sinais de entrada. Como funciona o indicador Quando é detetado um movimento cíclico de baixa, é gerada uma barra azul descendente após o fecho do candle. Pode piscar no candle atual, indicando que o sinal ainda não foi confirmado. As setas azuis estão duplicadas no gráfico de preços. Quando é detetado um movimento cíclico de a
O indicador destaca as zonas onde há declaração de interesse no mercado e, em seguida, mostra a zona de acumulação de ordens . Ele funciona como um livro de ofertas em escala ampliada . Este é o indicador para o dinheiro grande . Seu desempenho é excepcional. Qualquer interesse que existir no mercado, você verá com clareza . (Esta é uma versão totalmente reescrita e automatizada — não é mais necessário fazer análise manual .) A Velocidade de Transação é um indicador de conceito novo que mostra o
TrendMaestro5
Stefano Frisetti
note: this indicator is for METATRADER4, if you want the version for METATRADER5 this is the link:  https://www.mql5.com/it/market/product/108106 TRENDMAESTRO ver 2.5 TRENDMAESTRO recognizes a new TREND from the start, he never makes mistakes. The certainty of identifying a new TREND is priceless. DESCRIPTION TRENDMAESTRO identifies a new TREND in the bud, this indicator examines the volatility, volumes and momentum to identify the moment in which there is an explosion of one or more of these da
Weis Wave with Alert MT5
Trade The Volume Waves Single Member P.C.
4.94 (17)
Rental/Lifetime Package Options and Privileges  Rent Monthly Six Months   Yearly/Lifetime Weis Wave with Speed with Alert+Speed Index x x x Manual  x x x Quick Set up Video x x x Blog x x x Lifetime Updates x x x Setup and Training Material x x Discord Access Channel "The SI traders"          x Rectangle Break Alert Tool      x How to trade with it:    http://www.tradethevolumewaves.com   ** If you purchase please contact me to setup your  : Training Room and  complete manual access.  Wei
1. Tool Description The   Dynamic Liquidity HeatMap Profile   is an advanced technical indicator originally designed by BigBeluga (Pine Script) and ported to MQL5. Unlike a standard Volume Profile which shows where volume   has   occurred, this tool attempts to visualize where liquidity (limit orders and stop losses) is   likely waiting   (resting liquidity). It works by identifying pivots (local highs and lows) weighted by volume and ATR.   Crucially, if price moves through a level, that liquid
MetaForecast M5
Vahidreza Heidar Gholami
5 (3)
MetaForecast prevê e visualiza o futuro de qualquer mercado com base nas harmonias nos dados de preços. Embora o mercado nem sempre seja previsível, se houver um padrão nos preços, o MetaForecast pode prever o futuro com a maior precisão possível. Em comparação com outros produtos similares, o MetaForecast pode gerar resultados mais precisos ao analisar as tendências do mercado. Parâmetros de entrada Past size (Tamanho do passado) Especifica o número de barras que o MetaForecast usa para criar
Rtc ML Ai Predictor
Muhammad Faisal Sagala
Rtc ML Ai | Predictor CORE MACHINE LEARNING ENGINE Adaptive ML Market Predictor – Multi-Bar Trend & Candle Forecast What This Indicator Does This indicator is a  real-time market prediction engine  designed to analyze price behavior and estimate  future market tendencies . Unlike conventional indicators, this system  does not rely on static parameters or historical curve-fitting , but adapts its internal state dynamically during live market operation. Instead of using static rules, the indic
Jita Indicator Pro MT5 | All Timeframes Professional Trend Agreement System – Premium Edition ($500) What Is Jita Indicator Pro? Jita Indicator Pro is a structured trend-confirmation system designed for serious traders who value precision, alignment, and controlled signal behavior. It combines: Advanced band-based trend direction logic ATR-driven structural trigger engine Dual-confirmation agreement system Locked history update design This indicator prints signals only when multiple conditions
Elliott Wave Trend was designed for the scientific wave counting. This tool focuses to get rid of the vagueness of the classic Elliott Wave Counting using the guideline from the template and pattern approach. In doing so, firstly Elliott Wave Trend offers the template for your wave counting. Secondly, it offers Wave Structural Score to assist to identify accurate wave formation. It offers both impulse wave Structural Score and corrective wave Structure Score. Structural Score is the rating to sh
Claro, aqui está a tradução para o português: Apresentando o Indicador de Astronomia para   MT4 / MT5 : Seu Companheiro Celestial Definitivo no Trading Você está pronto para elevar sua experiência de trading a alturas celestiais? Não procure mais do que o nosso revolucionário Indicador de Astronomia para MT4. Essa ferramenta inovadora transcende os indicadores de trading tradicionais, aproveitando o poder de algoritmos complexos para fornecer insights astronômicos incomparáveis e cálculos de pre
Moon Cycle
Navdeep Singh Kaur
Indicador técnico que utiliza o algoritmo astronômico de Jean Meeus para exibir fases lunares em gráficos de trading. Apresenta linha curva contínua representando o ciclo lunar com precisão científica equivalente a observatórios profissionais. Compatível com qualquer símbolo e timeframe no MT5, incluindo forex, commodities, índices e ações. Inclui painel informativo mostrando fase lunar atual, percentual de iluminação e níveis de referência para análise técnica. Configurações de cor e estilo co
The AX Forex Indicator MT5 is a sophisticated trading tool designed to provide traders with a comprehensive analysis of multiple currency pairs. This   powerful indicator   simplifies the complex nature of the forex market, making it accessible for both novice and experienced traders. AX Forex Indicator uses   advanced algorithms   to detect trends, patterns and is an essential tool for traders aiming to enhance their forex trading performance. With its robust features, ease of use, and reliabl
DESCRIÇÃO ICSM (Impulse-Correction SCOB Mapper) é o indicador que analisa o movimento do preço e identifica impulsos válidos, correções e SCOBs (Single Candle Order Block). É uma ferramenta poderosa que pode ser usada com qualquer tipo de análise técnica porque é flexível, informativa, fácil de usar e melhora substancialmente a consciência do trader sobre as zonas de interesse mais líquidas. CONFIGURAÇÕES Geral | Visuais Tema de cor — define o tema de cor do ICSM. SCOB | Visuais Mostrar S
Pointer Trend Switch — precision trend reversal indicator Pointer Trend Switch is a high-precision arrow indicator designed to detect key moments of trend reversal based on asymmetric price behavior within a selected range of bars. It identifies localized price impulses by analyzing how far price deviates from the opening level, helping traders find accurate entry points before a trend visibly shifts. This indicator is ideal for scalping, intraday strategies, and swing trading, and performs equa
Overview TriParity AfterShock PRO Scanner é um indicador de painel discricionário para MetaTrader 5. Nesta descrição, uma tríade significa a relação entre três pares de moedas ou instrumentos. O Scanner analisa várias tríades e timeframes em um único painel e ajuda o trader a organizar uma watchlist de forma mais estruturada. Seu objetivo é reduzir a sobrecarga de gráficos, comparar candidatos lado a lado e destacar condições que mereçam uma análise mais detalhada. Este produto não executa arbit
Prices move for many reasons and these can vary from one operator to another: software, private and institutional traders simultaneously contribute to the formation of the price, making predictive art very difficult. However, there are measurable factors that bind the price to an underlying trend in line with the physical reality that the financial asset represents: these are the macroeconomic indicators. Large investors use this information wisely to set their strategies. Understanding these m
Mais do autor
Candel color NASDAQ
Benyamin Naser Mokhtari Karchegani
Advancing in NASDAQ 100 Trading with the Smart "Candle Color" Indicator The indicator we offer is one of the good tools for trading in the NASDAQ 100 market, especially in the 1-minute and 5-minute timeframes. This indicator is designed with precision and scientific rigor and can also be used in other timeframes. All you need to do is activate it and leverage its power. Unique Features: Optimized Performance in 1-Minute and 5-Minute Timeframes: This indicator is specifically designed for these
Magic Moving AI
Benyamin Naser Mokhtari Karchegani
Magic Moving AI The Magic Moving AI indicator is one of the best tools for trading in the NASDAQ 100 market. This tool is specifically designed for the 1-minute and 5-minute timeframes and operates with high precision. You can easily activate this indicator and benefit from its advantages. Unique Features: Specialized Performance in 1-Minute and 5-Minute Timeframes: While this indicator is capable of working in other timeframes, its primary focus is on these two timeframes to deliver optimal re
Magic Nasdaq AI
Benyamin Naser Mokhtari Karchegani
Descubra Oportunidades Avançadas de Trading no Mercado NASDAQ 100 com o NASDAQ Smart Indicator O NASDAQ Smart Indicator é uma das ferramentas mais poderosas e eficazes para operar no mercado NASDAQ 100. Este indicador foi especificamente projetado para os intervalos de 1 minuto e 5 minutos, operando com alta precisão e eficiência. Você pode ativá-lo facilmente e usufruir de suas vantagens. Características principais : Desempenho Ótimo em Intervalos de 1 Minuto e 5 Minutos : Este indicador foi de
Magic SL AI
Benyamin Naser Mokhtari Karchegani
The indicator now available to you is one of the best tools for trading in the NASDAQ 100 market, particularly in the 1-minute and 5-minute timeframes. This tool is designed with precision and can also be used for other timeframes. All you need to do is activate it. Key Features: Specialized Performance in 1-Minute and 5-Minute Timeframes: While this indicator can work in other timeframes, it delivers optimal results in these two timeframes. Compatibility with the NASDAQ 100 Secret Strategy: Th
Super Magic Moving Pro
Benyamin Naser Mokhtari Karchegani
*Apresentando o Indicador Dourado para o NASDAQ 100!* Você está em busca de uma ferramenta poderosa para aumentar seu sucesso nas negociações no NASDAQ 100? Não procure mais! Nosso indicador exclusivo foi desenvolvido meticulosamente após dois anos de extensa pesquisa e análise dos movimentos do NASDAQ 100. Este avançado indicador de média móvel utiliza princípios da razão áurea, níveis de Fibonacci e ângulos de Gann para identificar os pontos de cruzamento mais precisos entre o preço e as mé
Magic sl NASDAQ 100
Benyamin Naser Mokhtari Karchegani
The indicator now at your disposal is undoubtedly one of the best tools for trading in the NASDAQ 100 market, especially in the 1-minute and 5-minute timeframes. This indicator is meticulously designed for high precision and can be adjusted for other timeframes as well. Simply run it and receive good exit signals. Key Features: Specialized performance in the 1-minute and 5-minute timeframes: While this indicator works in other timeframes as well, its primary focus is on these two timeframes. Co
Filtro:
Sem comentários
Responder ao comentário