Conheça o Mercado MQL5 no YouTube, assista aos vídeos tutoriais
Como comprar um robô de negociação ou indicador?
Execute seu EA na
hospedagem virtual
hospedagem virtual
Teste indicadores/robôs de negociação antes de comprá-los
Quer ganhar dinheiro no Mercado?
Como apresentar um produto para o consumidor final?
Expert Advisors e Indicadores para MetaTrader 5 - 49

Utazima Universal AI – Institutional Smart Money Dashboard (FREE) Product Overview Utazima Universal AI is a professional manual trading indicator designed to help traders identify institutional price behavior with clarity and precision. The indicator combines Smart Money Concepts (SMC) , AI-based market filtering , and time-based session logic (Silver Bullet) into a single, clean non-repainting dashboard for MetaTrader 5. This tool is suitable for traders who want structure, confirmation,
FREE

Adiciona marca d'água com nome do ativo em negociação. Pode ser ajustado definindo tamanho da fonte e coloração do texto. Testado com vários ativos do mercado B3 e Forex Adione ao gráfico e configure de acordo com a necessidade. Caso tenha problemas sinta-se a-vontade para nos avisar e providenciaremos a correção logo que possível. ______________________________
FREE

Hull Suite by Riz | MT5 Indicator Overview: Hull Suite is a premium trend-following indicator that combines three powerful Hull Moving Average variations (HMA, EHMA, THMA) into one versatile tool. Designed for traders who demand clarity and precision, this indicator helps identify trend direction with minimal lag while filtering out market noise. Key Features: Three Hull Variations – Switch between HMA (classic), EHMA (exponential smoothing), and THMA (triple weighted) to match your trading styl
FREE

TimeToClose The "TimeToClose" indicator is an essential tool for traders who need to monitor the remaining time before a candle closes. This indicator displays the remaining time directly on the BID line, providing a clear and precise reference during real-time trading. Key Features: Displays the remaining time for the current candle to close. Direct integration on the BID line for better visualization. Simple and user-friendly configuration. Ideal for all types of traders, from beginners to pro
FREE
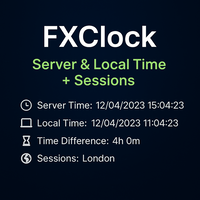
FXClock – Professional Clock Indicator for Traders Important Reminder:
If you find this tool helpful, please support the work by leaving a comment or rating.
Your feedback motivates further development!
The FXClock indicator is a practical and simple tool that displays time directly on your trading platform, allowing you to track multiple key pieces of information at the same time. It is specially designed to help traders synchronize their trading with market hours and global sessions. Key F
FREE

FiboEvo WIN: Estratégia Híbrida Fibo & Grid Adaptativo Descrição Curta Expert Advisor "Graybox" especializado em Mini Índice (WIN). Combina entradas técnicas por Fibonacci, Filtros de Fluxo (VWAP/ADX) e um sistema de Grid Adaptativo por ATR para recuperação de posições. Visão Geral (Overview) O FiboEvo WIN foi projetado para a realidade do mercado brasileiro (B3). Ele opera rompimentos e retrações de níveis de Fibonacci a favor da tendência. Seu grande diferencial é o sistema Auto-Adaptativo (AT
FREE
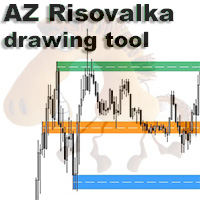
AZ Risovalka levels drawing tool An indicator for simplifying the drawing of levels. Select the indicator mode for the body, shadow, or the whole candle in the settings. Click the 'Draw' button on the drawing panel to create a level, then click on the body or shadow of the candle and select the level color in the color menu that appears. The 'Delete' button to delete level you select, 'Color' to select the color of an already created level. You can set your own colors in the indicator menu (6 co
FREE

I think you all know Donchian Channels. so I am not going to write about it.
With this indicator I tried to create Donchian Trend Ribbon by using Donchian Channels.
How it works ?
- it calculates main trend direction by using the length that is user-defined. so you can change it as you wish
- then it calculates trend direction for each 9 lower lengths. if you set the length = 20 then the lengths are 19, 18,...11
- and it checks if the trend directions that came from lower lengths is same
FREE

Like most things that work in trading, it's really simple. However, it's one of the most powerful tools I have that makes entries of many systems much more precise.
In its essence, it measures the recent volatility against the medium-term average. How does it work? Markets tend to be prone to strong trending movements when relative volatility is low and tend to be mean-reverting when relative volatility is high.
It can be used with both mean-reversion systems (like the Golden Pickaxe) and mo
FREE

Zenith Session Flux is a professional-grade technical indicator for MetaTrader 5 designed to identify and visualize institutional trading windows known as ICT Killzones. The indicator automates the process of time-alignment by synchronizing your broker's server time with New York local time, ensuring that session boxes and price pivots appear at the precise institutional moments regardless of your broker's timezone. Indicator Features: Automatic Timezone Sync: Automatically calculates the offset
FREE

Indicador TK - Rainbow Descrição: O indicador TK - Rainbow é uma ferramenta robusta para análise técnica, projetada para fornecer uma visão clara das tendências de mercado por meio de uma abordagem com várias linhas. Com 30 linhas calculadas em diferentes períodos, oferece uma análise extensa dos movimentos de preços. O indicador utiliza um esquema de duas cores para destacar tendências de alta e baixa, facilitando a interpretação das condições do mercado de relance. Principais Características:
FREE

Traders Toolbox Premium é uma ferramenta multifuncional Características: 19 Sinais individuais - Cada um desses sinais é polarizado em uma configuração de estilo de rede neural para constituir o resultado final / geral. Cada sinal tem suas próprias configurações que podem ser personalizadas ou otimizadas, se necessário. Comprehensive On Tela Tela - Seis tirar Painéis de distância com informações e ferramentas abrangentes dicas. (clique na borda do painel para desdobrá-la
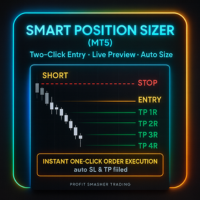
Smart Position Sizer (MT5) Two clicks to map risk, auto-size, and execute with SL/TP prefilled—fast, visual, broker-aware.
Built to work beautifully across Forex, Futures, Indices, Metals, and CFD symbols . Why traders love it (by market) Forex Spread-aware sizing (optional): include current spread in risk so your lot size targets net risk. Pip & 5-digit precision: correct pip math on majors/minors; handles mini/micro volume steps automatically. Side-price logic: uses bid/ask correctly for SL/T
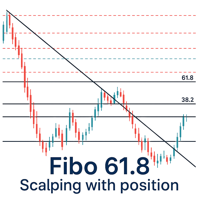
Este Expert Advisor (EA) foi desenvolvido para negociação automatizada nos pares XAUUSD (Ouro) e BTCUSD (Bitcoin) .
Ele combina níveis de retração de Fibonacci com a Teoria das Ondas de Elliott para identificar oportunidades de negociação com alta probabilidade de sucesso. Obter o arquivo de configuração Entre em contato comigo para receber o arquivo .set ,
ou faça o download na seção de comentários.
Clique aqui para obter o arquivo de configuração para Ouro (XAUUSD) .
Clique aqui para obter o a

O indicador exibe níveis técnicos importantes no gráfico. Esses níveis atuam como suporte ou resistência para o movimento dos preços.
Os níveis mais importantes são múltiplos de 100 e 50 pontos. Você também pode exibir níveis em múltiplos de 25 pontos.
Quando o preço atinge o nível, um alerta ou notificação por push é exibido.
Versão para MT4 https://www.mql5.com/pt/market/product/69486 Configurações Show Levels 100 pips - mostra os níveis em múltiplos de 100 pips Show Levels 50 pips - mostr
FREE
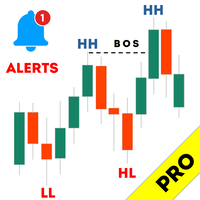
Haven Market Structure PRO - Seu Analista de Mercado Profissional Apresentando Haven Market Structure PRO – este não é apenas um indicador, mas um sistema completo para automatizar a análise do movimento de preços, baseado nos conceitos-chave de Price Action e Smart Money. Esta versão PRO foi criada para traders que desejam ter o máximo controle sobre o gráfico и ver uma imagem completa do mercado. Outros produtos -> AQUI Entender a estrutura do mercado é a base para um trading lucrativo. O

GOLD ESCAVATOR TRADING BOT
NB: PLEASE NOTE THAT THIS PROJECT WAS TAKEN DOWN A YEAR AGO DUE TO THE FEAR THAT IT MIGHT BE OVERFITTED. I WILL WORK ON IT TO RESTORE. MEANWHILE USE THE US30 TRADE BOT OR ACCOUNT FLIPPER BOTS WHICH ARE ALL FREE IN 2025. THANK YOU
A trading bot for XAUUSD. Lotsize is calculated by multiplying the lot factor by each 100 USD on account. You can adjust your risk level from 1 to 4 to suit your needs; Advisable to use account sizes of USD 200 and above. Account types: H
FREE

Versão gratuita da estratégia grid! Estratégia idêntica à versão completa, a única limitação é o número de posições. Seu objetivo é colher a maior parte das tendências de mercado (em modo automático) aproveitando correções em tendências. Ela também pode ser usada por profissionais experientes em negociação manual. Este tipo de sistema está sendo usado por traders sociais mais bem sucedidos que têm mais de 500 assinantes pagos. Combine a sua experiência de negociação com esta estratégia automátic
FREE

Alpha Prime Gold: Quantitative XAUUSD System
Built on 15 years of statistical market analysis, this system prioritizes trade quality over volume. It operates using two non-correlated strategies: Weekly Seasonality: Capitalizes on institutional rebalancing patterns, typically buying Thursday dips to sell into Friday rallies. Volatility Breakout: Utilizes the ID/NR4 pattern to detect price compression and catch major trend explosions . Risk Management & Specs
We deliberately avoided risky recovery
FREE

Trading information panel with risk calculator, order management, fractal trend indicator, and customizable keyboard shortcuts for quick trading. Features: Real-time trading information display (spread, ATR, swap, price levels, etc.) Integrated risk calculator with three modes (lot size, money risk, point distance) Quick order management with keyboard shortcuts (buy, sell, close, half close) Multi-timeframe fractal trend indicator (shows price position relative to fractal high/low) Adjustable pa
FREE

Volume at Price (VAP) VAP is a right-anchored Volume Profile Heatmap for MetaTrader 5 designed for clean, fast, and stable execution on any chart. It shows where trading activity clustered, not just when—so you can read balance/imbalance, spot value migration, and plan trades with precise references: VAH, VAL, and POC . What VAP shows Heatmap Profile (tick-volume):
A compact, right-anchored histogram that scales with the chart. Value Area (~70%) in Gold Non-Value in White Soft shadow gradient

Bohemia Gold Outside Inside Bar MT5 is an automated trading system for MetaTrader 5 based on pure price action logic combined with trend and momentum filters . The EA is designed to trade trend continuation setups after short consolidations or periods of increased market volatility. Recommendation EA works well in a trend For Gold (XAUUSD) M30 timeframe Choose RiskPercent (0.1% step) or FixedLot MM setting Keep default settings (not necesarry SET file) Safety Features EA always use SL and TP
FREE
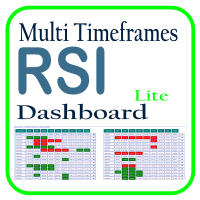
Optimize your trading analysis with the RSI Multitimeframe Dashboard, a powerful tool designed to streamline RSI monitoring across all timeframes and symbols listed in your Market Watch. This dashboard delivers real-time insights and alerts, making it essential for traders who rely on RSI to identify potential market entries and exits. Key features include: Comprehensive RSI Overview : Instantly view RSI values for every timeframe across all Market Watch symbols, making multi-timeframe analysis
FREE

Trade Copy é uma ferramenta em forma de EA que replica as operações feitas em um Meta Trader 5 para todos os meta Traders 5 abertos no mesmo computador. É útil se você deseja operar mais de uma conta sua ou se deseja trabalhar com gerenciamento de contas de terceiros. Versão Demo: https://www.mql5.com/pt/market/product/40906 Versão para M T4: https://www.mql5.com/pt/market/product/40902 Configuração: MAIN OPTIONS Idiom - alterna entre Português e Inglês. Copy trades from - especifica se de tod
Range Identifier v3 User Guide 1. Overview The Range Identifier v3 is a technical analysis tool designed to automatically detect and visualize periods of market consolidation, commonly known as ranges. this MQL5 version brings the same powerful logic to the MetaTrader 5 platform. The primary function of this indicator is to draw a channel around recent highs and lows during periods of low volatility. When the price breaks out of this channel, the indicator provides an alert, helping traders iden
FREE

Swift Close Utility for closing Buy and Sell positions in MetaTrader 5. Purpose
This utility is designed for batch closing of Buy or Sell positions on the current symbol. Operating Modes Close BUY — Close all open Buy positions on the current symbol. Close SELL — Close all open Sell positions on the current symbol. Magic Number Filtering
The MagicNumber parameter allows the utility to target only positions opened by an Expert Advisor with the specified magic number. If MagicNumber =
FREE

Mozu is a scalping EA designed specifically for XAUUSD. While the EA itself references the 15-minute timeframe, it will execute trades in the same manner regardless of which timeframe is displayed on the chart. It performs scalping by following the trend, entering on dips or selling on rallies. It is similar to my other EA, Atori, but Mozu has been optimized over a longer period of time. A broker with narrow spreads is recommended. Please try it first on a demo account or with small lot sizes. N

Konoha is a simple breakout EA for XAUUSD. When you specify an arbitrary number of candlesticks, it places pending stop orders at the highest high and lowest low from the current bar (the bar at which the order is placed) back to the specified number of candlesticks. The default parameter is set to 180, which means stop orders will be placed at the highest high and lowest low from the current bar back 180 candlesticks. Note : Backtest results do not necessarily guarantee future performance.
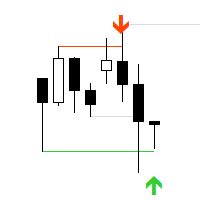
"AV Stop Hunter MT5" is an indicator for MetaTrader 5, which draws entry arrows for long and short after so-called Stop Hunt candles and has several notifications about them. Since this is a smart money concept , the periods H1 and H4 are the best. Increasing volume improves the signal, lines and arrows are then thicker. The MQL5 variant has colored stop-hunting candles. NEW: Signal Buffer: 1, 0 or -1
Definition :
Stop hunting, also known as stop running, is the practice of institutional trad

Advanced Basket EA MT5 - Professional Portfolio Management System
Next-Generation Account-Level Basket Management for MetaTrader 5 The Advanced Basket EA MT5 is a cutting-edge portfolio management system that treats your entire account as one intelligent basket. Real-World Use Cases I don't Case 1 : Multi-EA Portfolio Management Scenario: Running 5 different EAs across 10 pairs Monitor combined P/L across all strategies Set daily profit target: $1000 → day ends when reached Daily loss limit: $4

Are you looking for a signal indicator that actually works? Meet Phoenix Quantum Signals , the professional Price Action tool designed for traders who demand precision, not guesswork.
Unlike traditional indicators that "repaint" (change their past signals to look good), Phoenix Quantum uses a proprietary "Smart Swing Breakout" logic. It identifies confirmed Market Structure points and only generates a signal when a true breakout occurs.
Why Phoenix Quantum? The #1 problem with arrow indicator
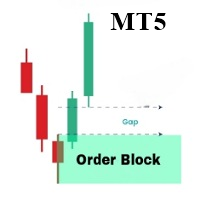
OrderBlock Analyzer é um indicador personalizado para MetaTrader 5 (MT5) projetado para detectar e destacar Blocos de Ordens (Order Blocks) nos gráficos de preços. Este indicador auxilia os traders na identificação de estruturas-chave do mercado, sinalizando possíveis áreas de reversão ou continuação. Baseado no comportamento do mercado, o OrderBlock Analyzer desenha automaticamente os blocos de ordens e distingue blocos de alta e baixa com cores diferentes. Principais características: Detecção

Greetings to all Forex trading enthusiasts! Today I want to share the story of how our unique trading advisor was created, which combined two time-tested strategies – Sniper and Spider. This project was the result of many years of experience and close cooperation with a talented programmer. The idea was born from the desire to create something truly effective and universal. We took our favorite strategies as a basis and decided to combine them in one trading advisor. The task was not an easy on

Ping: Sua ferramenta indispensável para uma negociação confiável Seu provedor de internet e seu VPS prometem uma conexão estável, mas você pode realmente confiar neles? Em um mundo onde cada milissegundo conta, uma conexão lenta ou instável pode resultar em lucros perdidos ou prejuízos. O script Ping permite que você: Tome decisões informadas: Compare visualmente a velocidade de diferentes servidores VPS e corretoras para escolher a conexão mais rápida e confiável para sua estratégia de negociaç

TransitX1 indicator is very useful, with unlimited signals and works on all the timeframes and all the piers. TransitX1 draws two trend lines very short trendlines (+/-20 bars) which can be considered as support and resistance. The support is in red trendline and the resistance is in green trendline. TransitX1 gives buying and selling signals, with only 3 being previous signals and the 4th one being the current signal. Buying signals are in green arrows and are always on the support trendline an
FREE

Royal Wave is a Trend-Power oscillator which has been programmed to locate and signal low-risk entry and exit zones. Its core algorithm statistically analyzes the market and generates trading signals for overbought, oversold and low volatile areas. By using a well-designed alerting system, this indicator makes it easier to make proper decisions regarding where to enter and where to exit trades. Features Trend-Power Algorithm Low risk Entry Zones and Exit Zones Predictions for Overbought and Over

Gold Quantum is a fully automated Expert Advisor designed specifically for XAUUSD (Gold) breakout strategies . This EA identifies strong market momentum and executes high-probability trades at key support and resistance levels using pending orders for optimal precision and execution.
Gold Quantum is built for traders who value speed, strategy flexibility, and reliable risk control. Depending on your settings, it adapts to scalping and swing trading techniques , and it includes multiple trail

This Expert Advisor is a simple educational strategy designed to demonstrate the basics of using SMA and the Martingale system. It is suitable for trading on any asset, helping users understand basic risk management and trading principles. Working Principle: The strategy is based on the price's movement relative to the Simple Moving Average (SMA). The Martingale system increases the trade size after a loss. Parameters: MaxConsecutiveLosses : Maximum number of consecutive losses before resetting
FREE

Pivot Points Classic – L’indicatore essenziale per ogni trader tecnico Questo indicatore disegna automaticamente i livelli di Pivot Point più utilizzati dai trader professionisti, con supporto completo a 4 metodi di calcolo: Metodi supportati :
• Traditional
• Fibonacci
• Woodie
• Camarilla Caratteristiche principali :
Calcolo su timeframe superiore (multi-timeframe)
Visualizzazione chiara dei livelli P, R1, R2, R3, S1, S2, S3
Etichette dinamiche con nome e valore del livello
Colori per
FREE
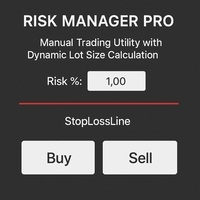
Risk Manager PRO – Manual Trading Utility with Dynamic Lot Size Calculation
Risk Manager PRO is a powerful yet simple utility for manual traders. It allows you to enter trades with calculated lot sizes based on your specified risk percentage and a visual stop-loss line. Just drag the red stop line to your desired level, input the risk %, and click Buy or Sell. Ideal for traders who want precise risk control without complex calculations.
Features:
Dynamic lot size calculation
Visual stop-lo
FREE
Você está cansado da lentidão e da falta de controle da boleta padrão do MetaTrader 5? A negociação discricionária exige velocidade, precisão e, acima de tudo, informação clara. Clicar em vários menus, arrastar stops um por um e não ter uma visão consolidada do seu risco são barreiras que custam tempo e, principalmente, dinheiro. O trading profissional exige ferramentas profissionais. O Trader Panel Alpha X Pro é a solução definitiva. Ele não é apenas uma "boleta", é uma estação de comando de tr
FREE

O News Filter Protector foi projetado para protegê-lo de posições/pedidos abertos em anúncios de notícias. No mundo de hoje, onde as notícias podem causar volatilidade imprevisível e perdas prolongadas, essa ferramenta é muito útil para sua tranquilidade, já que você não precisa verificar o calendário nunca mais!
Vamos examinar as entradas do EA para entender como funciona cada parâmetro: --------------------------------Configurações de notícias---------------- ---------------- Moedas das

Price Sessions is an exclusive MetaTrader 5 indicator that integrates symbol information and trading sessions into your chart. It does not link to any account information or external sources, ensuring user safety. Main Features: 1. Symbol Information Current Symbol Live Price Live Spread 2. Trading Sessions (Time zone UTC/GMT+0) Tokyo session London session New York session If you find this utility helpful, please rate it. If you encounter any issues or have suggestions, pleas
FREE

If you like this free tool, check out my EA which is currently on a Launch Sale for only $39 ! Title: [Overview] Universal Smart Monitor Pro: Automated Fibonacci & Price Action System Say goodbye to manual charting! Universal Smart Monitor Pro is a professional-grade technical analysis system that combines Fibonacci Retracements with Price Action logic. With a fully upgraded core, this algorithm is now universally compatible across all markets. It automatically adapts to the volatility characte
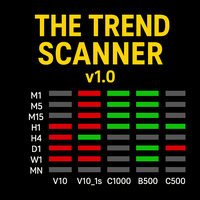
The Trend Scanner – Multi-Timeframe & Multi-Asset Analyzer Discover market direction at a glance!
The Trend Scanner is a powerful tool designed for Boom & Crash, Volatility Indices, Jump Indices, and even Forex (EURUSD) , allowing traders to instantly spot bullish or bearish trends across multiple assets and timeframes in a single, easy-to-read window. Key Features: Monitors trends from M1 up to Monthly . Covers a wide range of assets:
Boom & Crash Indices
Volatility Indices
Jump Indice

True Days is a tool designed specifically for the trader who wants to catch intraday volatility in price charts. True day makes it easier for the trader to avoid trading in the dead zone - a period in time where markets are considered dead or non volatile. The trader can concentrate on finding opportunities only during periods of profound market movements. By default the indicator gives you a true day starting at 02:00 to 19:00 hours GMT+2. You can adjust according to your Time Zone. By deafult
FREE

Gold Sniper EA is an automated Expert Advisor built for XAUUSD scalping under breakout conditions . It relies purely on price action logic and session filters , avoiding indicators for faster, cleaner execution. Less Executions but more sniper entries. The EA places pending orders only when momentum and swing zone criteria align, ensuring structured and disciplined trade entries. With dynamic trade management, flexible exits, and customizable risk, Gold Sniper EA is designed to deliver professi

Gold Trump EA – The Ultimate Grid Trading Powerhouse Dominate the Markets with a Smart, Adaptive, and Highly Customizable EA! Join Our Telegram Group! First, enter the group Join Here
Then, access the main section Go Here In this channel, you can chat with other traders and download the full PDF guide with all the details about this EA. Join now and stay updated Hey everyone! I'm working on a new version of Cristoforo Gold , and it’s almost ready for release! For the first 10 customers ,

Sytem pro neural V3 - The Ultimate Multi-Strategy Trading System
The most advanced and refined version of the DAVITO series, representing years of development and optimization. This is THE version you need to try.
WHY V3 IS THE BEST VERSION YET
- Triple Strategy System: Grid Trading + Breakout Detection + Hybrid Trailing - Integrated MQL5 Economic Calendar: Automatically filters high-impact news events to protect your strategy from volatile spikes during announcements (NFP, FOMC, CP
FREE

HEDGING ACCOUNTS ONLY!!! DO NOT USE DEFAULT SETTINGS!! Multifarious is a multiple strategy trading robot. With 9 indicators, 82 possible trading strategies your possibilities are endless. You can use the following indicators individually or use them together to. Bollinger Bands Moving averages Stochastics RSI Momentum indicator Fibonacci Levels MACD indicator ADX Indicator Fractals Indicator The EA also has a highly configurable money management section to ensure low risk trading. Extra Featu
FREE
Simple Strategy Grid Pro is a trading advisor combining four indicators (RSI, Stochastic, MACD, ADX) into a grid-based strategy. Suitable for both novice and experienced traders due to its flexible settings and automation. Strategy The advisor enters trades on signal changes from FALSE to TRUE, using RSI > 50, Stochastic > 50, MACD above signal line, and ADX > 25 for long positions (opposite for shorts). Take Profit is calculated from VWAP, with grid steps adjusted via ATR. Key Features Combin
FREE

Unlock Enhanced Stability and Superior Returns with Our Latest Expert Advisor
Hello! We're a dedicated team of experienced traders and developers with over a decade of combined expertise in the forex markets. Building on our success and continuous market analysis, we've significantly enhanced our trading algorithm to deliver even more stable and profitable performance. Introducing Nexus MultiCurrency EA v3.0—our most advanced iteration designed to maximize your trading potential while maintainin

Product Description Clean, Smart Sessions is a professional trading sessions indicator designed to provide traders with a clear, accurate, and clutter-free view of the active market sessions directly on the chart. The indicator dynamically detects and displays the active trading session (Asian, London, and New York) in real time, drawing a clean session box that continuously updates to reflect the session’s true high and low. When sessions overlap, each active session is handled independently
FREE

This indicator scans for you up to 15 trading instruments and up to 21 time frames for occurrences of the high probability reversal patterns: Double Tops/Bottoms with fake breakouts . What this indicator detects: This indicator detects a special form of Double Tops and Bottoms, so called Double Tops/Bottoms with fake breakouts . For double tops with fake breakouts the highest price of the right shoulder must be higher than the left shoulder. For double bottoms with fake breakouts the lowest pric

Position Size Companion – Interactive Risk & Lot Calculator for MT5
Position Size Companion is a professional, chart-based position sizing tool designed for traders who demand precision, speed, and visual clarity when managing risk. It is fully suitable for both Forex markets and synthetic instruments such as Volatility indices (e.g., V75), and similar symbols.
With this tool, traders can bid farewell to constantly using external or built-in GUIs that require manual input of entry and stop-l
FREE

Highly configurable Moving average indicator.
Features: Highly customizable alert functions (at levels, crosses, direction changes via email, push, sound, popup) Multi timeframe ability Color customization (at levels, crosses, direction changes) Linear interpolation option Works on strategy tester in multi timeframe mode (at weekend without ticks also) Parameters:
MA Timeframe: You can set the lower/higher timeframes for Ma. MA Bar Shift: Y ou can set the offset of the line drawing. MA Period,
FREE
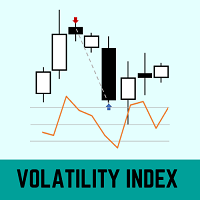
Esse indicador utiliza a volatilidade histórica e uma média móvel de 21 períodos para definir a distorção do preço em relação a média. O cálculo da volatilidade histórica foi baseado no livro (Odds: The Key to 90% Winners) escrito por Don Fishback. O Volatility Index com valor superior a 30 pode indicar que o preço está distorcido em relação ao seu preço justo.
DÚVIDAS SOBRE INSTALAÇÃO DE PRODUTOS NO META TRADER Você também pode encontrar algumas instruções sobre como instalar um robô na loja
FREE
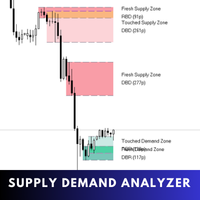
Supply Demand Analyzer is an advanced trading indicator meticulously designed for the precise identification, analysis, and management of supply and demand zones. By integrating real-time data and advanced algorithms, this tool enables traders to recognize market phases, price movements, and structural patterns with unparalleled accuracy. It simplifies complex market dynamics into actionable insights, empowering traders to anticipate market behavior, identify trading opportunities, and make in

(THE GROK AI FILTER ONLY WORKS IN REAL TRADING/DEMO NOT BACKTESTING!) USE DEMO MONEY OR REAL TRADING TO TRY!!) BECAUSE IT NEEDS REAL MARKET PLEASE DM ME TO SEND YOU THE EA TO TEST ON THE DEMO ACCOUNT!
PRICE WILL INCREASE to USD350 ONCE 5 QUOTA FILLED!
Grok AI Pulse PRO is a smart Expert Advisor that combines classic technical analysis (RSI, Moving Average, ATR) with real AI confirmation using Grok (xAI) .
The EA trades only high-quality setups, filters noise with AI confidence scoring, and au

Spline Searcher MT5 — Indicador multimoeda para detecção precoce de splines de preço e pontos de interesse Ferramenta auxiliar para detecção e visualização automáticas das fases iniciais de formações complexas de preço. O indicador é destinado exclusivamente à negociação manual e é adequado para traders que experimentam a detecção precoce de formações ou tendências de mercado mais complexas, das quais formações mais simples podem fazer parte. O indicador identifica até seis tipos de formações i
FREE

Safe Trader Advanced – EA de captura de picos com gestão de risco exclusiva para trading consistente e seguro O Safe Trader combina um algoritmo de detecção de picos com um quadro de gestão de capital, oferecendo precisão e proteção em mercados voláteis. Ele foi projetado especificamente para capturar e negociar picos de mercado com precisão e consistência. Diferente dos robôs comuns que dependem de sinais instáveis ou configurações sobre-otimizadas, o Safe Trader opera com um núcleo único de ge
Introdução Break Asian Range é um bot de trading que automatiza a conhecida estratégia dos “altos e baixos da Ásia”. Ele foi desenvolvido para detectar e operar rompimentos da sessão asiática em ativos como EURUSD, GBPJPY e outros pares voláteis. Combina confirmações técnicas personalizáveis com gestão de risco avançada (SL, TP, trailing stop, risco variável, reentradas...) para se adaptar tanto a estilos conservadores quanto agressivos. Funciona com múltiplos timeframes e reconhece padrões de
FREE
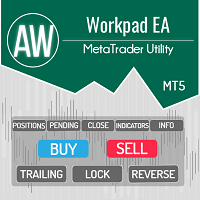
O AW Workpad é um painel de controle de negociação multifuncional projetado para negociação manual e semiautomática. Ele permite gerenciar pedidos pendentes, posições de mercado, fornece uma ampla gama de dados estatísticos, bem como uma análise multiperíodo de um grupo de indicadores clássicos. O utilitário é representado por cinco guias: Positions, Pending, Close, Indicators, Info . Cada guia possui seu próprio grupo de funções para processamento de pedidos ou informações sobre a situação
VWMA Signal Pro – Painel Multitemporal de Tendência Ponderada por Volume VWMA Signal Pro é um indicador analítico que combina a média móvel ponderada por volume (VWMA) com filtros de confirmação de tendência e um painel multitemporal compacto.
Ajuda o trader a identificar a direção da tendência e a força do momento com base em volume e volatilidade. O indicador calcula valores de VWMA em vários períodos e exibe sinais de compra/venda confirmados pelos filtros ADX, ATR e VWAP. Cada sinal é class

Infinite Storm EA is a safe and fully automated expert advisor that analyzes market trend and price movements and thanks to that is able achieve high rate of winning trades. Every order has StopLoss (either real or virtual) and EA has implemented advanced filtering functions together with spread and slippage protections. This EA does NOT use any of the dangerous strategies like Martingale, Grid or Arbitrage. This EA is fully customizable by user. This EA is not limited by trading pair or time

Bias Scanner Pro identifies market direction and trend strength in real time, giving you a clear view of bullish, bearish, or neutral bias. By combining EMA crossovers with ADX trend analysis, it delivers precise market context and actionable insights for traders of any style. How It Works Bias Detection: Fast and slow EMA crossovers identify bullish, bearish, or neutral market direction. Trend Strength Confirmation: ADX measures trend intensity, confirming whether the market is trending, rangin
FREE

Ultimate Candle Countdown – Nunca mais perca o fechamento de uma vela! Leve a sua precisão no trading para o próximo nível com o Ultimate Candle Countdown – o temporizador de contagem regressiva para velas, limpo, leve e poderoso, projetado para todos os timeframes e todos os símbolos.
Seja fazendo scalping no M1, swing trade no H1 ou acompanhando fechamentos diários/semanais, esta ferramenta garante que você sempre saiba exatamente quanto tempo resta antes da próxima vela abrir. Chega de a
FREE
SPECIAL INTRODUCTORY PRICE!! Bollinger Reversal Pro (MT5) is a professional, fully-customisable Expert Advisor that targets reversal setups at the outer Bollinger Bands , filtered by RSI and ADX to avoid weak, choppy signals. It’s simple to run in the MetaTrader 5 Strategy Tester, so you can backtest, optimise, and find parameters that suit any symbol and timeframe. Packed with features ATR-based SL & TP – Adapts to volatility; no more one-size-fits-all levels. Currency or % risk – Set a fixed c
Moving averages are very often used for analyzing currency pairs and trading. This Expert Advisor can analyze many moving averages at once and trade based on this. When the required number of moving averages signal a purchase, the adviser makes a purchase, if the indicators signal a sale, the advisor sells. Also, there is filtering spurious signals at low volatility based on the ADX indicator. In the settings of the adviser, you can set the required number of sliding ones, their period (the init
RSI + Grid Distance Strategy with 200 EMA Filter Overview The RSI + Grid Distance Strategy integrates momentum and mean-reversion principles within a structured grid trading framework. By combining the Relative Strength Index (RSI) with dynamic grid levels and a 200-period Exponential Moving Average (EMA) filter, the system seeks to optimize trade timing, trend alignment, and overall position efficiency. Core Logic 1. RSI Signal Generation
The algorithm utilizes a 17-period RSI , identifying b
O mercado MetaTrader é um espaço, sem precedentes, para negociar robôs e indicadores técnicos.
Leia o artigo Manual do usuário da MQL5.community para saber mais sobre os serviços exclusivos que oferecemos aos traders: cópia de sinais de negociação, aplicativos personalizados desenvolvidos por freelances, pagamentos automáticos através de sistema de pagamento e a rede em nuvem MQL5.
Você está perdendo oportunidades de negociação:
- Aplicativos de negociação gratuitos
- 8 000+ sinais para cópia
- Notícias econômicas para análise dos mercados financeiros
Registro
Login
Se você não tem uma conta, por favor registre-se
Para login e uso do site MQL5.com, você deve ativar o uso de cookies.
Ative esta opção no seu navegador, caso contrário você não poderá fazer login.