 MetaTrader 5
 Experts
 Indicadores
 Bibliotecas
 Utilitários
 Widgets
 Regras
Conheça o Mercado MQL5 no YouTube, assista aos vídeos tutoriais
Como comprar um robô de negociação ou indicador?
Execute seu EA na
hospedagem virtual
hospedagem virtual
Teste indicadores/robôs de negociação antes de comprá-los
Quer ganhar dinheiro no Mercado?
Como apresentar um produto para o consumidor final?
Novos Indicadores Técnicos para MetaTrader 4 - 2
 É com base nos sinais de indicadores técnicos listados abaixo que você pode aplicar as decisões para abertura ou fechamento de uma transação na plataforma MetaTrader 4.
O funcionamento dos indicadores reside na previsão de mudanças de preço, com base na conversão matemática de preço e/ou volumes de um instrumento financeiro.

Push Scalping - Indicator for MetaTrader 4 Push is an indicator that helps identify BUY/SELL signals on MetaTrader 4, combining reversal conditions with the Push signal set. The signal only appears when the system confirms a closed candle and is displayed directly on the price chart. Use the One Click Trading MT4 to trade more effectively. The panel is draggable and automatically switches between light and dark modes based on the chart background. It features auto-scaling text within buttons,

Pattern Oracle is an all-in-one chart pattern engine for MetaTrader. It scans three zigzag levels at once, finds more than 30 harmonic, chart, continuation and reversal patterns, scores every setup and draws a complete trade plan with entry, stop-loss and two take-profit levels. A built-in teaching mode explains every pattern right on the chart. Pivots are only used once they are confirmed and every decision is made on a closed bar, so signals do not repaint . Patterns detected Reversal : Double

Quantum Edge is a machine-learning trend and signal indicator for MetaTrader. It combines a Lorentzian-distance k-nearest-neighbours classifier, a rational-quadratic kernel regression cloud and a multi-timeframe trend filter into one clean chart tool, then turns the result into clear, tiered BUY and SELL setups with ready-made stop-loss and three take-profit levels. Every signal is calculated on closed bars only . Once a label appears on the chart it stays exactly where it is: no repainting, no

QCL Structure Trail for MetaTrader 4 QCL Structure Trail combines confirmed market structure breaks with a volatility-based trailing line. It helps traders identify directional changes and follow price movements through a clear display directly on the chart. How It Works The indicator identifies confirmed swing highs and swing lows using the selected Pivot Confirmation Length. A bullish signal appears when the closing price crosses above the latest confirmed swing high. A bearish signal appears
FREE

Box Volume Profile Box Volume Profile draws a volume histogram inside any rectangle you place on the chart. Choose a time window and a price range, and the indicator shows how much volume was traded at each price level inside that zone. It also plots the Point of Control (POC) and the Value Area boundaries (VAH and VAL). How to use Press the draw hotkey (the letter V by default) and drag a rectangle anywhere on the chart. The volume profile appears immediately inside the box. Move or resize the

GP Confluence Scanner MT4 Advanced Multi-Timeframe Market Structure & Confluence Analysis Don't get stopped out easily again! GP Confluence Scanner MT4 is an advanced technical analysis indicator developed for MetaTrader 4, designed to reveal important market levels, hidden support and resistance, and multiple technical confluences before entering a setup. Rather than relying on a single indicator, GP Confluence Scanner combines multiple analytical techniques to identify areas where significant

A Chart-style Long/Short Position tool for MT4. Drag entry, take profit and stop loss directly on the chart, see the risk/reward ratio and the lot size calculated from your risk % instantly. Green TP zone, red SL zone, clean English labels, and a round on-chart button to show or hide the tool. Purely visual - it never opens, modifies or closes orders. Plan trades on MetaTrader 4 visually, directly on the chart. Place the box, drag the levels, and read the price, RR and position size at a glance.

Mega MNFM Mega MNFM is a MetaTrader 4 dashboard that brings completed-bar technical readings, a seven-timeframe trend map, market-session clocks and loaded account-history statistics into one panel. Technical dashboard Ten readings: RSI, MACD histogram, Stochastic, EMA trend, ADX, Bollinger Bands, a local technical Fear & Greed proxy, an indicative synthetic dollar basket, ATR rank and OBV flow. Multi-timeframe map covering M1, M5, M15, M30, H1, H4 and D1. Directional summary, trend strength, li

Fast VWAP (Highly Optimized Intraday Dashboard)
The Fast VWAP Matrix is an institutional-grade technical overlay designed to isolate volume-weighted fair value and intraday structural balance across active execution cycles. By processing price action dynamically through volume-weighting thresholds, this utility completely eliminates calculation delay and gives traders an instant visual panel of asset distribution on a single window.
Utilizing specialized single-pass memory arrays, this matrix
FREE

MTF DeMarker Exhaustion Matrix (Free Advanced Exhaustion Dashboard)
The Multi-Timeframe DeMarker Exhaustion Matrix is an institutional-grade technical scanner designed to isolate subtle price exhaustion zones and impending market reversals across multiple execution cycles simultaneously. By monitoring the M15, H1, H4, and D1 intervals concurrently[cite: 4], this utility completely eliminates multi-chart cluttering and gives traders an instant executive matrix of trend exhaustion and structural
FREE

Master Trading Matrix (Free Advanced Multi-Indicator Dashboard)
The Master Trading Matrix is an institutional-grade technical convergence scanner designed to combine 10 foundational momentum, trend, and exhaustion engines into a single, unified execution display. By integrating RSI, Stochastic, CCI, Williams %R, DeMarker, Momentum, RVI, Chande Momentum, Rate of Change, and Ultimate Oscillator into an executive matrix, this utility eliminates multi-window clutter and provides a complete, real-ti
FREE

MTF Momentum Oscillator Matrix (Free Advanced Velocity Dashboard)
The Multi-Timeframe Momentum Oscillator Matrix is an institutional-grade technical scanner designed to map out the velocity of price change across clean rolling history blocks simultaneously. By monitoring the M15, H1, H4, and D1 intervals concurrently, this utility completely eliminates multi-chart cluttering and gives traders an instant executive matrix of trend speed and directional acceleration on a single window.
Instead of
FREE

MTF Rate of Change (ROC) Matrix (Free Advanced Price Velocity Dashboard)
The Multi-Timeframe Rate of Change (ROC) Matrix is an institutional-grade technical scanner designed to evaluate pure historical price velocity across 4 distinct execution timeframes simultaneously. By monitoring the M15, H1, H4, and D1 intervals concurrently[cite: 18], this utility completely eliminates multi-chart cluttering and gives traders an instant executive matrix of momentum acceleration and structural trend force
FREE

MTF Ultimate Oscillator Matrix (Free Advanced Multi-Timeframe Dashboard)
The Multi-Timeframe Ultimate Oscillator Matrix is an institutional-grade technical scanner designed to evaluate momentum convergence across three distinct lookback horizons on four execution timeframes simultaneously. By monitoring the M15, H1, H4, and D1 intervals concurrently, this utility completely eliminates multi-chart cluttering and gives traders an instant executive matrix of weighted momentum expansion and overbou
FREE

MTF Chande Momentum Matrix (Free Advanced Momentum Dashboard)
The Multi-Timeframe Chande Momentum Matrix is an institutional-grade technical scanner designed to isolate raw market momentum and structural exhaustion across multiple execution cycles simultaneously. By monitoring the M15, H1, H4, and D1 intervals concurrently, this utility completely eliminates multi-chart cluttering and gives traders an instant executive matrix of trend structural health on a single window.
Unlike common smoothe
FREE

MTF Relative Strength Index (RSI) Matrix (Free Advanced Momentum Dashboard)
The Multi-Timeframe Relative Strength Index (RSI) Matrix is an institutional-grade technical scanner designed to evaluate momentum and overbought/oversold conditions across 4 distinct execution timeframes simultaneously[cite: 5, 6]. By monitoring the M15, H1, H4, and D1 intervals concurrently[cite: 5, 6], this utility completely eliminates multi-chart cluttering and gives traders an instant executive matrix of momentum
FREE

MTF Williams %R Matrix (Free Advanced Multi-Timeframe Dashboard)
The Multi-Timeframe Williams %R Matrix is an institutional-grade technical scanner designed to evaluate momentum extremes and key boundary dynamics across four execution timeframes simultaneously[cite: 5, 6]. By monitoring the M15, H1, H4, and D1 intervals concurrently, this utility completely eliminates multi-chart cluttering and gives traders an instant executive matrix of price relative to recent high-low ranges on a single win
FREE

MTF Relative Vigor Index (RVI) Matrix (Free Advanced Trend Health Dashboard)
The Multi-Timeframe Relative Vigor Index (RVI) Matrix is an institutional-grade technical scanner designed to evaluate directional trend vigor and conviction across 4 distinct execution timeframes simultaneously[cite: 10, 11]. By monitoring the M15, H1, H4, and D1 intervals concurrently[cite: 10, 11], this utility completely eliminates multi-chart cluttering and gives traders an instant executive matrix of trend health
FREE

MTF Stochastic Matrix (Free Advanced Momentum Crossover Dashboard)
The Multi-Timeframe Stochastic Matrix is an institutional-grade technical scanner designed to evaluate momentum cycles, %K/%D line crossovers, and extreme overbought/oversold boundaries across 4 distinct execution timeframes simultaneously[cite: 14, 15]. By monitoring the M15, H1, H4, and D1 intervals concurrently[cite: 14, 15], this utility completely eliminates multi-chart cluttering and gives traders an instant executive matr
FREE

MTF Commodity Channel Index (CCI) Matrix (Free Advanced Trend Scanner Dashboard)
The Multi-Timeframe Commodity Channel Index (CCI) Matrix is an institutional-grade technical scanner designed to evaluate cyclical trend momentum and structural threshold breakouts across 4 distinct execution timeframes simultaneously[cite: 18, 19]. By monitoring the M15, H1, H4, and D1 intervals concurrently[cite: 18, 19], this utility completely eliminates multi-chart cluttering and gives traders an instant execu
FREE

Volatility Dots puts a trailing line of dots on your chart. In an uptrend the dots sit under the price, in a downtrend above it, and they flip when price closes through the opposite band. It works on any symbol and any timeframe. It reads only the prices your terminal already has, does not use any server, does not send anything out, and does not open or change orders. What It Shows One dot per bar. White dots under the candles mark a rising trend, red dots above the candles mark a falling trend.

Daily Range Ladder draws six horizontal levels across the current trading day. The distances come from how far the symbol usually travels in a day, so the levels adapt to every symbol without any setting. It works on any symbol and any chart timeframe. It reads only the daily bars your terminal already has, does not use any server, does not send anything out, and does not open or change orders. What It Shows Three resistance levels above the day's low and three support levels below the day's hig

TCM ORB Indicator for MetaTrader 4 draws the opening range of the Asia, London and New York sessions and marks breakouts from each range on closed candles. What it shows - A box for each session's opening range (the first 30 minutes by default, adjustable) - Session times adjusted to your broker's clock and daylight saving automatically, or set manually - A breakout arrow when a candle closes outside the range - Optional entry, stop-loss and take-profit lines for each breakout, with an adjustabl

TCM SMC Indicator for MetaTrader 4 marks market structure on your chart: supply and demand zones, breaks of structure, liquidity grabs and fair value gaps. Everything is calculated from closed candles. What it shows - Fresh supply and demand zones, extended to the right until price returns to them, with the option to also show zones that have been revisited - Breaks of structure (BOS), labelled on the chart - Liquidity grabs (LQG), where price runs a recent high or low and turns back - Fair valu

TCM Trend Indicator for MetaTrader 4 highlights trend-following setups on closed candles and shows a suggested entry, stop-loss and take-profit for the latest one. What it shows - An arrow under or over the candle when a bullish or bearish trend setup appears, on closed candles only, so arrows do not repaint - Entry, stop-loss and take-profit lines for the latest setup, with the stop based on market volatility - A title and status line showing the current state Risk : reward Choose 1:1, 1:1.5, 1

MTF Simple Moving Average (Free Institutional Moving Average Overlay)
The Multi-Timeframe Simple Moving Average (MTF SMA) is an institutional-grade technical utility designed to project higher-timeframe trend baselines directly onto your lower-timeframe execution charts. Developed by a C++ systems programmer specializing in high-speed MQL4 architecture, this indicator provides traders with seamless market structure visibility without requiring multiple open windows or manual chart toggling.
FREE

PROMOÇÃO DE NATAL : ALL PRODUCTS por $30 SMC Scanner não é apenas um indicador, mas um sistema abrangente de análise de trading baseado no Smart M0ney Concept (SMC) . Essa metodologia permite que os traders entendam e aproveitem os movimentos de preço de grandes instituições financeiras (Smart M0ney ). Com seus recursos avançados, o SMC Scanner simplifica análises complexas em insights de negociação acionáveis. Por que escolher o SMC Scanner? Entenda o comportamento do mercado: O SMC Scanner

O Pips Stalker é um indicador de seta longa e curta, o indicador ajuda traders de todos os níveis a tomarem melhores decisões ao negociar no mercado, nunca repinta e usa o RSI como lógica principal do sinal; uma vez que uma seta é aplicada, ela nunca repinta ou repinta e as setas não são atrasadas.
RECURSOS DA SETA PIPS STALKER :
PAINEL DE ESTATÍSTICAS Um painel de informações único que mostra a % geral de taxa de vitória e estatísticas úteis como o máximo de vitórias e derrotas em trocas seg

Slayer Binary é um indicador de seta de uma vela com opções binárias. Esse indicador não é para quem busca o santo graal, pois é uma abordagem irrealista para o trading em geral. O indicador apresenta uma taxa de acerto constante e, se usado com gestão de dinheiro e uma meta diária, será ainda mais confiável. O indicador vem com muitos recursos listados abaixo:
RECURSOS SEM REPINTURA: O indicador não repinta suas setas em tempo real;Uma vez que uma seta é dada, ela permanece lá mesmo que o pre

Esse indicador foca em níveis de take profit e stoploss; a ideia é escalpar o mercado em períodos de tempo mais altos/baixos começando pelo M1 e em períodos mais altos como H1 ou M15, pois esses períodos não são muito afetados pelo spread e pela comissão do corretor; o indicador dá sinais de compra/venda baseados na estratégia de divergência de preço, onde traça uma seta de compra com níveis de tp/sl quando as condições de divergência de alta são totalmente atendidas. O mesmo vale para as setas

**Price Power — Força de compra e venda pela posição do preço**
O Price Power mede num relance quanto espaço o preço tem acima e abaixo do nível atual. Ele conta quantas das últimas velas estão acima do preço atual (força de compra) e quantas abaixo (força de venda), e mostra ambos como números e como linhas no gráfico.
Quando há muito mais velas acima do que abaixo, há mais espaço e pressão para baixo; quando há muito mais abaixo, o viés é de alta. O painel dá os dois valores e uma leitura c

Break and Retest Hunter MT4 is a powerful MetaTrader 5 indicator designed to automatically identify support and resistance levels, breakout structures, and potential retest opportunities in real time. Bonus Indicator: After purchasing Break and Retest Hunter , contact me to receive Trade Indicator Assistant EA completely free as a bonus utility.
$65 for the next 10 copies . Next price is $120. Combining adaptive market analysis, clear BUY/SELL signals, Fibonacci-based profit targets, and a pre

Currency Pulse — painel de força das moedas para MetaTrader 4 Para que serve O Currency Pulse mostra, num único painel compacto no gráfico, quais moedas estão fortes e quais estão fracas neste momento, em vários tempos gráficos ao mesmo tempo. Com base nesse ranking, o indicador aponta os pares com a maior divergência entre moedas: comprar a forte e vender a fraca. O indicador não depende do símbolo do gráfico em que é colocado. MT5 -version: https://www.mql5.com/en/market/product/200977
Como

Pare de adivinhar o lote. O TravaRisco Lot Calculator mostra, diretamente no gráfico, o lote exato para o risco que escolher. Como funciona: Escreve o risco em % e o stop loss em pontos no painel. O indicador calcula na hora: Valor em risco (na moeda da conta) Perda por 1 lote com esse stop loss Lote exato, arredondado ao passo da sua corretora Risco real depois do arredondamento Funciona em forex, ouro, índices e cripto, usando os valores de tick da sua própria corretora. O painel pode ser em p
FREE

Channel Pro MT4 Identify high-probability reversal zones with a single glance. Channel Pro MT4 combines a dynamic volatility channel with a color-coded momentum trend line to help traders spot potential price reversals before they develop. When price briefly breaks outside the channel and snaps back, the indicator marks the event with a clear arrow signal directly on the chart — no separate window needed. Key Features Non-repainting — all signals are confirmed on the closed bar only Upper and lo

SAYON Performance PRO MT4 é um painel profissional de estatísticas para MetaTrader 4.
Uma só janela, tudo sobre a sua conta: 8 indicadores-chave, gráfico de saldo e equity, drawdown real sobre a equity, calendário de lucros, horas, dias, long contra short, símbolos e estatísticas avançadas. Exporte o relatório completo para o Excel com um clique. Preço de lançamento – o preço vai subir em breve. É um indicador: funciona em qualquer gráfico, ao lado de qualquer Expert Advisor. Não opera e não alt

Elliott Live é um indicador para MetaTrader 5 que marca automaticamente as ondas de Elliott, tanto no histórico quanto na vela atual. As ondas concluídas são desenhadas com linha contínua; a onda em formação, com linha pontilhada e um ponto de interrogação (por exemplo, "3?"), junto com os alvos de Fibonacci e o nível de invalidação. MT5-version: https://www.mql5.com/en/market/product/200604
Como funciona Primeiro o indicador constrói os swings (ZigZag). Uma reversão é registrada quando o preç

Adaptive Volume Profile desenha o Perfil de Volume das últimas barras diretamente no gráfico: o Point of Control (POC), a Value Area (VAH / VAL), os nós de volume alto (HVN), os nós de volume baixo (LVN) e um histograma de volume opcional. O tamanho das linhas de preço adapta-se à volatilidade atual (ATR), por isso o perfil permanece legível em qualquer símbolo e período. Recursos POC - o nível de preço com o maior volume negociado na janela Value Area (VAH / VAL) - a faixa de preço que contém a
FREE

BoS and CHoCH Market Structure marca a estrutura do mercado diretamente no gráfico: máximas e mínimas de swing, Break of Structure (BoS) e Change of Character (CHoCH). Um swing é confirmado quando é a máxima ou a mínima do número de barras escolhido de cada lado. Quando uma vela FECHA além do último swing, o indicador desenha uma linha do swing até a vela que o rompe e a rotula: BoS se o rompimento vai na direção da tendência atual, CHoCH se vai contra ela. Funções BoS (Break of Structure) - um
FREE

Fair Value Gap Fill Tracker encontra Fair Value Gaps (FVG, também chamados de desequilíbrios) e os desenha no gráfico como zonas coloridas. Um Fair Value Gap é um padrão de três velas em que os pavios da primeira e da terceira vela não se sobrepõem, de modo que a vela do meio deixa uma área do gráfico que o preço percorreu muito rapidamente. O indicador marca essa área, estende-a para a direita e acompanha o que o preço faz com ela: a zona permanece aberta até o preço preenchê-la. Recursos Gaps
FREE

Gotobi Day and Tokyo Fixing Marker MT4 é um indicador gratuito que marca no seu gráfico do MetaTrader 4 os dias gotobi japoneses, o horário do fixing de Tóquio e os feriados bancários do Japão, e mostra os próximos dias gotobi em um pequeno painel. Os dias gotobi são os dias 5, 10, 15, 20 e 25 de cada mês e o último dia do mês. Quando um desses dias cai em fim de semana ou em feriado bancário japonês, ele passa para o dia útil anterior em Tóquio. Muitas empresas japonesas liquidam pagamentos nes
FREE

Pivot Points Classic and Camarilla desenha os níveis de pivô Classic (P, R1-R3, S1-S3) e os níveis Camarilla (H1-H4, L1-L4) diretamente no gráfico. Os níveis são calculados a partir do High, Low e Close do período anterior do timeframe escolhido (D1 por padrão), e cada período é desenhado como uma linha horizontal sobre o período a que se aplica, para que você veja como o preço reagiu aos níveis em dias, semanas ou meses anteriores. Funções Pivôs Classic - o pivô central P com três níveis de res
FREE
Multi Timeframe Average True Range mostra a volatilidade (ATR) de QUALQUER período gráfico no gráfico em que você trabalha, por exemplo o ATR de M15 ou H1 em um gráfico M1. Defina stops, alvos e filtros pela volatilidade do período em que você realmente opera. Recursos Volatilidade de um período selecionado em qualquer gráfico (de M1 a MN1) ATR padrão ou NATR (ATR aparado): os maiores True Range (ou ambos os extremos) são descartados antes da média, para que uma única vela de notícia não infle o
FREE

Retest Pivot Signals é um indicador para o MetaTrader 5 que detecta o rompimento de um nível de pivô importante e só emite o sinal depois que esse nível é retestado, ou seja, quando o preço volta à linha rompida e reage a partir dela. Isso filtra parte dos falsos rompimentos: o sinal vem após a confirmação do nível, e não no momento do rompimento. MT5-version: https://www.mql5.com/en/market/product/200224
Como funciona O indicador procura máximas e mínimas de pivô. Um pivô é confirmado quando

Indicador Forex "CCI para 8 Símbolos" para MT4, sem repintura. - O CCI é um dos osciladores mais populares para negociação. - O Commodity_Channel_Index (CCI) mede a diferença entre o preço atual e a média histórica. - Níveis importantes: +/-200. - É ótimo para entradas de Venda acima da zona de +200 e entradas de Compra abaixo de -200. - O "CCI para 8 Símbolos" oferece a oportunidade de controlar os valores de CCI de até 8 símbolos diferentes em apenas um gráfico. - Este indicador também é exce

Indicador Crypto_Forex "Micro M and Micro W patterns Pro" para MT4, sem repintura, sem atraso. - O indicador "Micro M and Micro W patterns Pro" é um indicador muito poderoso para negociação de Price Action. - O indicador detecta os padrões Micro M e Micro W no gráfico: - Micro W de alta - Sinal de seta azul no gráfico (veja as imagens). - Micro M de baixa - Sinal de seta vermelha no gráfico (veja as imagens). - Com alertas integrados para PC e dispositivos móveis. - O indicador "Micro M and Mic

ApexConverge é um indicador para MetaTrader 5 que detecta automaticamente padrões de triângulo (ascendente, descendente e simétrico), desenha seus limites com uma área sombreada e marca com uma seta o candle de rompimento. MT5-version: https://www.mql5.com/en/market/product/200424
Como funciona O indicador encontra topos e fundos de oscilação, traça duas linhas de tendência por eles e valida o formato: topo plano com fundo ascendente é um triângulo ascendente; topo descendente com fundo plano,

Indicador Crypto_Forex de Aceleração da Média Móvel para MT4, sem repintura (no-repaint). O MA Acceleration é um indicador de *scalping*, projetado como ferramenta auxiliar para o indicador "MA Speed". O cálculo deste indicador baseia-se em equações da física. Ele mostra a aceleração da linha da média móvel. Existem muitas oportunidades para aprimorar até mesmo estratégias padrão utilizando o MA Acceleration. Ele pode ser usado com SMA, EMA e LWMA. O MA Acceleration representa a segunda derivad
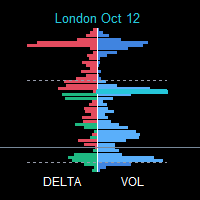
SessionFlowMap — Perfil multissessão de volume e delta com níveis POC O SessionFlowMap constrói um perfil de volume e um perfil de delta (desequilíbrio entre compras e vendas) para as sessões do dia no forex: Ásia, Londres, Nova York e, opcionalmente, Sydney e uma sessão personalizada. Para cada sessão, encontra o POC (Point of Control: o preço com maior volume negociado) e a Value Area (VAH e VAL: a faixa que concentra a maior parte do volume), e projeta esses níveis para a frente como linhas h

MQLTeam Currency Power coloca duas moedas num gráfico e mostra qual é mais forte. Cada moeda tem o seu cesto de pares. As colunas na janela do indicador são a diferença entre os dois cestos, e a tabela mostra o par que produz essa diferença. O exemplo pronto é o euro contra o dólar. Se mudar os dois nomes e as listas de pares, a forma de ler continua a mesma para quaisquer duas moedas. Também disponível: MQLTeam Currency Power para o MetaTrader 5 O valor está em pips. A medida padrão é a distânc

O ValueOrbit mostra onde está o preço «justo» do período atual e quanto o mercado se afastou dele. É uma ferramenta de contexto: desenha uma linha central Value Core com três pares de órbitas (±1σ, ±2σ, ±3σ) ao redor, e o painel indica o quanto o preço está esticado. Não gera sinais de entrada. MT5-version: https://www.mql5.com/en/market/product/201292
Como funciona O Value Core é um nível de referência que se forma desde o início de cada período (sessão, semana ou mês) e recomeça quando um no

AI ZONE RADAR — Suporte e resistência em zonas de preço Escolha a versão para sua plataforma Esta é a edição MT4. A edição MT5 também está disponível. Ver a versão MT5 MT4 e MT5 são produtos separados no Market. A compra inclui apenas a plataforma escolhida. Veja onde o preço está antes de decidir Surge um sinal de compra, mas há uma resistência logo acima? Você observa um recuo, mas onde está o suporte próximo? Acrescentar linhas nem sempre esclarece essas questões. AI ZONE RADAR reúne áreas pr

Indicador Crypto_Forex HTF DeMarker para MT4. - Este indicador é uma ferramenta útil utilizada pelos traders técnicos para encontrar pontos de entrada e saída. HTF significa - Prazo Superior. - A linha do oscilador DeMarker indica a posição atual do preço em relação aos máximos e mínimos anteriores. - O DeMarker fornece os sinais de divergência regular mais eficientes entre outros osciladores. - Zona OverBought é quando o DeMarker está acima de 0,7 e OverSold - quando está abaixo de 0,3. - O in

Indicador Crypto_Forex "Padrão do Enforcado" para MT4, sem repintura, sem atraso. - O indicador "Padrão do Enforcado" é um indicador muito poderoso para negociação de Price Action. - O indicador detecta padrões de baixa do Enforcado no gráfico: sinal de seta vermelha no gráfico (veja as imagens). - Com alertas para PC, celular e e-mail. - O indicador "Padrão do Enforcado" é excelente para combinar com níveis de suporte/resistência. Click here to see high quality Trading Robots and Indicators! E

Correlation Radar PRO — Painel Multiativo de Correlação para MetaTrader 4 Descrição Curta: Elimine o ruído do mercado e identifique distorções de preço em segundos. O Correlation Radar PRO calcula a correlação histórica, mensal, semanal e atual entre múltiplos ativos e permite sobrepor gráficos diretamente na sua tela sem alterar o símbolo principal. Descrição Completa: Analisar múltiplos ativos alternando gráficos manualmente faz você perder tempo e perder oportunidades. O Correlation Radar PRO

ZZ Impulse helps you see market structure without noise. The indicator builds a ZigZag that separates impulse and correction legs, highlights the last impulse , and draws classic Fibonacci retracement levels (38.2 / 50 / 61.8) plus the Base of that impulse. Optional higher-timeframe candles can be shown on the current chart. What you get ZigZag with Impulse / Correction colouring (or classic mode) Adjustable sensitivity Fib levels on the last impulse: 38.2, 50, 50, 61.8 + Base Higher-timeframe
FREE

The Dow Theory structure of the chart — in one look. DowTheoryVisual labels every swing high and low as HH, HL, LH or LL and draws a zigzag colored by the trend: blue for an uptrend, red for a downtrend, gray for a range. The panel keeps showing the trend of the current chart and of two higher timeframes side by side. Features HH / HL / LH / LL labels: each swing high and low is compared with the previous one. Trend-colored zigzag: up blue, down red, range gray. The color changes on the bar wher

Key levels on nine timeframes, and an alert the moment the price breaks out. Prices that were stopped again and again are levels many traders watch. BreakerDetectPro finds the zones where swing highs and swing lows gather and draws one level above and one below the price for each timeframe you select, from M1 to MN1. Higher-timeframe levels are drawn on the chart you are looking at. Features Automatic key levels: one level above and one below the price, from swing highs and lows that gather in t

ATR Stops is an MT4 indicator that shows the size of market volatility. It helps you decide where to place your stop-loss and take-profit, so you avoid the loss from an oversized stop or the profit drawdown from an oversized target. A very practical indicator. Main features A one-line data panel that tells you the size of the volatility A stop-loss reference line that helps you quickly place your stop A take-profit reference line that helps you quickly place your target Parameters ATRPeriod - AT
FREE

FXB Confluence Engine follows the trend with a range filter and, each time that trend turns on a closed bar, scores how much of the market agrees with the new direction. Momentum and the EMAs, four other timeframes, a higher-timeframe bias, the same filter at two wider settings, volatility, RSI and volume each add points, and a choppy market takes points away. A BUY or SELL prints only when the score reaches your minimum and every filter you have switched on is open. A dashboard on the chart sh

WPR MTF shows Williams Percent Range for the current chart and optional higher or lower timeframes in a single subwindow. Features Up to 8 %R lines at once (Chart, M1–MN) Adjustable period, colours, styles and widths Classic levels at −20 and −80 Optional text panel with latest values (off by default) How to use Attach to any chart. Enable the timeframes you need (e.g. Chart + H1 + H4). Watch overbought / oversold zones together across timeframes. Note
This is an analytical tool, not an auto-tr
FREE

SMC Super position - Smart Money Structure & Liquidity Intelligence Professional multi-module market structure, liquidity and trade-planning indicator for MetaTrader 5, designed to combine structural analysis, liquidity behavior, trend context and confirmed signal logic in one compact workspace. The system includes Smart Money structure tools, an independent Master Signal engine, Confluence setups, Scalping analysis, Queen Trend context, multi-timeframe routing and an integrated Signal History d

TimeZone Clock is a tiny MT4 indicator that answers one question at a glance: what is the broker time converted to my local time? On the chart it looks like this: LOCAL 23:58:43 | SERV 15:58:43 | 10-02 SERV is the terminal server time, LOCAL is your own clock, and the trailing MM-DD is the server date. This little tool is useful when you want to describe trades or choose a time period to trade in terms of your local time. Features Local time, server time, server date Time accurate to the second
FREE

WaveForce Linreg Channel draws a linear regression channel on the last N bars, with deviation bands at ±1σ and ±2σ (TradingView-style layout). Features Center regression line ±1σ solid bands, ±2σ dotted bands Adjustable lookback (20–2000 bars) Adjustable σ multipliers, colours and width Optional ray to the right Optional chart label (off by default) How to use Attach to any chart. Set the number of bars for the channel. Tune ±1σ / ±2σ multipliers if needed. Note
This is an analytical tool, not
FREE

WaveForce PSAR MTF plots Parabolic SAR calculated on a timeframe you choose and maps it onto the chart you are viewing. Features SAR from Chart, M1, M5, M15, M30, H1, H4, D1, W1 or MN1 Adjustable acceleration step and maximum Colour, size and arrow code for dots Two display modes: fill every chart bar (default) show dots only on the open of the SAR timeframe How to use Attach to any chart. Select the SAR timeframe (e.g. H1 on an M15 chart). Fine-tune step / maximum if needed. Note
This is an an
FREE

CrowdTrap MultiAsset Liquidity MT4 CrowdTrap MultiAsset Liquidity is a technical analysis indicator for MetaTrader 4 designed to identify market structure, liquidity levels, liquidity sweeps, price retests, and potential trading scenarios. The indicator combines multi-timeframe market structure analysis with price action and liquidity-based analysis. Main Features Market Structure Analysis Uses H1, H4, and D1 market data to assess directional bias and identify Break of Structure (BOS) and Change

Angora Patterns finds, draws and tracks chart patterns for you. It recognises 23 classic chart patterns, 8 harmonic patterns and 13 candlestick patterns, and gives every pattern a breakout level, a target, an invalidation level, a state and a quality score. Chart patterns: Double Top and Bottom, Triple Top and Bottom, Head and Shoulders, Inverse Head and Shoulders, Rounding Top and Bottom, Ascending, Descending and Symmetrical Triangle, Rising and Falling Wedge, Rectangle, Ascending and Descend

PRL Levels is a MetaTrader 4 indicator that displays structured and evenly spaced psychological price levels directly on the chart. It is designed to make price structure easier to read visually. It does not open, manage or close trades.
The indicator can be used on Forex symbols, indices and CFDs. Distances are entered in conventional pips for Forex and in direct price units for indices and CFDs. The appropriate unit is detected automatically from the symbol specifications provided by the bro

AlphaTrend Pullback Pro MT4 Sinais de pullback com a tendência, filtro de notícias e painel profissional — tudo em um só indicador. O AlphaTrend Pullback Pro transforma a leitura de tendência e correção em sinais visuais claros no gráfico. Ele identifica a direção macro do mercado em um timeframe superior, aguarda o preço retornar à média (pullback), confirma a rejeição com o fechamento a favor da tendência e dispara o gatilho de entrada. Sem repintar barras fechadas, sem ruído, sem complicação.

Enigma Cipher Enigma Cipher is a technical analysis indicator designed to help traders identify potential bullish and bearish market reversals through price pressure, momentum and multiple confirmation conditions. The indicator evaluates the relationship between recent price behaviour and the current signal candle. Additional filters can be enabled to refine the analysis and reduce signals that do not meet the selected conditions. How It Works Enigma Cipher first evaluates market pressure and pr
O Mercado MetaTrader oferece um local conveniente e seguro para comprar aplicativos para a plataforma MetaTrader. Faça download de versões de demonstração gratuitas de Expert Advisors e indicadores a partir do seu terminal para testes no Testador de Estratégia.
Teste os aplicativos em diferentes modos para monitoramento do desempenho e assim fazer um pagamento para o produto que você deseja, usando o sistema de pagamento MQL5.community.

Você está perdendo oportunidades de negociação:
- Aplicativos de negociação gratuitos
- 8 000+ sinais para cópia
- Notícias econômicas para análise dos mercados financeiros
Registro
Login
Você concorda com a política do site e com os termos de uso
Se você não tem uma conta, por favor registre-se