WaveForce Psar Mtf

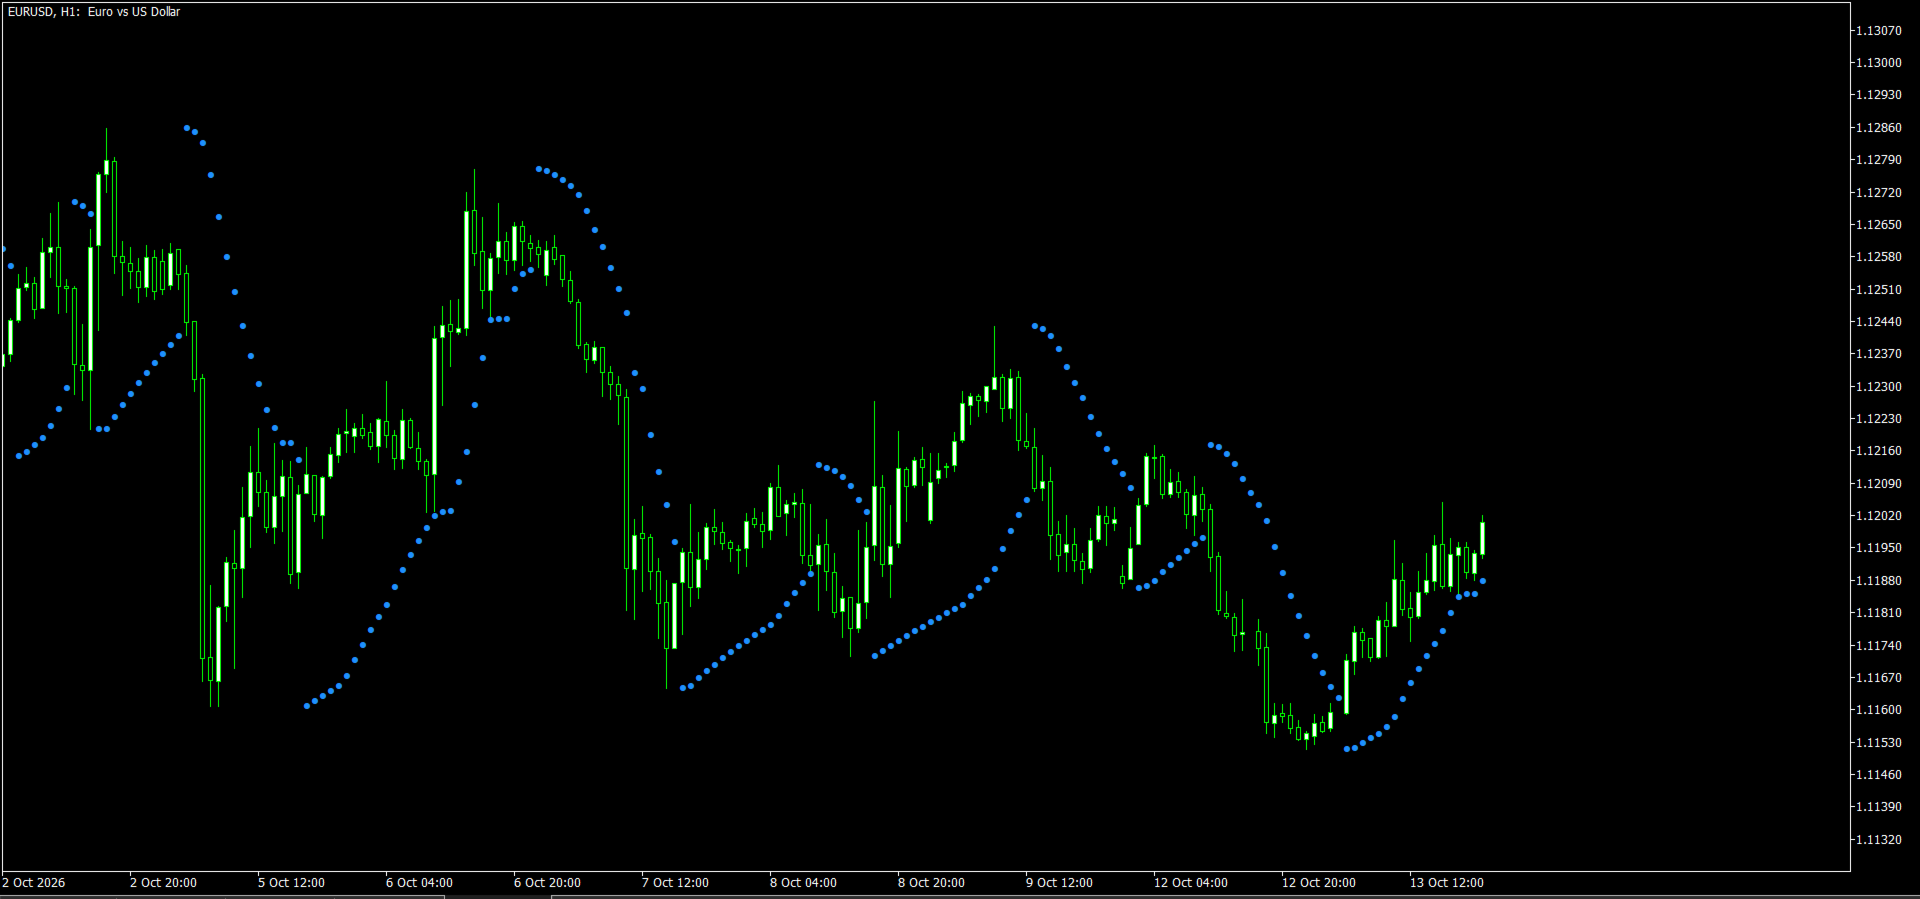
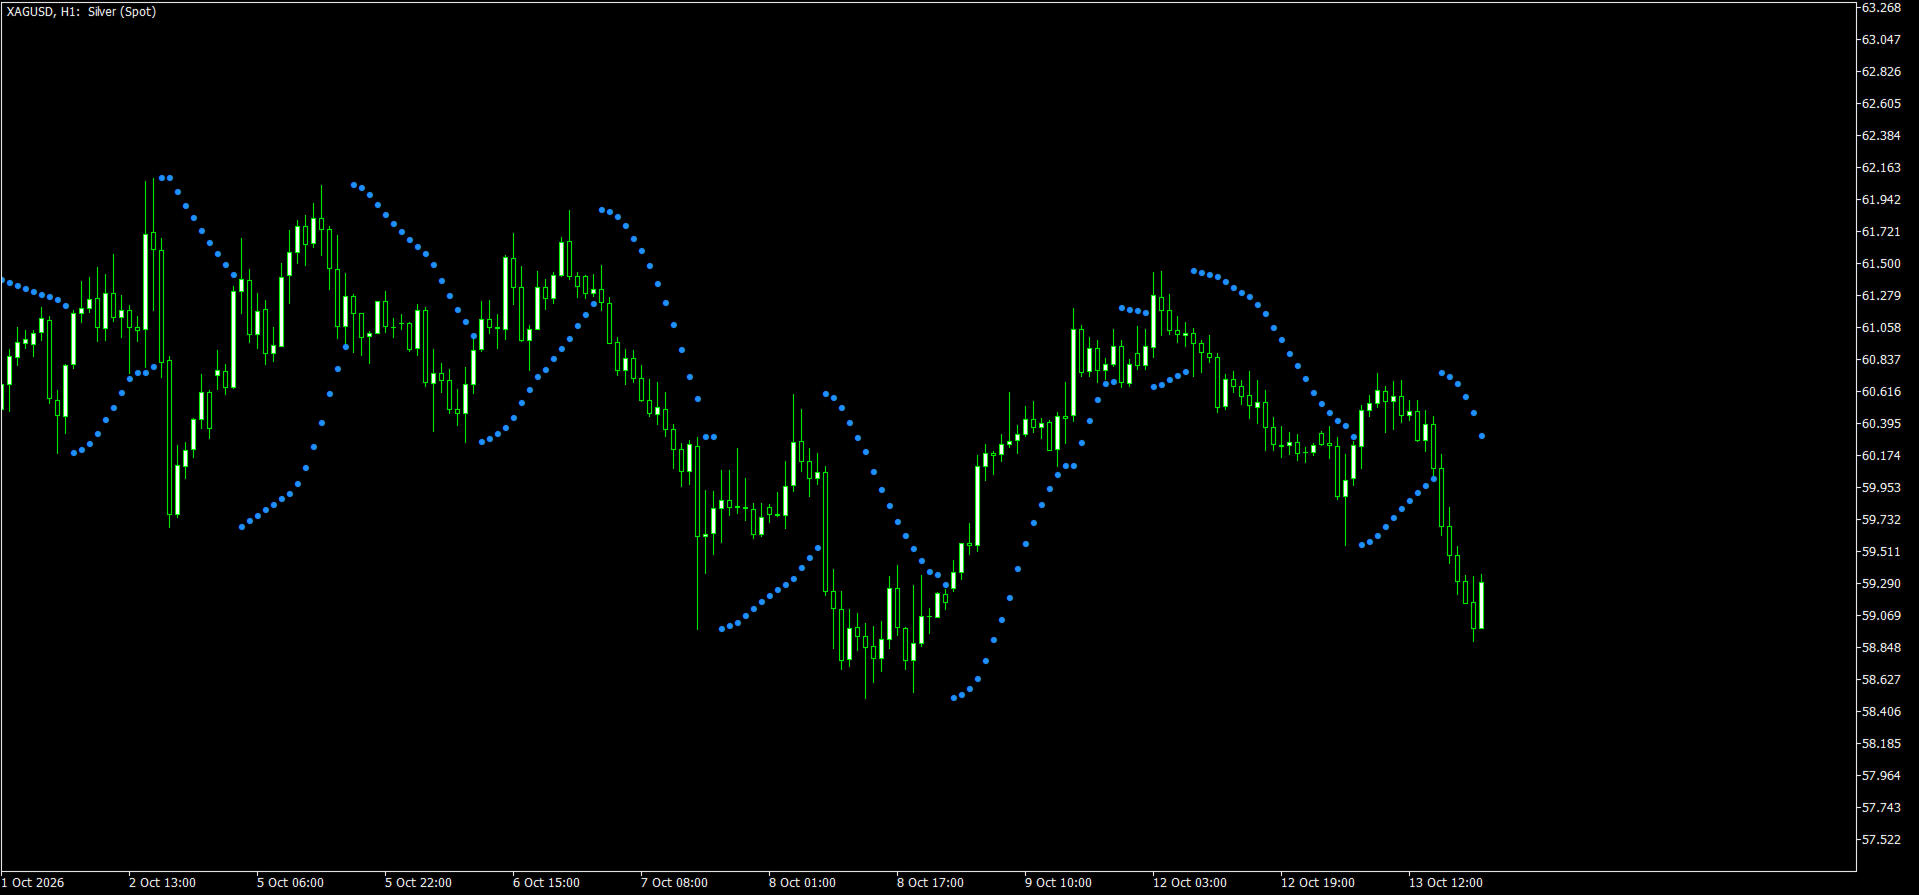
WaveForce PSAR MTF plots Parabolic SAR calculated on a timeframe you choose and maps it onto the chart you are viewing.

Features

  • SAR from Chart, M1, M5, M15, M30, H1, H4, D1, W1 or MN1
  • Adjustable acceleration step and maximum
  • Colour, size and arrow code for dots
  • Two display modes:
    • fill every chart bar (default)
    • show dots only on the open of the SAR timeframe

How to use

  1. Attach to any chart.
  2. Select the SAR timeframe (e.g. H1 on an M15 chart).
  3. Fine-tune step / maximum if needed.

Note
This is an analytical tool, not an auto-trading system and not a signal service. Always use your own risk management.

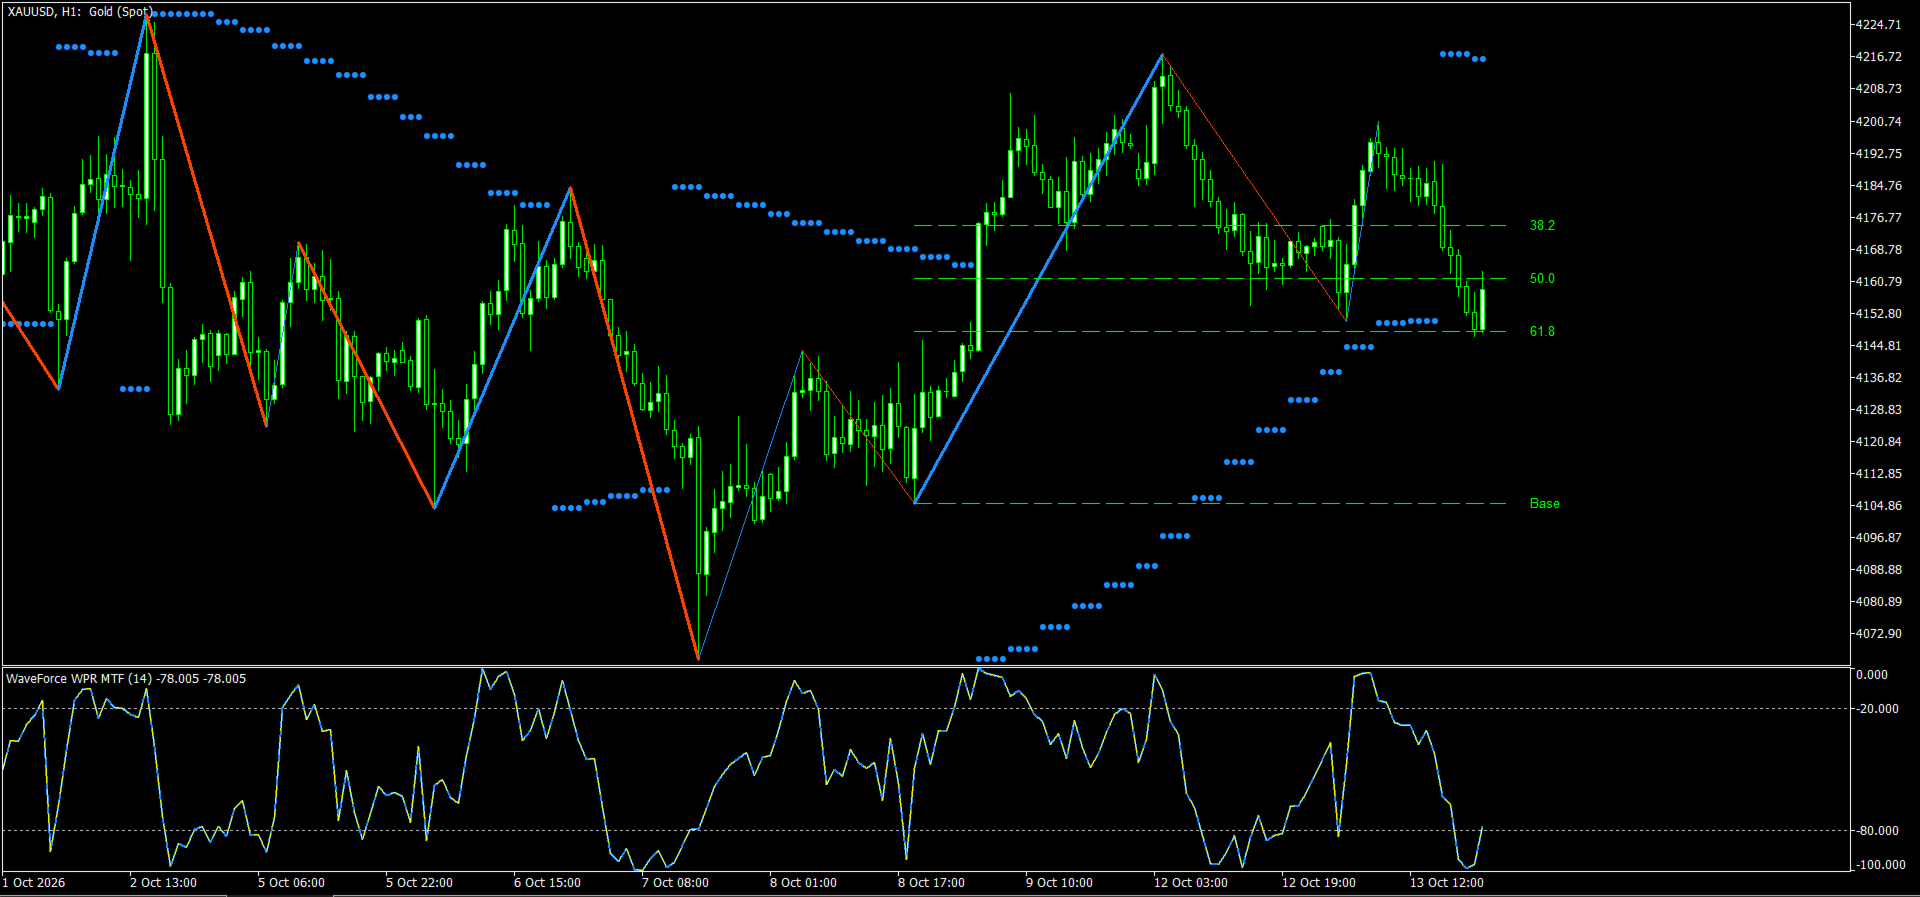
Fits well with other WaveForce tools such as ZZ Impulse Free (structure) and WaveForce WPR MTF (momentum).
Mais do autor
ZZ Impulse mt5  helps you see market structure without noise. The indicator builds a ZigZag that separates impulse and correction legs, highlights the last impulse , and draws classic Fibonacci retracement levels (38.2 / 50 / 61.8) plus the Base of that impulse. Optional higher-timeframe candles can be shown on the current chart. What you get ZigZag with Impulse / Correction colouring (or classic mode) Adjustable sensitivity Fib levels on the last impulse: 38.2, 50, 50, 61.8 + Base Higher-timefr
FREE
ZZ Impulse  helps you see market structure without noise. The indicator builds a ZigZag that separates impulse and correction legs, highlights the last impulse , and draws classic Fibonacci retracement levels (38.2 / 50 / 61.8) plus the Base of that impulse. Optional higher-timeframe candles can be shown on the current chart. What you get ZigZag with Impulse / Correction colouring (or classic mode) Adjustable sensitivity Fib levels on the last impulse: 38.2, 50, 50, 61.8 + Base Higher-timeframe
FREE
WaveForce Structure is a manual market-structure toolkit built around the impulse–correction–impulse logic. Core idea You mark three structure points. The indicator helps you formalize the markup, zones, and working levels. It does not replace your decision with automatic buy/sell calls. Panel features 1-2-3 markup Place structure points, lines, and labels. Suitable for impulse sequences and for reading corrective formations. Zones Zones between key legs of the markup with adjustable fill. Usefu
WaveForce Mark is a panel indicator for manual chart markup and quick access to trading rules inside MetaTrader. Purpose When market structure is already clear, you still need clean lines, labels, and a short checklist of rules. Mark keeps markup tools and text cards in one panel so you do not leave the chart. What you get Markup tab Tools for drawing lines on the chart in a consistent panel style. Cleanup actions help you remove objects and keep the chart readable. Wave logic tab Labels and hel
WPR MTF shows Williams Percent Range for the current chart and optional higher or lower timeframes in a single subwindow. Features Up to 8 %R lines at once (Chart, M1–MN) Adjustable period, colours, styles and widths Classic levels at −20 and −80 Optional text panel with latest values (off by default) How to use Attach to any chart. Enable the timeframes you need (e.g. Chart + H1 + H4). Watch overbought / oversold zones together across timeframes. Note This is an analytical tool, not an auto-tr
FREE
WaveForce Linreg Channel draws a linear regression channel on the last N bars, with deviation bands at ±1σ and ±2σ (TradingView-style layout). Features Center regression line ±1σ solid bands, ±2σ dotted bands Adjustable lookback (20–2000 bars) Adjustable σ multipliers, colours and width Optional ray to the right Optional chart label (off by default) How to use Attach to any chart. Set the number of bars for the channel. Tune ±1σ / ±2σ multipliers if needed. Note This is an analytical tool, not
FREE
WaveForce Structure is a manual market-structure toolkit built around the impulse–correction–impulse logic. Core idea You mark three structure points. The indicator helps you formalize the markup, zones, and working levels. It does not replace your decision with automatic buy/sell calls. Panel features 1-2-3 markup Place structure points, lines, and labels. Suitable for impulse sequences and for reading corrective formations. Zones Zones between key legs of the markup with adjustable fill. Usefu
WaveForce Mark is a panel indicator for manual chart markup and quick access to trading rules inside MetaTrader. Purpose When market structure is already clear, you still need clean lines, labels, and a short checklist of rules. Mark keeps markup tools and text cards in one panel so you do not leave the chart. What you get Markup tab Tools for drawing lines on the chart in a consistent panel style. Cleanup actions help you remove objects and keep the chart readable. Wave logic tab Labels and hel
WaveForce WPR MTF shows Williams Percent Range for the current chart and optional higher or lower timeframes in a single subwindow. Features Up to 8 %R lines at once (Chart, M1–MN) Adjustable period, colours, styles and widths Classic levels at −20 and −80 Optional text panel with latest values (off by default) How to use Attach to any chart. Enable the timeframes you need (e.g. Chart + H1 + H4). Watch overbought / oversold zones together across timeframes. Note This is an analytical tool, not
FREE
WaveForce PSAR MTF plots Parabolic SAR calculated on a timeframe you choose and maps it onto the chart you are viewing. Features SAR from Chart, M1, M5, M15, M30, H1, H4, D1, W1 or MN1 Adjustable acceleration step and maximum Colour, size and arrow code for dots Two display modes: fill every chart bar (default) show dots only on the open of the SAR timeframe How to use Attach to any chart. Select the SAR timeframe (e.g. H1 on an M15 chart). Fine-tune step / maximum if needed. Note This is an an
FREE
WaveForce Linreg Channel draws a linear regression channel on the last N bars, with deviation bands at ±1σ and ±2σ (TradingView-style layout). Features Center regression line ±1σ solid bands, ±2σ dotted bands Adjustable lookback (20–2000 bars) Adjustable σ multipliers, colours and width Optional ray to the right Optional chart label (off by default) How to use Attach to any chart. Set the number of bars for the channel. Tune ±1σ / ±2σ multipliers if needed. Note This is an analytical tool, not
FREE
Filtro:
Sem comentários
Responder ao comentário