Beholder

🎯 BEHOLDER – THE INDICATOR THAT REVEALS HIDDEN PATTERNS IN TIME

😫 THE REAL TRADER’S PROBLEM: TEMPORAL BLINDNESS
Every week, thousands of traders face the same dilemma:

A flood of economic events (NFP, CPI, Interest Rates, Retail Sales…)
Very little time to analyze correlations
Decisions made on “gut feeling,” without reliable historical context

Trying to do this manually is insane:
📅 Scrolling back through dozens of weeks on the calendar
🔍 Comparing event by event
🧮 Trying to calculate patterns in your head
⏰ Spending hours and still risking human error

The result?
❌ Wrong entries
❌ Compromised risk management
❌ Missed opportunities
❌ Constant stress before the most critical weeks

👁️ THE SOLUTION: BEHOLDER – THE EYE THAT SEES THE INVISIBLE
Inspired by the legendary creature that sees everything, Beholder automatically analyzes time-based patterns and historical correlations that ordinary traders simply cannot see.

While you only see the upcoming week’s calendar…
➡️ Beholder identifies identical past weeks and shows you how the market reacted.

✅ Global events
✅ Base currency of the pair
✅ Quote currency of the pair
✅ All in seconds, with zero manual effort

🚀 PROFITS BUILT ON REAL BENEFITS

1️⃣ Precision Timing
Before: “I think week X was similar…”
After: “Week of 12/04: 100% correlation with next week, history shows high volatility after CPI.”

2️⃣ Smarter Risk Management
Protect yourself based on how the market reacted in equivalent scenarios.
You no longer trade blind—you trade with real statistical context.

3️⃣ Optimized Strategy
Beholder uncovers repeating patterns like:

80% of the time: High volatility in EURUSD when NFP + CPI happen together
70%: Defined trend by Wednesday
85%: Breakout opportunities

4️⃣ Operational Confidence
📊 Concrete data
⚖️ Valid historical comparisons
🎯 Increased predictability
🔮 Clear and confident decisions

💡 REAL EXAMPLE
Upcoming week: NFP + CPI on the calendar.
Without Beholder: “It’s going to be volatile, better be careful…”
With Beholder:
“Identical to week 12/04 → NFP + CPI together → history shows average 150-pip range on EURUSD → best entry post-CPI, stop set at 2x volatility.”

🔥 UNIQUE COMPETITIVE EDGE
While other traders:
❌ Look at isolated events
❌ Ignore temporal correlations
❌ Trade on intuition

You trade with:
✅ Multidimensional vision
✅ Temporal intelligence
✅ Proven statistical edge

🎯 THE FINAL VERDICT
Beholder is not “just another indicator.”
It’s a temporal navigation system. It transforms:

Uncertainty → Predictability
Complexity → Clarity
Guesswork → Strategy
Anxiety → Confidence

📈 READY TO SEE WHAT OTHERS CAN’T?
Beholder: Because trading success is not about predicting the future, but identifying the past patterns that repeat in the present.

“The average trader sees events. The Beholder trader sees temporal patterns.”

🎁 Exclusive Bonus: With the weekly offset, you can analyze not only the upcoming week, but any future week — unmatched strategic flexibility!

👉 Get Beholder now and transform your trading.
BEHOLDER: YOUR EYES ON THE PAST, YOUR GUIDE TO THE FUTURE.


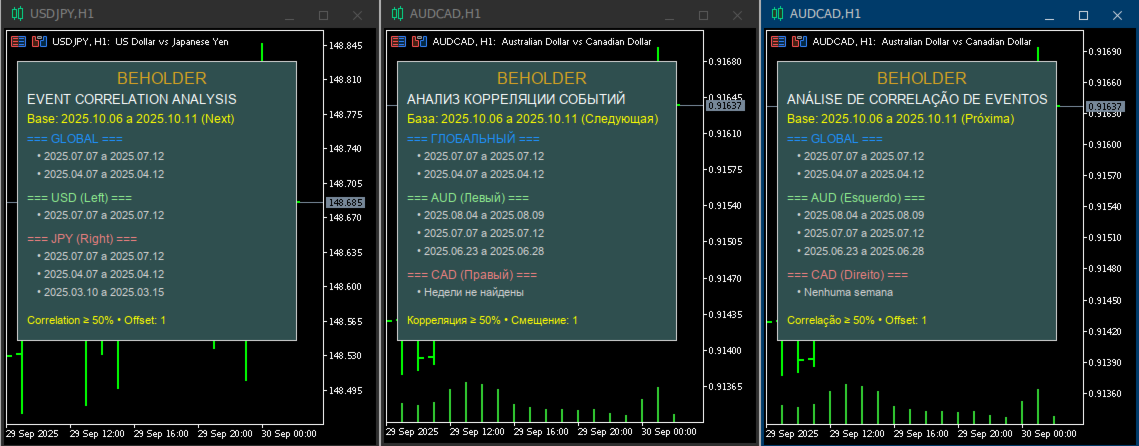
The Beholder is a revolutionary indicator that analyzes temporal correlations between economic events. It identifies past weeks with high similarity to the reference week, providing valuable insights for your strategic positioning.

⚙️ PARAMETER CONFIGURATION

  1. week_offset (Week Offset)
    -1: Analyzes the previous week

0: Analyzes the current week (default)

1: Analyzes the next week

2+: Analyzes future weeks

Practical Example:
If today is Friday, offset 0 analyzes events from Monday to Friday of the current week.
Offset 1 analyzes events scheduled for the upcoming week.

  1. event_percentage (Minimum Correlation Percentage)
    50%: Correlation (recommended)
    80%: Correlation (fewer results possible)
    100%: Correlation (very rare to exist)

Recommendation: Start with 50% for a balance between quantity and quality.

  1. num_weeks (Weeks for Analysis)
    12: 3-month analysis
    26: 6-month analysis
    52: 1-year analysis (recommended)

  2. num_weeks_output (Weeks to Display)
    3: Displays up to 3 correlated weeks (default)

  3. language (Interface Language)
    0: English (default)
    1: Russian (Русский)
    2: Portuguese (Português)


추천 제품
Higher Time Frame Bars
Rajesh Kumar Nait
5 (1)
이 지표는 동일한 차트에서 추적하려는 다른 기간 캔들스틱을 효율적으로 추적합니다. 1. 동일한 차트에 막대를 로드하려면 더 높은 기간을 선택하세요. 2. 촛대의 색상과 스타일을 사용자 정의하세요 3. 캔들스틱을 그릴 막대 수를 선택하세요. 4. 심지 및 몸체와 함께 더 높은 기간의 전체 양초를 추적합니다. 5. 차트 전환을 원하지 않는 사람들을 위해 쉽고 편리합니다. 이 지표는 동일한 차트에서 추적하려는 다른 기간 캔들스틱을 효율적으로 추적합니다. 1. 동일한 차트에 막대를 로드하려면 더 높은 기간을 선택하세요. 2. 촛대의 색상과 스타일을 사용자 정의하세요 3. 캔들스틱을 그릴 막대 수를 선택하세요. 4. 심지 및 몸체와 함께 더 높은 기간의 전체 양초를 추적합니다. 5. 차트 전환을 원하지 않는 사람들을 위해 쉽고 편리합니다.
Percent Range PRO
Esmelindro Gedeao Rios Jacobsen
Percent Range PRO Professional percentage-based intraday levels for precision Day Trading. Automatically projects key expansion, support, resistance and exhaustion zones from the previous daily close. Designed for traders who use context and confluence with: • VWAP • Moving Averages • Fibonacci • Price Action • Support & Resistance Works across multiple markets: • Indices • Forex • Gold • Crypto • Futures Automatic daily levels Clean professional visualization MT4 & MT5 compatible Precis
Go Ferramentas
Fabio Oliveira Magalhaes
This product is a set of tools that help the trader to make decisions, bringing information from different categories that complement each other: trend, support / resistance and candle patterns. It also has a panel with information about the balance. The trend has two different calculations and is shown as colored candles. Strategy 1 is longer, having 3 different states: up, down and neutral trend. Strategy 2 has a faster response and has only 2 states: up and down trend. Support and resistance
Quick Draw Panel
Samuel Munyaradzi Gama
Quick Draw Panel lets you instantly draw custom present trading objects (zones and trendlines) instantly with one click from the panel fixed neatly in any chart corner. No more searching through toolbars or menus one click, one object, done. Fully customizable colors, line size, and style.  Ideal For: Institutional / Smart Money Concept (SMC) / Supply and Demand traders. Supply and Demand zone marking. Technical Analysis marking. Liquidity and ICT Order Block marking. Clean, minimalist charting
Institutional Zones Pro
Jackson Mukurani Wanguthi
Manually drawing support and resistance levels takes time, and no two traders mark the same spots. Institutional Zones Pro solves this by automatically calculating and displaying key levels as zones on your chart. Instead of thin lines, it draws areas where price has historically reacted. Active zones remain visible and extend forward. When price moves through a zone, it updates to show the level is no longer active. This keeps your chart clean and tells you at a glance which areas still matter
Candle Timer is a lightweight indicator that shows the remaining time until the current candle closes. It is designed to be minimal and configurable, allowing traders to keep focus on price action while still monitoring candle closing time. The indicator can be displayed as a fixed label on the chart or follow the current market price. Features • Displays remaining candle time • Option to show only the time or include label text • Optional price-following mode • Automatic neutral color base
--- StudentK Sync Chart --- 1. Move charts at the same time 2. Cross check among different Symbols and Timeframes 3. Plan your own trading strategies --- Context --- StudentK is not indicated as a master or K Sir for knowledgeable person who claims for winning all the time. (But lots of traders should know the fact that it is rarely truth, especially in fluctuated period of time) StudentK is a group of years-experienced traders who want to share amazing tools in Free and Paid versions. Aiming
Volume indicator
Aleksandr Puchkin
이   표시기는   두   가지   기간으로   작동하며   작업   차트에   직접   이벤트를   시각적으로   표시하고   지원 / 저항   수준   역할을   하는   수평   수준을   표시할   수   있습니다 . 형성된   볼륨의   다른   값은   차트의   오른쪽으로   향하는   레벨이   생성되는   해당   막대에   색상   표시로   표시됩니다 .   작업   차트에는   이전   기간에서   받은   수준도   표시됩니다 .   수준   표시   및   해당   속성은   표시기   설정에서   설정됩니다 .   된   기간의   수준은   일반적으로   더   높은   우선   순위를   갖습니다 .   각   레벨에는   레벨에   대한   필수   정보가   포함된   툴팁이   있습니다 .   평균   범위   값 (ATR) 은   실제   수준을   얻기   위해   사용됩니다 .   틱   및   실제 ( 사용   가능한   경우 )   볼륨
Multi Temporalities Osw MT5
William Oswaldo Mayorga Urduy
MULTI-TIMES FOR METATRADER 5 This indicator, in a lower window, shows the current chart in different timeframes, this can help you better decipher the market, taking into account the higher timeframes. Among the settings that you can modify are: view of prices in charts view of the temporalities in the graphs enable each of the graphics in the different temporalities (M1, M5, M15, H1, H4, D1, W1, MN1).
NeuronStructure reads market structure the way a desk does and labels every event on the exact closed bar that confirmed it, so what you see now is what you would have seen then. It is an indicator for chart analysis only: it draws on the chart, it does not place, modify or close trades, it does not send orders, and it does not manage positions or accounts. It is the market-structure companion to NeuronLiquidity, built to sit alongside it: structure tells you the framework and bias, liquidity te
LT Support Resistance - 지지와 저항을 100% 자동으로 식별 수동으로 지지와 저항선을 그리느라 귀중한 시간을 낭비하는 데 지치셨나요? 아니면 매번 중요한 레벨을 놓쳐서 답답하셨나요? LT Support Resistance는 이러한 번거로운 작업을 없애기 위해 개발되었습니다. 여러 타임프레임(시간족)을 동시에 분석하여, 거래 중인 자산의 가장 중요한 구역을 자동으로 식별하고 차트에 표시해 줍니다. == 중요 레벨의 스마트 자동화 == 주관적이고 시간이 오래 걸리는 수동 라인 작도 대신, 본 지표는 과거 가격 데이터를 분석하여 유의미한 반전 포인트를 식별하고, 가격이 '실제'로 신뢰하고 반응하는 지지 및 저항선을 그려줍니다. 그 결과 데이터에 기반한 객관적이고 신속한 분석이 가능해집니다. == 주요 특징 == 100% 자동 감지: 수동 분석 없이도 지지/저항 레벨 식별 멀티 타임프레임(MTF): M5 차트에서 H1, H4, D1, W1 레벨을 동시에 시각화 스마트 알
Fight Zone
Tiago Viger Ortiz
Vertical bar chart of candles! What is it This indicator creates a vertical bar chart of all visible candles corresponding to the amount of candles that the bars cross. The goal of this indicator is to easily check the places or regions where the candles concentrate. Those regions are a good place to place positions because they have a increased chance of staying more time there again. It's hard to explain in words the exactly working of this indicator, we suggest you watch the video, it is o
ZigZagAllinOne
Alberto Da Silva Lira
Indicator focusing on the market's ZigZag, also adding 2 other already established indicators: Book of Offers and Balance Aggressor (Time & Trades), this indicator allows to detect the best price trigger (buy or sell) in the aggressions to the Book of Offers including filters important as Aggression in Candle. Recommended use on the Brazilian iBovespa B3, but it also serves in Forex as long as the assets have information from the Book, in the case of Forex it is not possible to use the Aggress
KT Tether Line MT5
KEENBASE SOFTWARE SOLUTIONS
The KT Tether Line is a trend-following tool consisting of three indicators that work together to generate trading signals. It can correctly identify market trends while signaling trade entries. It was first introduced by Bryan Strain in the Stock & Commodities magazine in 2000 in "How to get with the trend and out at the end." The Concept When a market trend is confirmed, the most challenging part is determining the timing of the entries. This indicator alerts you to potential trend reversals
Aussenstab Markttechnik
Alexander Josef Zeidler
This indicator shows external bars ("Aussenstäbe") in the chart in candle form. The colors of the candles can be set individually. Also different colors for bearish and bullish bars are possible. In addition, the color of the wicks or outlines is also adjustable. Outside bars are mentioned e.g. by Michael Voigt in the book "Das große Buch der Markttechnik". All other candles are inner bars.
Timer Pro
Juan Pablo Sanchez Correa
The Timer PRO indicator shows a countdown for the closing of the current candle on the main chart. Main Features: Main Timer: Shows the remaining time for the current candle. Changes to alert color (red) when there are 10 seconds or less remaining. It is activated/deactivated with the 'T' key. Multitemporal Panel (MTF): A floating panel that displays countdowns for multiple timeframes simultaneously. When you click on a timeframe in the panel, that specific chart opens. It is activated/deactiv
Rocket Trend
Andriy Sydoruk
The Rocket Trend indicator is trending. The indicator draws two-color points connected by lines along the chart. This is a trend indicator, it is an algorithmic indicator. It is easy to work and understand when a blue circle appears, you need to buy, when a red one appears, sell. The indicator is used for scalping and pipsing, and has proven itself well. Rocket Trend is available for analyzing the direction of the trend for a specific period of time. Ideal for novice traders learning the laws o
MT5 Rectangle Extender Indicator
Muhammad Shamsuddeen Muhammad
MT5 Rectangle Extender Indicator is a simple and easy tool that automatically extends any box/rectangle drawn on the chart to the right edge of the screen.  This tool can be used for easy drawing of zones and can help with determining future areas of interest on the chart once price trades back to those levels. Very suitable for supply and demand, order blocks, POI's (Points of Interest) mapping on charts. Sometimes its better to have a zone than a single price level as price can shoot above or
SSL Channel Indicator MT5을 소개합니다. 가격 추세 동향을 시각화하여 거래 정확성을 향상시키기 위해 설계된 강력한 도구입니다. 이 지표는 간단하지만 효과적인 이중 SMA 접근 방식을 통해 추세 반전 및 지속을 식별하려는 트레이더에게 이상적입니다. 혁신적인 플립 기술을 활용하여 SSL Channel Indicator MT5은 명확한 시각적 신호를 제공하여 다양한 시장 상황에서 적시에 거래 결정을 내리는 데 도움을 줍니다. 데이 트레이더이든 장기 투자자이든, 이 지표는 귀하의 거래 전략을 크게 향상시킬 수 있습니다. MQL 제품 설치 가이드 | MT4/MT5에서 구매한 MQL 제품 업데이트 | 일반 문제 해결 가이드 | 지표 설정 / 가이드 주요 기능 버퍼 통합: 지표 값을 Expert Advisors가 자동 거래를 위해 직접 읽을 수 있는 접근 가능한 버퍼로 노출합니다. 팝업 알림: 신호 이벤트에서 MetaTrader 알림 팝업을 발생시켜 거래 설정을 놓치지 않도록
Veltrion Market Environment   is a professional market safety dashboard for MetaTrader 5. This indicator helps manual traders evaluate current market conditions before making trading decisions. It does not open trades, close trades, modify orders, or provide buy/sell signals. The dashboard analyzes key market environment factors: Spread condition ATR-based volatility condition EMA-based trend or range condition Trading session condition Market safety score Optional economic calendar status The i
Orderflow Super Candles - Simple Footprint Chart Indicator Platform: MetaTrader 5 (MT5)  (The last screenshot shows the use of the DOM tool in conjunction with the product.) 1. Product Introduction Orderflow Super Candles is a professional charting tool based on underlying Tick data analysis, designed to provide traders with a deep "X-ray" view of the market. By parsing the buy and sell volume distribution within each candlestick, this indicator visualizes the hidden market microstructure. It
Nebulon Smart Trap AI
Tumpa Sarkar
5 (1)
Nebulon Smart Trap AI – Advanced Liquidity Trap Analysis for MetaTrader 5 Nebulon Smart Trap AI is a professional market analysis indicator for MetaTrader 5, developed for traders who want a more structured way to identify liquidity events, false breakouts, stop-hunt reactions, demand and supply interactions, and potential reversal zones directly from price action. Modern financial markets are heavily influenced by liquidity. Price often moves beyond obvious highs and lows, attracts breakout tra
KT Top G MT5
KEENBASE SOFTWARE SOLUTIONS
KT Top G는 가격 행동 기반의 인디케이터로, 스마트 채널 분석을 결합하여 시장의 잠재적인 고점과 저점을 식별합니다. 반전 가능성이 감지되면, 차트에 굵고 선명한 화살표를 표시하여 시장이 반전되기 전에 미리 알려줍니다. 큰 화살표: 가격 소진과 모멘텀 전환을 감지하여 고확률의 시장 고점과 저점을 강조합니다. 작은 화살표: 낮은 확률의 반전 지점을 나타내며, 실제 반전 전에 종종 돌파됩니다. 기능 광범위한 호환성: 모든 통화쌍은 물론, 지수, 주식, ETF 등 다양한 종목에서 매끄럽게 작동합니다. 다중 시간 프레임 최적화: M1, M5에서의 스캘핑, H1, H4, D1에서의 스윙 트레이딩에 모두 적합합니다. 중심선 포함 동적 채널: 화살표 외에도 현재 시장 범위와 추세 방향을 강조하는 중간선을 포함한 채널이 함께 표시됩니다. 리페인트 없음: 차트에 화살표가 한 번 나타나면 유지되며, 사라지거나 바뀌지 않습니다. 변동성 있는 시장 대응 가능: 길이 및 스무딩 계수를 조정하여 예측
In the context of trading, Malaysia SNR (Support and Resistance) refers to the technical analysis of support and resistance levels in financial markets, particularly for stocks, indices, or other assets traded. This is single timeframe version. Multiple timeframe version is avaiable here . There are three type of Malaysia SNR level Classic , GAP and Flipped 1. Classic Support is the price level at which an asset tends to stop falling and may start to rebound. It acts as a "floor" where demand is
QuantumAlert Stoch Navigator is a free indicator available for MT4/MT5 platforms, its work is to provide "alerts" when the market is inside "overbought and oversold" regions in the form of "buy or sell" signals. This indicator comes with many customization options mentioned in the parameter section below, user can customise these parameters as needful. Join our   MQL5 group , where we share important news and updates. You are also welcome to join our private channel as well, contact me for the p
FREE
Nro Lines
Sonia Maria Lima Costa
Nro Lines 지표는 선 플로팅을 통해 주요 가격 수준의 정확하고 동적인 시각화를 제공합니다. 이 기능을 통해 트레이더는 최적화된 기술 분석을 수행할 수 있으며, 이는 효과적인 거래 전략 개발과 시장 진입 및 퇴출에 대한 확실한 결정을 내리는 데 필수적입니다. 주요 기능:     - 시장 변화에 따라 조정되는 동적 참조선으로, 트레이더에게 업데이트되고 관련성 있는 시각적 표현을 제공합니다.     - 관련 수준의 자동 계산으로 사용자가 차트 해석에만 집중할 수 있게 합니다.     - 여러 글로벌 시장과의 호환성으로, 전 세계 다양한 금융 시장에서 활동하는 트레이더를 위한 다용도 도구가 됩니다.     - 다양한 시장 세션에 대한 일정 사용자 지정 기능으로, 다양한 시간대에서 운영하거나 특정 거래 시간을 가진 시장을 전문으로 하는 트레이더에게 중요합니다.     - 색상, 스타일, 선의 두께를 사용자 지정할 수 있어 각 트레이더가 자신의 시각적 선호도와 분석 요구에
이 다중 시간 프레임 및 다중 기호 표시기는 이중 상단/하단, 머리 및 어깨, 페넌트/삼각형 및 플래그 패턴을 식별합니다. 또한 네크라인/삼각형/깃대 이탈이 발생한 경우에만 경고를 설정하는 것도 가능합니다(넥라인 이탈 = 상단/하단 및 헤드&숄더에 대한 확인된 신호).       지표는 단일 차트 모드에서도 사용할 수 있습니다. 이 옵션에 대한 자세한 내용은 제품의       블로그   . 고유한 규칙 및 기술과 결합하여 이 표시기를 사용하면 자신만의 강력한 시스템을 생성(또는 강화)할 수 있습니다. 특징 Market Watch 창에 표시되는 모든 기호를 동시에 모니터링할 수 있습니다. 하나의 차트에만 지표를 적용하고 전체 시장을 즉시 모니터링하십시오. M1에서 MN까지 모든 시간 프레임을 모니터링할 수 있으며 패턴이 식별되거나 중단될 때 실시간 경고를 보냅니다. 모든 Metatrader 기본 경고 유형이 지원됩니다. RSI를 추세 필터로 사용하여 잠재적 반전을 적절히 식별할 수
--- StudentK Sync Chart  --- 1. Move charts at the same time 2. Cross check among different Symbols and Timeframes 3. Plan your own trading strategies === Simple (Free) Version === 1. Allow USDJPY only 2. Support M5 and M15 3. * Contact StudentK for unlocking all timeframes * --- Context --- StudentK is not indicated as a master or K Sir for knowledgeable person who claims for winning all the time. (But lots of traders should know the fact that it is rarely truth, especially in fluctuated per
FREE
Divergence Notification
Edson Cavalca Junior
This indicator plots in the candles the divergence found in the selected indicator and can also send a notification by email and / or to the cell phone. Works on all TIMEFRAMES. Meet Our Products   He identifies the divergences in the indicators: Relative Strength Index (RSI); Moving Average Convergence and Divergence (MACD); Volume Balance (OBV) and;. iStochastic Stochastic Oscillator  (STOCHASTIC). It is possible to choose the amplitude for checking the divergence and the indicator has to b
DS 2MV Candles Colors
Herminio Jesus Da Costa Machado
DS 2MV Candles Colors  Created by Hermínio Machado 2025 The DS 2MV Candles Colors indicator visually enhances your chart by coloring candles based on price position relative to two Smoothed Moving Averages (SMMA) . It’s designed to help traders quickly identify the current trend direction and potential neutral zones at a glance. How It Works The indicator plots two Smoothed Moving Averages (SMMA) — one based on the High and another on the Low price. Candle colors change according to wher
이 제품의 구매자들이 또한 구매함
Neuro Poseidon MT5
Daria Rezueva
4.97 (31)
Neuro Poseidon is a new indicator by Daria Rezueva. It combines precise trading signals with adaptive TP/SL levels - creating best possible trades as a result! Message me and get  Neuro Poseidon Assistant  as a gift to automize your trading process! What makes it stand out? 1. Proven profitability on all assets and timeframes 2. Only confirmed BUY and SELL signals present on the chart 3. Adaptive TP & SL levels generated by the software for each trade 4. Easy to understand - suitable for al
SuperScalp Pro
Van Minh Nguyen
4.65 (26)
SuperScalp Pro – 고급 멀티 필터 스캘핑 지표 시스템 SuperScalp Pro는 클래식 Supertrend와 여러 지능형 확인 필터를 결합한 고급 스캘핑 지표로, 거래 기회를 식별하는 데 도움을 줍니다. M1부터 H4까지 다양한 시간대에서 효율적으로 작동하며, XAUUSD, BTCUSD 및 주요 Forex 통화쌍에 최적화되어 있습니다. 이 지표는 명확한 매수 및 매도 신호를 제공하며, ATR 기반으로 진입가, 손절가, 익절가를 자동 계산하여 보다 효과적인 리스크 관리를 지원합니다. Fibonacci Take Profit 기능은 중요한 가격 구간에서 더 빠르게 포지션을 청산할 수 있도록 하며, 해당 수준 도달 시 알림을 전송합니다. 기본 설정은 Fibonacci Take Profit이 활성화된 상태로 최적화되어 있으며, 보다 안정적이고 일관된 거래 경험에 중점을 둡니다. 차트에 적용하는 것만으로 즉시 사용할 수 있습니다. 고급 사용자를 위해 모든 파라미터는 자유롭게 사용
Divergence Bomber
Ihor Otkydach
4.9 (90)
이 지표를 구매하신 분께는 다음과 같은 혜택이 무료로 제공됩니다: 각 거래를 자동으로 관리하고, 손절/익절 수준을 설정하며, 전략 규칙에 따라 거래를 종료하는 전용 도우미 툴 "Bomber Utility" 다양한 자산에 맞게 지표를 설정할 수 있는 셋업 파일(Set Files) "최소 위험", "균형 잡힌 위험", "관망 전략" 모드로 설정 가능한 Bomber Utility의 셋업 파일 이 전략을 빠르게 설치, 설정, 시작할 수 있도록 돕는 단계별 영상 매뉴얼 주의: 위의 모든 보너스를 받기 위해서는 MQL5 개인 메시지 시스템을 통해 판매자에게 연락해 주세요. 독창적인 커스텀 지표인 “Divergence Bomber(다이버전스 봄버)”를 소개합니다. 이 지표는 MACD 다이버전스(괴리) 전략을 기반으로 한 올인원(All-in-One) 거래 시스템입니다. 이 기술 지표의 주요 목적은 가격과 MACD 지표 간의 다이버전스를 감지하고, **향후 가격이 어느 방향으로 움직일지를 알려주는
SMC Intraday Formula
Kareem Abbas
5 (15)
먼저 솔직하게 말하겠습니다. 어떤 인디케이터도 단독으로 당신을 수익성 있게 만들어주지 않습니다. 누군가 그렇게 말한다면, 그는 당신에게 꿈을 파는 것입니다. 완벽한 매수/매도 화살표를 보여주는 모든 인디케이터는 완벽하게 보이도록 만들 수 있습니다 — 단지 올바른 과거 구간을 확대하고 승리한 거래만 캡처하면 됩니다. 우리는 그렇게 하지 않습니다.  SMC Intraday Formula는 도구입니다. 시장 구조를 읽고, 가장 높은 확률의 가격 구간을 표시하며, 현재 스마트 머니의 흐름이 어떻게 보이는지 아주 단순한 언어로 보여줍니다. 최종 결정은 여전히 당신이 합니다. 실행도 당신이 합니다. 하지만 이제는 희망이 아니라 정확성으로 거래하게 됩니다. 우리는 이 인디케이터를 지난 약 3년 동안 골드(XAUUSD) 및 주요 외환 통화쌍의 데이 트레이딩 스캘핑에 사용해 왔습니다. M1, M5, M15, M30에서 우리의 핵심 도구입니다. 이 도구는 미래를 예측하려 하지 않습니다 — 지금 형성
Entry In The Zone and SMC Multi Timeframe is a real-time 2-in-1 market analysis tool that combines market structure analysis and a No Repaint BUY / SELL signal system into a single indicator, built on Smart Money Concepts (SMC) — a widely adopted framework used by professional traders to understand market structure. This indicator helps you see the market more clearly, make decisions based on structure rather than guesswork, and focus on high-probability zones where price is more likely to react
이 제품은 2026년 시장에 맞게 업데이트되었으며 최신 MT5 빌드에 최적화되었습니다. 가격 업데이트 안내: Smart Trend Trading System은 현재 $99 에 제공됩니다. 다음 30회 구매 후 가격은 $199 로 인상됩니다. 특별 혜택: Smart Trend Trading System 구매 후 저에게 개인 메시지를 보내시면 Smart Universal EA를 무료 로 받을 수 있으며, Smart Trend 신호를 자동 거래로 전환할 수 있습니다. Smart Trend Trading System은 리페인트 없음, 재그리기 없음, 지연 없음의 완전한 트레이딩 시스템으로, 더 깨끗한 신호, 더 나은 추세 방향, 그리고 더 체계적인 시장 거래 방식을 원하는 트레이더를 위해 제작되었습니다. Online course , manual and download presets . 이 시스템은 추세 감지, 반전 구간, Smart Cloud, 트레일링 스톱 로직, 지지와 저항, 캔들 색
Quantum TrendPulse
Bogdan Ion Puscasu
5 (25)
SuperTrend   ,   RSI   ,   Stochastic   의 힘을 하나의 포괄적인 지표로 결합하여 트레이딩 잠재력을 극대화하는 궁극의 트레이딩 도구   인 Quantum TrendPulse를   소개합니다. 정밀성과 효율성을 추구하는 트레이더를 위해 설계된 이 지표는 시장 추세, 모멘텀 변화, 최적의 진입 및 종료 지점을 자신 있게 식별하는 데 도움이 됩니다. 주요 특징: SuperTrend 통합:   주요 시장 추세를 쉽게 따라가고 수익성의 물결을 타세요. RSI 정밀도:   매수 과다 및 매도 과다 수준을 감지하여 시장 반전 시점을 파악하는 데 적합하며 SuperTrend 필터로 사용 가능 확률적 정확도:   변동성이 큰 시장에서 숨겨진 기회를 찾기 위해 확률적 진동   을 활용하고 SuperTrend의 필터로 사용 다중 시간대 분석:   M5부터 H1 또는 H4까지 다양한 시간대에 걸쳐 시장을 최신 상태로 유지하세요. 맞춤형 알림:   맞춤형 거래 조건이 충족되면
SignalTech MT5
Yue Wang
5 (26)
SignalTech is an unique fully rule based trading system delivers an Institutional approach for both Independent Traders and Prop Firm Challengers. Never Repaint. Push Notification available. No over-optimization. All the winning trades with chart setups are published on the comments page. 2026-05 4107 Pips (Until 05-29 NY Closed) 2026-04 2243 Pips 2026-03 2165 Pips 2026-02 2937 Pips 2026-01 2624 Pips 2025-12 1174 Pips It can generate signals with Buy/Sell Arrows, Push Notification (To Mobile) an
Power Candles MT5
Daniel Stein
5 (8)
Power Candles V3 - 자체 최적화 강도 지표 파워 캔들 V3는 적용된 모든 차트에서 통화 및 상품의 강세를 실행 가능한 거래 계획으로 전환합니다. 단순히 캔들에 색상을 입히는 대신, 백그라운드에서 실시간 자동 최적화를 수행하여 현재 보고 있는 종목에 대한 최적의 손절매, 익절 및 신호 임계값을 제공합니다. 한 번의 클릭으로 실시간 거래에 적용할 수 있으며, 진입점, 손절매 및 익절 선이 정확한 가격에 맞춰 차트에 표시되고, 방향과 함께 알림이 발령됩니다. 이 도구는 Stein Investments 에코시스템의 일부입니다. 18개 이상의 도구와 함께 당신의 1대1 AI 트레이딩 멘토 Max.  항상 대기 중, 모든 인디케이터를 깊이 있게 이해, 무언가를 차근차근 생각해보고 싶은 순간에 도움을 줍니다.  https://stein.investments 에서 만나보세요 매 종가 바마다 3,000회 이상의 트레이딩 시뮬레이션. 9가지 강도 상태. 2가지 전략을 병렬로 테스트.
PrimeScalping
Temirlan Kdyrkhan
PrimeScalping is a powerful trading companion designed to generate high-probability entry signals with dynamic TP/SL/DP levels based on volatility. Built-in performance tracking shows win/loss stats, PP1/PP2 hits, and success rates — all updated live. Key Features: Buy/Sell signals with adaptive volatility bands Real-time TP/SL/DP levels based on ATR Built-in MA Filter with optional ATR/StdDev volatility Performance stats panel (Success, Profit/Loss, PP1/PP2) Alerts via popup, sound, push, or e
M1 Quantum MT5
Hamed Dehgani
5 (1)
M1 Quantum 은 M1 전용 전문 트레이딩 시스템으로, 손절(Stop Loss), 익절(Take Profit), 그리고 스마트 자금 관리 기능이 내장된 빠르고 정확한 거래 신호를 제공합니다. M1 Quantum 은 연속 수익 거래 에 집중하여 계좌를 빠르게 성장시키도록 설계된 전문 자금 관리 시스템을 포함하고 있습니다. M1 Quantum 인디케이터 의 주요 기능 M1 타임프레임 및 모든 주요 통화쌍 용으로 설계됨 모든 거래에 손절과 익절 적용 자금 관리 시스템 이 포함되어 트레이더가 쉽게 거래할 수 있도록 안내 높은 승률 및 높은 연속 수익률 리페인트 없음, 지연 없음 모든 트레이더가 쉽게 이해 가능 M1 Quantum 을 사용하려면 M1 Quantum Assistant 가 필요합니다. 이 강력한 도구는 모든 M1 Quantum 구매자에게 무료로 제공됩니다 . M1 Quantum Assistant 다운로드 최신 업데이트와 새로운 제품 출시 소식을 받으려면 제 MQL5 채널 에
Trend Catcher ind mt5
Ramil Minniakhmetov
5 (5)
트렌드 캐처 인디케이터 트렌드 캐처 인디케이터는 개발자가 자체 개발한 맞춤형 적응형 트렌드 분석 지표들을 조합하여 시장 가격 움직임을 분석합니다. 단기적인 노이즈를 제거하고 근본적인 모멘텀 강도, 변동성 확대, 가격 구조 움직임에 집중하여 진정한 시장 방향을 파악합니다. 또한 이동 평균, RSI, 변동성 필터와 같은 맞춤형 지표들을 활용하여 가격을 평활화하고 트렌드를 필터링합니다. 실제 운영 모니터링 및 기타 제품은 다음 링크에서 확인하실 수 있습니다:   https://www.mql5.com/en/users/mechanic/seller 텔레그램에서는 EA나 설정 파일을 판매하지 않습니다. 사기이니 주의하세요. 모든 설정 파일은 블로그에서 무료로 제공됩니다. 중요! 구매 후 즉시 연락 주시면 사용 방법 및 보너스를 드립니다!
GoldenX Entry MT5
Kareem Abbas
5 (10)
GoldenX Entry는 MT5용 인디케이터로, 적응형 Smart Entry Trend 알고리즘, 신호 스코어링 시스템, 시장 레짐 감지 기능, 그리고 변동성 필터를 포함합니다. 각 신호에는 계산된 진입 레벨, 3개의 익절(TP1, TP2, TP3) 레벨, 그리고 손절(Stop-Loss) 레벨이 포함됩니다. 이 인디케이터는 다양한 시장 환경에 적응하도록 설계된 다중 분석 레이어 구조 위에 구축되어 있으며, 내장 최적화기와 통계 추적 시스템을 결합합니다. 또한 Risk-to-Reward(RR) 지표와 과거 거래 행동 기반의 정량 분석을 제공합니다. 시작은 간단합니다 — 선택한 타임프레임에서 최적화기를 실행한 뒤 차트에서 바로 인디케이터를 사용하면 됩니다. 핵심 기능 GoldenX Entry는 하나의 차트에서 신호 엔진, 트레이드 관리 기능, 그리고 과거 통계 추적을 통합합니다: - 내장 최적화기: 최적화기는 차트에서 원클릭으로 실행됩니다. 200개의 파라미터 조합을 두 단계 탐색
FX Trend MT5 NG
Daniel Stein
5 (6)
FX Trend NG: 차세대 멀티 마켓 트렌드 인텔리전스 개요 FX Trend NG 는 다중 시간 프레임 기반의 전문 트렌드 분석 및 시장 모니터링 도구입니다. 몇 초 만에 전체 시장 구조를 파악할 수 있도록 설계되었습니다. 여러 차트를 일일이 전환할 필요 없이, 어떤 종목이 추세에 있는지, 어디에서 모멘텀이 약화되고 있는지, 그리고 어떤 시간 프레임이 서로 정렬되어 있는지 즉시 확인할 수 있습니다. 출시 기념 특별 혜택 – FX Trend NG 를 $30 (6개월) 또는 $80 평생 라이선스 로 이용할 수 있습니다. 이미 Stein Investments 고객이신가요? -> 메시지를 보내 전용 고객 그룹에 참여하세요. 설정이나 사용 방법이 필요하신가요? -> Stein Investments 공식 페이지 를 방문하세요. 1. FX Trend NG가 특별한 이유 3단계 추세 로직 – 단순한 Buy / Sell이 아닙니다 • 대부분의 지표는 Buy 또는 Sell 두 가지 상태만 제
Gann Made Easy MT5
Oleg Rodin
5 (6)
Gann Made Easy 는 mr.의 이론을 사용하여 최고의 거래 원칙을 기반으로 하는 전문적이고 사용하기 쉬운 Forex 거래 시스템입니다. W.D. 간. 이 표시기는 Stop Loss 및 Take Profit Levels를 포함하여 정확한 BUY 및 SELL 신호를 제공합니다. PUSH 알림을 사용하여 이동 중에도 거래할 수 있습니다. 구매 후 거래 방법 안내 및 유용한 추가 지표를 무료로 받으시려면 저에게 연락주세요! 아마도 Gann 거래 방법에 대해 이미 여러 번 들었을 것입니다. 일반적으로 Gann의 이론은 초보자 거래자뿐만 아니라 이미 거래 경험이 있는 사람들에게도 매우 복잡한 것입니다. Gann의 거래 방식은 이론적으로 적용하기 쉽지 않기 때문입니다. 나는 그 지식을 연마하고 Forex 지표에 최고의 원칙을 적용하기 위해 몇 년을 보냈습니다. 표시기는 적용하기가 매우 쉽습니다. 차트에 첨부하고 간단한 거래 권장 사항을 따르기만 하면 됩니다. 지표는 지속적으로 시장 분석
Meridian Pro
Ottaviano De Cicco
5 (2)
Meridian Pro 2.00: Professional Multi-Timeframe Trend Matrix for MT5 Meridian Pro 2.00 is a professional adaptive trend matrix for MetaTrader 5. It combines the original Meridian trend engine, a clean chart ribbon, closed-bar signal arrows, an 8-timeframe dashboard, Fuel momentum, weighted consensus, synthetic HTF processing and chart-native higher-timeframe context lines. The goal is simple: read current trend, multi-timeframe structure, strength, momentum and EA-ready state from one discipline
UZFX {SSS} 스캘핑 스마트 시그널 MT5는 급변하는 시장에서 정확한 실시간 시그널을 필요로 하는 스캘퍼, 데이 트레이더, 스윙 트레이더를 위해 설계된 리페인팅 없는 고성능 트레이딩 지표입니다. (UZFX-LABS)에서 개발한 이 지표는 가격 움직임 분석, 추세 확인, 스마트 필터링 기능을 결합하여 모든 통화 쌍과 시간대에서 확률이 높은 매수 및 매도 시그널을 생성합니다. 추천* 최적 시간대: 15분 이상. {1시간}이 제가 가장 선호하는 시간대입니다. 그리고 그 결과는 정말 놀라울 정도입니다...! 참고: { LTL 164343 } 지표와 함께 사용하면 신호 적중률을 높일 수 있습니다. LTL 신호를 통해 추세를 파악하고, SSS 신호를 진입 신호로 활용하세요. 이 접근 방식은 승률을 극대화하고 오신호를 방지하는 데 도움이 됩니다. 주요 기능 스마트 신호 감지 – 강력한 추세 반전 및 지속 패턴을 정밀하게 식별합니다. 다중 시간대 스캘핑 – 모든 시간대에서 완벽하게 작동
소개       Quantum Breakout PRO   , 브레이크아웃 존 거래 방식을 변화시키는 획기적인 MQL5 지표! 13년 이상의 거래 경험을 가진 숙련된 트레이더 팀이 개발한       퀀텀 브레이크아웃 PRO       혁신적이고 역동적인 브레이크아웃 존 전략으로 거래 여정을 새로운 차원으로 끌어올리도록 설계되었습니다. Quantum Breakout Indicator는 5개의 이익 목표 영역이 있는 브레이크아웃 영역의 신호 화살표와 브레이크아웃 상자를 기반으로 한 손절 제안을 제공합니다. 초보자 거래자와 전문 거래자 모두에게 적합합니다. Quantum EA 채널:       여기를 클릭하세요 중요한! 구매 후 설치 매뉴얼을 받으려면 개인 메시지를 보내주십시오. 추천: 기간: M15 통화쌍: GBPJPY, EURJPY, USDJPY,NZDUSD, XAUUSD 계정 유형: 스프레드가 매우 낮은 ECN, Raw 또는 Razor 브로커 시간: GMT +3 중개인 :
Atomic Analyst MT5
Issam Kassas
4.26 (35)
이 제품은 2026년 시장에 맞게 업데이트되었으며 최신 MT5 빌드에 최적화되었습니다. 가격 업데이트 안내: Atomic Analyst는 현재 $99 에 제공됩니다. 다음 30회 구매 후 가격은 $199 로 인상됩니다. 특별 혜택: Atomic Analyst 구매 후 저에게 개인 메시지를 보내시면 Smart Universal EA를 무료 로 받을 수 있으며, Atomic Analyst 신호를 자동 거래로 전환할 수 있습니다. Atomic Analyst는 리페인트 없음, 재그리기 없음, 지연 없음의 Price Action 거래 인디케이터로, 수동 거래, 신호 명확성, EA 자동화를 위해 설계되었습니다. User manual: settings, inputs and strategy. 가격 움직임, 강도, 모멘텀, 다중 시간대 방향 및 고급 필터를 분석하여 트레이더가 노이즈를 줄이고 약한 세팅을 피하며 더 체계적인 거래 결정을 내릴 수 있도록 돕습니다. 이 인디케이터는 복잡한 시장 계산
Reversion King Indicator
Eugen-alexandru Zibileanu
5 (4)
새로운 왕의 등장 - 인디케이터 + 주문 관리 표시(TP1 + TP2 + TP3) + 선택형 텔레그램 시그널 전송 기능 포함 (무료) (완전한 트레이딩 및 시그널 시스템) 골드를 위한 최고의 EA: Gold Slayer 이 인디케이터는 고급 전략, 사용자 지정 가능한 주문 관리 시스템, 그리고 엔벨로프 확장을 결합한 평균 회귀(mean reversion) 시스템을 포함하고 있습니다. 또한 RSI와 같은 여러 지능형 확인 필터를 통해 높은 확률의 반전 진입 구간을 포착하여 BUY 및 SELL 시그널을 제공합니다. 단순히 거래 방법만 배우는 것이 아니라, 여러 포지션을 효과적으로 관리하고 이전에 수익 중인 오픈 포지션으로 손실 거래를 커버하는 방법까지 익힐 수 있습니다. M5 전용으로 설계 및 최적화되었으며, 유동성이 풍부해 시그널이 더 깔끔하고 신뢰도 높은 BTCUSD와 XAUUSD에서 뛰어난 성능을 발휘합니다. 이 인디케이터는 ATR 기반으로 자동 계산된 진입가, 손절가, 익절가와
SmartScalping
Temirlan Kdyrkhan
SmartScalping is a powerful trading companion designed to generate high-probability entry signals with dynamic TP/SL/DP levels based on volatility. Built-in performance tracking shows win/loss stats, PP1/PP2 hits, and success rates — all updated live. Key Features: Buy/Sell signals with adaptive volatility bands Real-time TP/SL/DP levels based on ATR Built-in MA Filter with optional ATR/StdDev volatility Performance stats panel (Success, Profit/Loss, PP1/PP2) Alerts via popup, sound, push, or e
ARIPoint
Temirlan Kdyrkhan
1 (1)
ARIPoint is a powerful trading companion designed to generate high-probability entry signals with dynamic TP/SL/DP levels based on volatility. Built-in performance tracking shows win/loss stats, PP1/PP2 hits, and success rates all updated live. Key Features: Buy/Sell signals with adaptive volatility bands Real-time TP/SL/DP levels based on ATR Built-in MA Filter with optional ATR/StdDev volatility Performance stats panel (Success, Profit/Loss, PP1/PP2) Alerts via popup, sound, push, or email Cu
이 제품은 2026년 시장에 맞게 업데이트되었으며 최신 MT5 빌드에 최적화되었습니다. 가격 업데이트 안내: Smart Price Action Concepts는 현재 $200 에 제공됩니다. 다음 30회 구매 후 가격은 $299 로 인상됩니다. 특별 혜택: 구매 후 저에게 개인 메시지를 보내시면 무료 보너스 + 선물 을 받을 수 있습니다. 먼저, 이 트레이딩 도구는 리페인트 없음, 재그리기 없음, 지연 없음의 인디케이터이므로 전문적인 트레이딩에 적합하다는 점을 강조하고 싶습니다. Online course , and manual Smart Price Action Concepts Indicator는 초보자와 경험 많은 트레이더 모두에게 매우 강력한 도구입니다. 20개 이상의 유용한 인디케이터를 하나로 결합하고, Inner Circle Trader Analysis와 Smart Money Concepts Trading Strategies 같은 고급 트레이딩 아이디어를 통합합니다. 이 인디
Crystal Heikin Ashi Signals
Muhammad Jawad Shabir
5 (2)
Crystal Heikin Ashi Signals - Professional Trend & Signal Detection Indicator Advanced Heikin Ashi Visualization with Intelligent Signal System for Manual & Automated Trading Final Price: $149 ---------> Price goes up $10 after every 10 sales . Limited slots available — act fast . Overview Crystal Heikin Ashi Signals is a professional-grade MetaTrader 5 indicator that combines pure Heikin Ashi candle visualization with an advanced momentum-shift detection system. Designed for both manual traders
TrendProMaster
Temirlan Kdyrkhan
MasterTrend Indicator for MT5 A powerful trend-following and signal-evaluation tool MasterTrend   is a custom MT5 indicator that combines Moving Averages and ATR-based risk/reward logic to generate clear buy/sell signals. It visualizes dynamic SL/TP levels, evaluates past trade outcomes, and displays win/loss statistics in a clean on-chart panel. Key features include: Buy/Sell signals based on MA crossovers ATR-based SL/TP1/TP2/TP3 levels with visual lines and labels Signal outcome tracking wit
Azimuth Pro
Ottaviano De Cicco
5 (7)
Azimuth Pro V2: Synthetic Fractal Structure and Confirmed Entries for MT5 Overview Azimuth Pro is a multi-level swing structure indicator by Merkava Labs . Four nested swing layers, swing-anchored VWAP, ABC pattern detection, three-timeframe structural filtering, and closed-bar confirmed entries — one chart, one workflow from micro-swings to macro-cycles. This is not a blind signal product. It is a structure-first workflow for traders who care about location, context, and timing. V2 Launch Offe
ScalpPoint
Temirlan Kdyrkhan
ScalpPoint is a powerful trading companion designed to generate high-probability entry signals with dynamic TP/SL/DP levels based on volatility. Built-in performance tracking shows win/loss stats, PP1/PP2 hits, and success rates — all updated live. Key Features: Buy/Sell signals with adaptive volatility bands Real-time TP/SL/DP levels based on ATR Built-in MA Filter with optional ATR/StdDev volatility Performance stats panel (Success, Profit/Loss, PP1/PP2) Alerts via popup, sound, push, or emai
RelicusRoad Pro MT5
Relicus LLC
4.96 (24)
RelicusRoad Pro: 퀀트 시장 운영 체제 70% 할인 평생 이용권 (한정 시간) - 2,000명 이상의 트레이더와 함께하세요 왜 대부분의 트레이더는 "완벽한" 지표를 가지고도 실패할까요? 진공 상태에서 단일 개념 만으로 거래하기 때문입니다. 문맥 없는 신호는 도박입니다. 지속적인 승리를 위해서는 컨플루언스(중첩) 가 필요합니다. RelicusRoad Pro는 단순한 화살표 지표가 아닙니다. 완전한 퀀트 시장 생태계 입니다. 독점적인 변동성 모델링을 사용하여 가격이 이동하는 "공정 가치 로드"를 매핑하고, 단순 노이즈와 실제 구조적 돌파를 구분합니다. 추측은 그만두세요. 기관급 로드 로직으로 거래를 시작하세요. 핵심 엔진: "Road" 알고리즘 시스템의 중심에는 시장 상황에 실시간으로 적응하는 동적 변동성 채널인 Road Algo 가 있습니다. 세이프 라인(평형) 과 가격이 수학적으로 반전될 가능성이 높은 확장 레벨 을 투영합니다. Simple Road: 일반적인 시장을 위
Market Structure Order Block Dashboard MT5는 시장 구조와 주요 가격 반응 구역을 차트에서 직접 읽고자 하는 트레이더를 위해 설계된 MT5 지표입니다. BOS, ChoCH, 오더 블록, Fair Value Gap (FVG), 유동성, Kill Zones, Volume Profile 그리고 빠른 분석을 위한 콤팩트한 대시보드를 결합합니다. 이 지표는 시장 구조, ICT 및 Smart Money 개념을 의사결정 프레임워크로 사용하는 트레이더를 대상으로 합니다. 추세 지속, 가능한 반전, 가격 불균형, 유동성 타겟 및 관심 구역을 보다 체계적으로 식별하는 데 도움을 줄 수 있습니다. 구매자를 위한 포함 리소스 구매 후 MQL5 개인 메시지로 요청하시면 완전한 PDF 사용 설명서와 파라미터 설정 팁을 제공해 드립니다. MQL5 개인 메시지를 통한 직접 기술 지원. 1.20 버전은 두 가지 주요 추가 기능을 제공합니다: Pending BOS / Pending
MT4 버전도 준비되어 있습니다 https://www.mql5.com/ko/market/product/170617  M30/H1/H4 스윙 버전 출시 큰 움직임을 잡고 싶으신가요? Gold Signal Swing Pro (M30/H1/H4). 목표: 거래당 $20-$80+. https://www.mql5.com/en/market/product/177643 KURAMA GOLD SIGNAL PRO (MT5) — 7층 필터 탑재 XAUUSD 완벽 트레이딩 시스템 리페인트 없음. 리드로우 없음. 지연 없음. 모든 신호는 확정 후 변하지 않습니다. 구매자 한정 혜택: 매수 라이선스 구매자에게 AI Zone Radar ($59 상당) + PDF 매뉴얼을 무료 제공합니다. 구매 후 MQL5에서 메시지를 보내주세요. AI Zone Radar: http
제작자의 제품 더 보기
Macd Authentic
Joao Marcilio
The MACD (Moving Average Convergence Divergence) indicator is one of the most widely used technical analysis tools by traders worldwide. Created by Gerald Appel in the 1970s, the MACD is an indicator that helps investors identify the trend direction, trend strength, and possible trend reversal points. The MACD indicator is composed of a histogram that shows the difference between the 12-period exponential moving average and the 26-period exponential moving average. The top part of the histogram
FREE
Many traders use The Bull-Bear Indicator, I decided to combine the two into just one, so the visualization is better, and I am sharing it with you. the trading rules remain the same, you can adjust the period as per your preference. The Bull-Bear Indicator is a free indicator with several versions widely published on the internet, this is just a version that I put together, I hope you like it. If you want to know the indicators of my authorship, please visit my page here .
FREE
Qv2 OBOS
Joao Marcilio
Qv² OBOS is an indicator that aims to identify overbought and oversold regions considering price standard deviation and volume analysis. Oversold signals are indicated by arrows pointing upwards. Overbought signals are indicated by arrows pointing downwards. Can be used in all timeframes. Can be used on all pairs. I use in H1 Important note, the histogram is displayed to improve the trader's analysis. But the signs of overbought and oversold are the arrows as mentioned above. Important note:
Qv2 Trend
Joao Marcilio
The Qv² Trend is an indicator that aims to identify trends. Buying trend signals are indicated by arrows pointing up. Selling trend signals are indicated by arrows pointing down. It can be used in all deadlines. It can be used in all pairs. I use it on the H1 with a period of 24. Important note: I recommend using it in markets that naturally show trends. For in range markets I present my other indicator on this link OBOS  
Qv2 MA
Joao Marcilio
QV2 MA is an indicator that displays the results of two smoothed moving averages applied to Candles. Item 01 - Buy signal: Candle show color Aqua when the 4-period smoothed moving average is expanding and above the 24-period smoothed moving average. Item 02 - Sell Signal: Candle show color HotPink color when a 4-period smoothed moving average is expanding and below the 24-period smoothed moving average. Item 03 - The gray candle is an undefined region. When the candle is gray, there are two rec
Qv2 Stdev
Joao Marcilio
Qv² Stdev is indicator developed based on standard deviation of prices and trading volume. Buy signals are indicated by arrows up. Sell signals are indicated by arrows down. An important detail is that the Qv² Volume has two bands, an upper and a lower, both of which serve as a target for take profit. It is recommended to use it in H1 Can be used in all pairs (I use in Gold). Good Business, in the trending market To find out some more about my work please click here
Qv2 Halifax
Joao Marcilio
The Qv² Halifax - Indicator developed through a complex series of calculations, which aims to easily identify buylng and selling signals. Buy signal are indicated by up arrows. Sell signal are indicated by down arrows. An important detail: In order to make the indicator work, the timeframes M1, M5. M15. M30, H1 D1 must be all updated. It can be used on all pairs (I use it on Gold). it is a very good deal in the trending market To learn more about my work click here
QV2 Histogram
Joao Marcilio
The Qv² Histogram - Indicator developed for traders with advanced experience. This indicator has two purposes: 1-) Identify price normality patterns (green color) 2-) Identify abnormal price patterns “outliers” (red color) ====================================================================================================================================== Interpretation for trades in start trend: Histogram (Green color) crossing the zero line upside - uptrend. Histogram (Green color) crossing th
Qv2 Trend MT5
Joao Marcilio
The Qv² Trend is an indicator that aims to identify trends. Buying trend signals are indicated by arrows pointing up. Selling trend signals are indicated by arrows pointing down. It can be used in all deadlines. It can be used in all pairs. I use it on the H1 with a period of 24. Important Recommendation: Make sure you trade in trend market. Good Trades, in trend market
필터:
리뷰 없음
리뷰 답변