Price Statistics MT5
- 지표
-
Miguel Antonio Rojas Martinez
 Mql language programmer.
I have automated various strategies to different customers in order to make operations easier when the Forex market operates - 버전: 1.1
- 업데이트됨: 17 11월 2021
- 활성화: 15
This indicator works only 5 digits Brokers.
It is impossible to talk about the study of the Forex market or any market without considering of that market statistics.
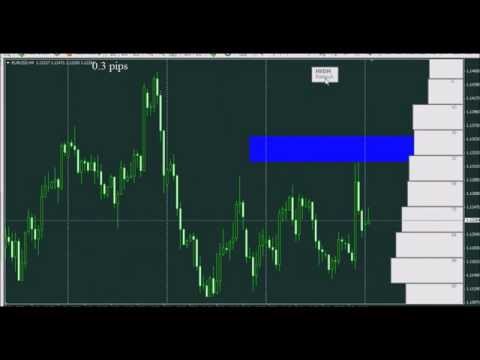
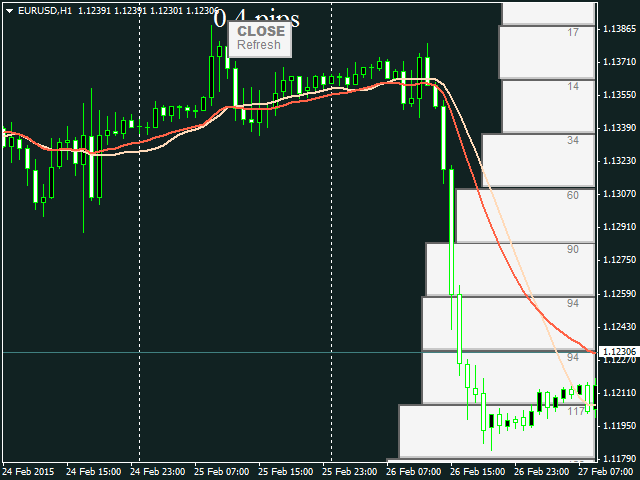
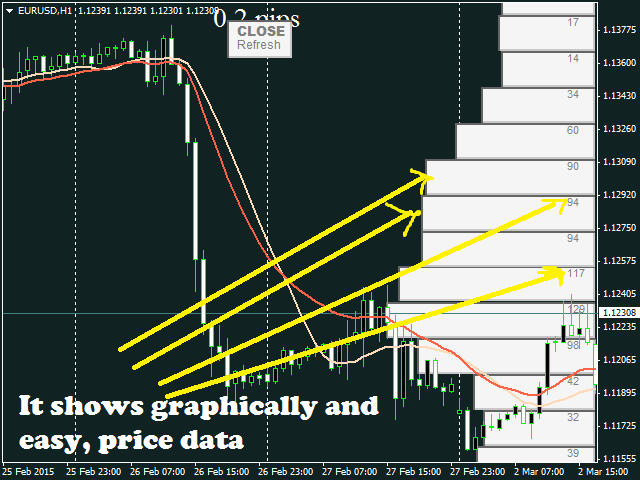
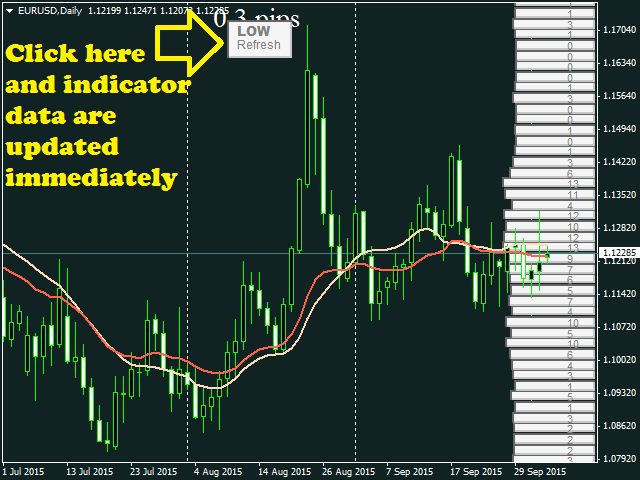
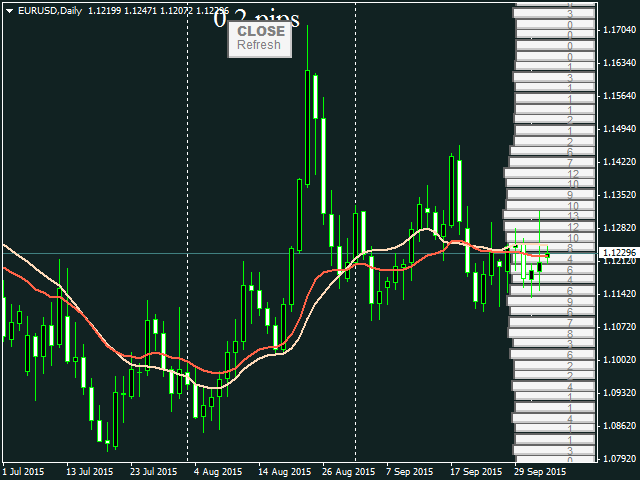
In this case, our indicator "price statistics" we have a new way to study our chart, giving information of the price in a range of pips you want to study for example, can we know how many times the price closes or opens into spaces 10, 20, 30, 50, 100 pips or more; and know them not only in numbers but also draws this relationship and makes the right side of our window of METATRADER 5 a graphic bar displays that information in an easy and immediate way to assimilate.
Although the information is updated with every tick, we can update it at any time after this loaded indicator in our graph, pressing the "refresh" button indicator.
We can select the number of candles that are going to study or simply to a very high number, select all the graphic candles.
It's a great tool for the study CORRECT market.
The price is very low, will go up without warning, so take advantage.
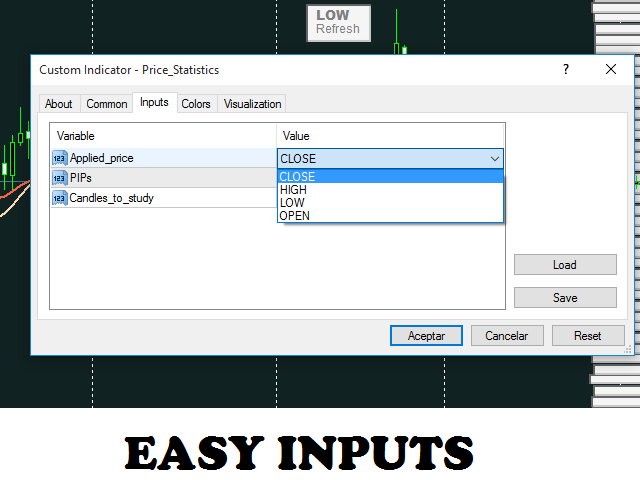
Inputs:
- Applied Price: This is the value we count, to show in the selected ranges Pips. We select "CLOSE" to count all the candles with closures that range of X pips, or we select "OPEN" to count all the candles opened in the range of X pips, or select "LOW" for the amount of times candles had a low price in a range of X pips, ETC
- PIPS: here you can select the amount of pips to draw the range (the width of each bar to the right). ideally a number greater than 20 pips to work on TF greater than 30 minutes.
- Candles_to_study: here we select the number of candles we want to process, we can study and get the statistics for all the candles (with a very high number) or the last 500, 1000, 1500, or any number of candles.
Watch video on the operation of the indicator