Multi TimeFrame Moving Average MT4
- 지표
-
Ahmed Alaaeldin Abdulrahman Ahmed Elherzawi
 Every day is a new opportunity. You can build on yesterday's success or put its failures behind and start over again. That's the way life is, with a new game every day, and that's the way baseball is.
 - 버전: 1.1
- 활성화: 5
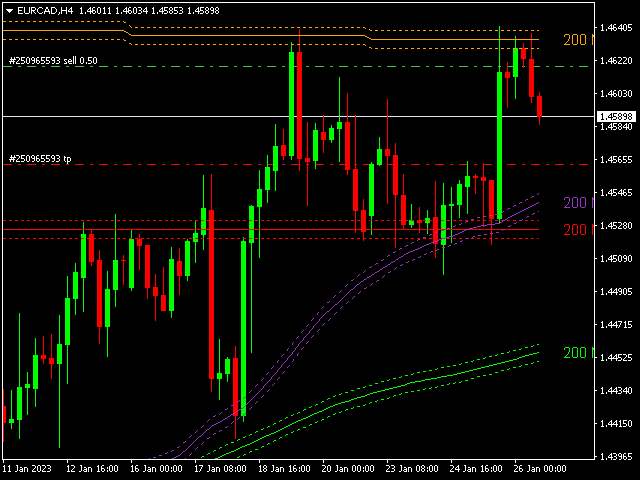
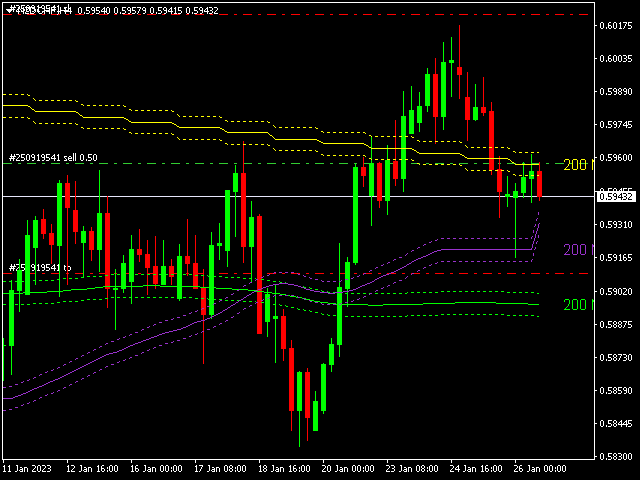
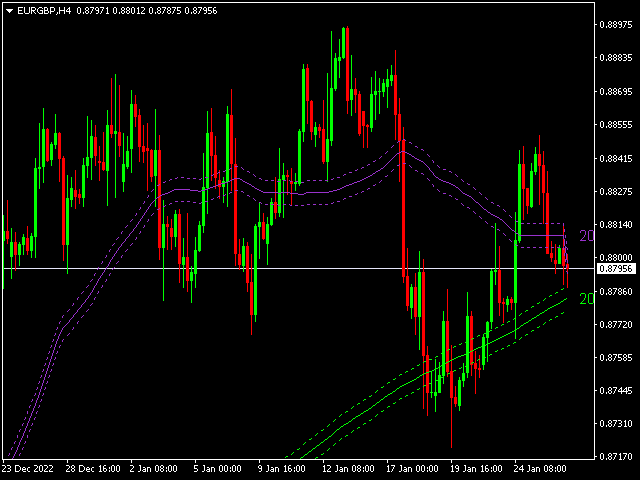
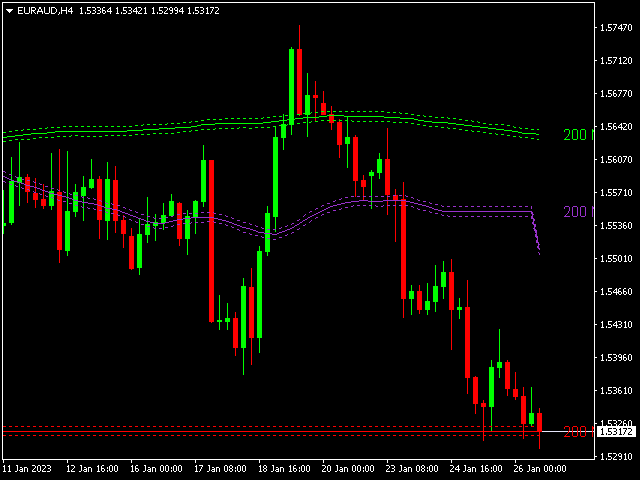
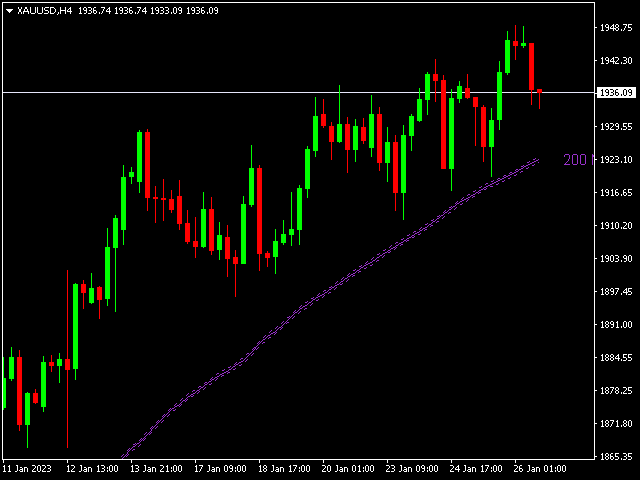
Investment Castle Multi-Timeframe Moving Average — Trends & Pullbacks, One Chart
Unlock the market with the Investment Castle Multi-Timeframe Moving Average. Identify trends and pullbacks across several timeframes on one convenient chart — a must-have for any serious trader who wants the bigger picture without switching charts.
What it does for you
- Multi-timeframe on one chart: see the moving-average picture across timeframes at a glance.
- Spot trends and pullbacks: know the direction and where price is pausing.
- Cleaner decisions: stop flipping between charts to confirm the trend.
- Works everywhere: any symbol, any timeframe.
Who it is for: trend and pullback traders who want multi-timeframe context.
Risk warning: trading involves substantial risk of loss. Always test on a demo account first and use risk settings you are comfortable with. Past performance does not guarantee future results.