Investment Castle RSI Divergence MT5
- 지표
-
Ahmed Alaaeldin Abdulrahman Ahmed Elherzawi
 Every day is a new opportunity. You can build on yesterday's success or put its failures behind and start over again. That's the way life is, with a new game every day, and that's the way baseball is.
 - 버전: 1.2
- 업데이트됨: 25 8월 2023
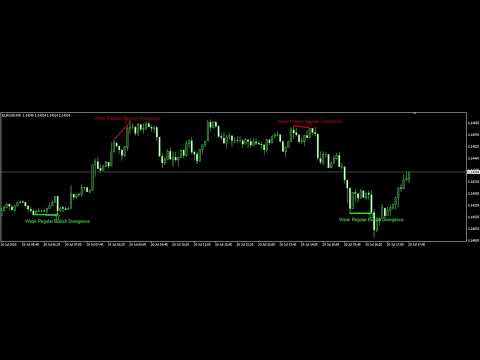
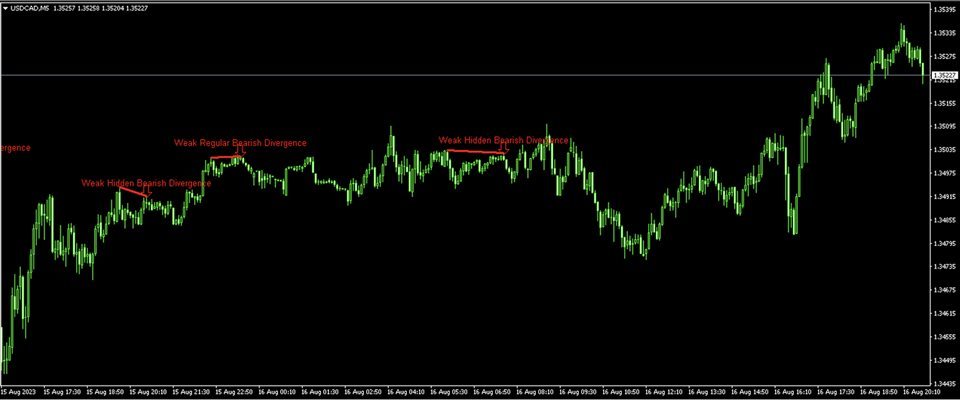
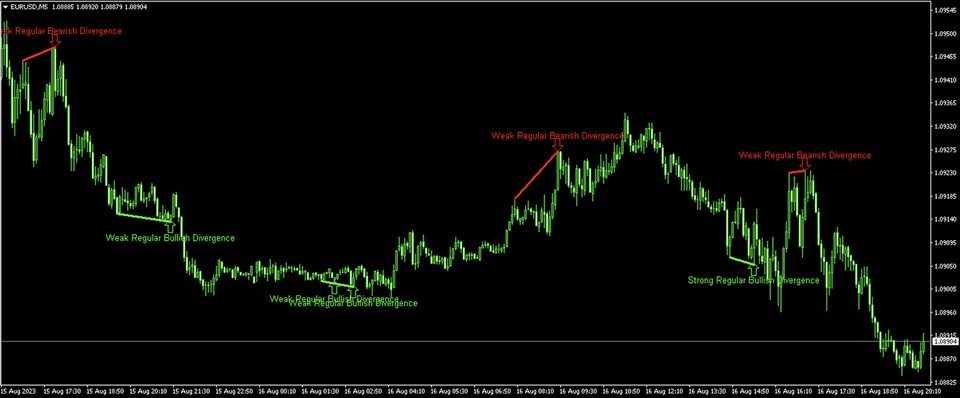
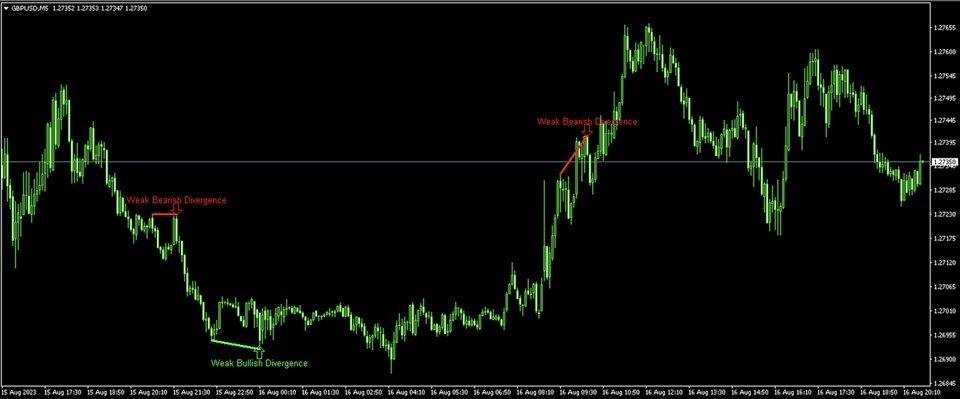
Investment Castle RSI Divergence — Catch the Turn Early
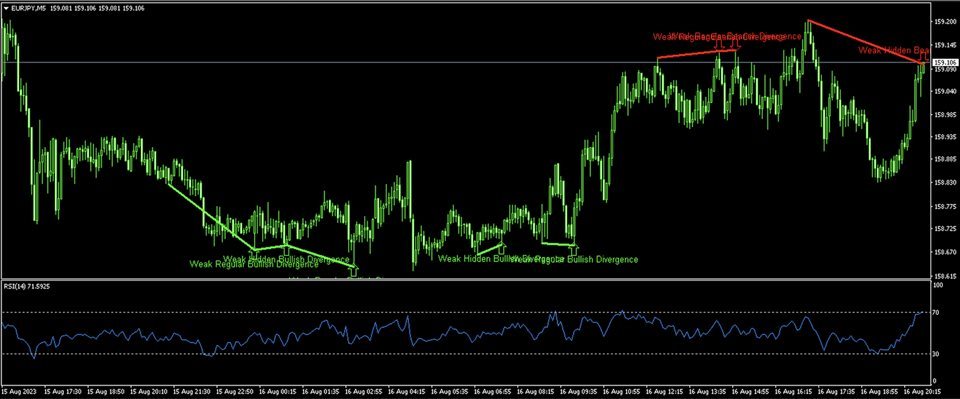
The RSI Divergence Indicator helps you spot potential reversals before they happen by detecting discrepancies between the RSI and price. Divergence is one of the most respected early signals of a trend change — from bullish to bearish or vice versa — now flagged for you automatically.
What it does for you
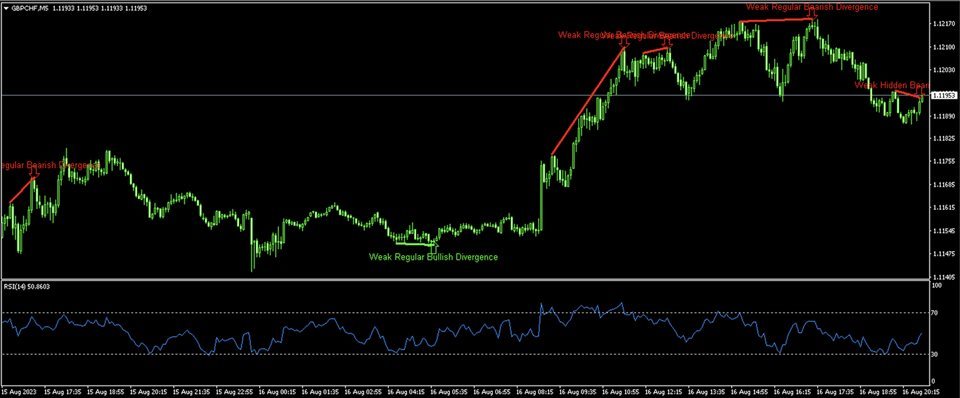
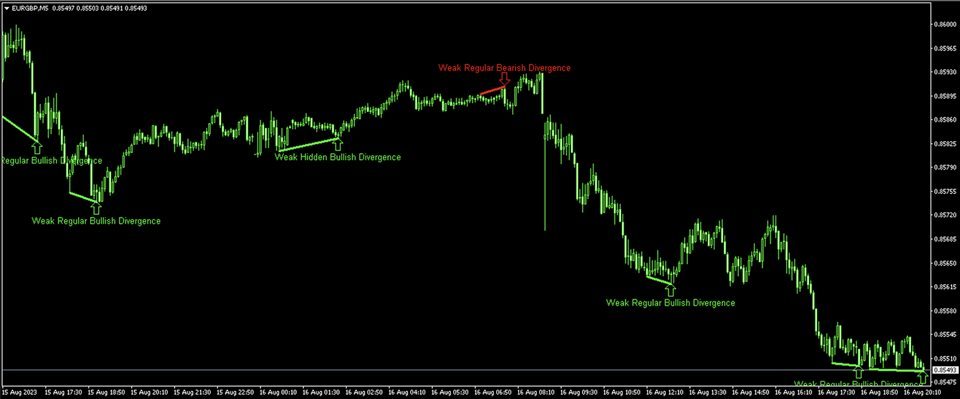
- Automatic divergence detection: bullish and bearish RSI/price divergences flagged on your chart.
- Earlier reads on reversals: see momentum shifts before price confirms them.
- Cleaner timing: no manual RSI comparison candle by candle.
- Works everywhere: any symbol, any timeframe.
Who it is for: traders who use momentum divergence to time entries and exits.
Risk warning: trading involves substantial risk of loss. Always test on a demo account first and use risk settings you are comfortable with. Past performance does not guarantee future results.

Excelente aporte con este indicador.....Gracias