Targets

5

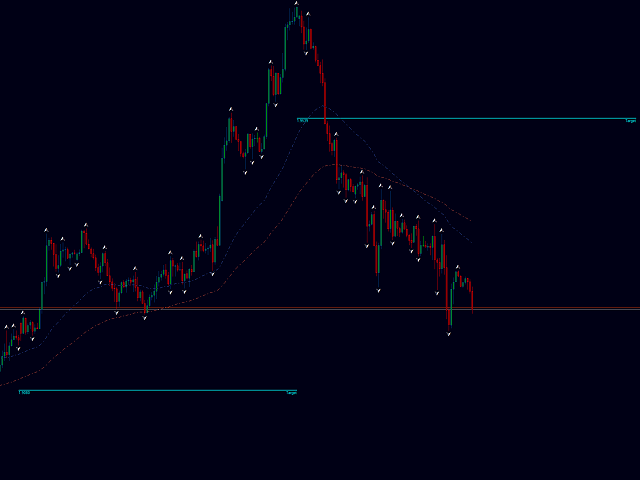
Targets is an indicator to determine potential turning points, targets are calculated to determine levels in which the sentiment of the market could change from "bullish" to "bearish."

This indicator can be used in any timeframe and any currency pair:

IN CASE YOU DON'T SEE THE INDICATOR WHEN YOU ADD IT TO YOUR CHARTS JUST OPEN THE INDICATOR MENU AND CLOSE THE MENU AGAIN

PLEASE TAKE NOTICE: For best results use this indicator as an extra tools after you have completed your regular analysis and use it for alerts based on such analysis.

리뷰 1
davevicens
336
davevicens 2023.10.30 19:15 
 

Great indicator. I use it all the time

추천 제품
Summary This indicator is based on RSI and Momentum indicators. It also considers moving averages of these two indicators. The three indicators have adjustable settings. The arrows do not repaint since the indicator only uses confirmed values and waits for the candle to close before painting an arrow. The indicator is also able to alert when arrows appear. There are 3 types of alerts - Popup, Email and Mobile Push Notifications. The arrows can be used in the EA and the inputs can also be optimiz
FREE
Hello Guys! I want to share with you a very useful tools. Anyone of us who has used MT4 for some time knows how impractical this platform can be for discretionary trading. That's why I created this graphical interface!  Interface is very simple, all the info that you need are in the video and in the screenshot. NB: Before to run the EA Interface, remember to copy the file in the comment in your MT4 folder "Controls". PATH: .../MQL4/INCLUDE/CONTROLS NB: unfortunately the interface can't be test
The Sentiment Ratio indicator gauges current Market Sentiment between -100% and 100%, where lower than -40% is considered Bearish and higher than 40% is Bullish. The channel between the two is considered Neutral. The indicator has been a very useful filter tool for signals within a trading system. Example call function:  int SentimentIndicator(double triggerLevel)//Return sentiment if trigger level is activated {   double sentimentRatio=iCustom(NULL,0,"Sentiment Ratio",0,0,0);   if(sentimentRat
FREE
MQLTrend
Mohammad Reza Aghaei
This tool helps you to control the situation at other times and include them in your trades when analyzing the market  This tool scans the market and reports the movement of the market at different times With the help of this tool, you can prevent many wrong analyzes With the help of this tool, you can have an overview of the market in the shortest time and save your time
FREE
Market Ticker
John Louis Fernando Diamante
The only Market Ticker on the market! Add a professional novelty to your workspace, with built in mini-charts A scrolling Market Ticker that displays price changes from all symbols in the Market Watch list. Provides an easy snapshot of symbol prices, and keeps scrolling automatically while you trade and analyse the chart. The ticker color (+/- price changes) are based on either the current or completed candle, and the previous candle. Options include: - MTF, eg choose to show price changes of
The 4 headed dragon is an indicator that has two functions. 1) Set the background trend. 2) Mark the predominant trend. By combining these two indicator signals, we will be able to trade for or against the trend, adapting the signals to your reading of the market. You can download the demo and test it yourself. 1) Set the background trend.   Define four possibilities of trend that are the four heads of the dragon, marked by colors on the indicator, marking a) Powerful buying trend. b) Weak
Smart Channels
Ivan Simonika
Smart Channel is a non-redrawing channel indicator based on moving averages. The indicator is used to identify trends in financial markets and indicates the direction of price movement. Smart Channel, in fact, is a miniature trading strategy, since, regardless of the construction methods, it uses the tactics of rebounding from the boundaries of the built channel, and the boundaries themselves are used as guidelines for the correct placement of stop loss and take profit orders. The key differe
Trend Monitor VZ
Sergey Ermolov
3.67 (3)
MT5 버전  | Valable ZigZag표시 |  FAQ 엘리엇 파동 이론은 가격 차트의 시각적 파동 모델을 기반으로 한 금융 시장의 프로세스에 대한 해석입니다. 이이론에 따르면 현재 시장에서 어떤 추세가 우세한지, 즉 상승 또는 하락 추세를 정확히 알 수 있습니다. Valable ZigZag 표시 기는 시장의 파동 구조를 보여줄 뿐만 아니라 현재 시간대에서 현재 주요 추세의 방향을 나타냅니다. 편의를 위해 Trend Monitor VZ 표시기는 거래하는 전체 통화 쌍 목록에 대한 모든 시간대의 추세 방향을 차트에표시합니다. 단일 차트에서 모든 상품에 대한 전반적인 시장 상황을 파악하여 올바른 거래 결정을 내릴 수 있습니다! Valable ZigZag 표시기는 매우 안정적이며 고전적인 지그재그처럼 방향을 자주 바꾸지 않아 트레이더에게 혼란을주지 않습니다. 이는 지표의 파동을 플로팅하기 위해 프랙탈을 사용하여 달성됩니다. Valable ZigZag 표시기는 무엇보다도 추세 표시기
Fibonacci Trend Marker
Grigoriy Malychenko
Fibonacci Trend Marker   — is a trend indicator that analyzes the behavior of the current candle relative to the High-Low (HL) range of previous candles using Fibonacci retracement levels. It visually tracks trend strength, signaling potential weakening or reversal through a change in candle color. Features: Designed for trend-focused traders, it helps quickly identify trend changes based on Fibonacci levels. Effective on any timeframe with sufficient market volatility, when a sequence of 3–5 c
Kill Zones MT4
Diego Arribas Lopez
MT5 Version Kill Zones Kill Zones allows you to insert up to 3 time zones in the chart. The visual representation of the Kill Zones in the chart together with an alert and notification system helps you to ignore fake trading setups occurring outside the Kill Zones or specific trading sessions. Using Kill Zones in your trading will help you filter higher probability trading setups. You should select time ranges where the market usually reacts with high volatility. Based on EST time zone, followin
Symbol Positions Panel MT4
Mariusz Franciszek Szczepanczyk
Positions Profit Monitor MT4 — Multi‑Symbol Open Positions & SL Dashboard The Positions Profit Monitor is an advanced, lightweight indicator for MT4 that displays real‑time profit/loss, position counts and SL counters for all open positions across selected instruments, directly on any chart. It reads positions from the entire MT4 account (not only the attached chart), works identically on live and demo accounts and is compatible with all MT4 brokers, including hedging and netting accounts.[1][
New version 1.22. Partagas    The AG algorithm is an element of a comprehensive trading system for trading a basket of currencies across 8 major currencies across all 28 currency pairs. The algorithm serves as a signal block for determining entry/exit from a position. To collect initial values, AG uses data from the CSS Currency Slope Strength cluster indicator. This indicator was not chosen by chance - it performed very well during testing of the algorithm. A. AG determines the width of the e
FREE
Rectangle Trading Custom   is a powerful technical analysis tool designed for price action and range-based traders. It allows users to define consolidation zones and receive alerts when the price breaks out of these zones or approaches trendlines drawn on the chart. Rectangles and Trendlines will be extended into future with one click. Rectangle point size, name and prices will be displayed around rectangle. Key Features: Draw Trading Zones (Rectangle Zones) Users can manually draw rectangles t
PDP indicator is used for: defining price probability distributions. This allows for a detailed representation of the channel and its borders and forecast the probability of a price appearing at each segment of its fluctuations; defining the channel change moment. Operation principles and features PDP analyzes a quote history on lower timeframes and calculates a price probability distribution on higher ones. Forecast algorithms allow the indicator to calculate probability distributions and mov
Adaptive Trend Line is not an ordinary moving average. It is an intelligent trend line that changes color based on the internal strength of the market, as measured by the RSI. How does it work? It combines the smoothness of an Exponential Moving Average (EMA) with the sensitivity of the RSI. - Green Line: The RSI is above 55, indicating that buyers are in control. - Red Line: The RSI is below 45, indicating that sellers are in control. - Gray Line: The RSI is in the neutral zone (45-55), indic
Graphic shapes
Alexandr Lapin
5 (1)
Graphic Shapes -using history, it projects four types of graphical shapes at the moment, allowing you to determine the main ranges of price movement in the future, as well as gives an understanding of the main market reversals, while giving entry points by priority!The panel contains three types of figure sizes expressed by timeframes. They allow you to conduct a complete market analysis without using additional tools! The indicator is a powerful tool for forecasting price movements in the forex
FREE
Golden Scalper PRO
Felipe Jose Costa Pereira
3.83 (12)
Golden Scalper PRO: 우리의 기술이 당신과 함께합니다! 매뉴얼 및 설정 파일: 구매 후 매뉴얼과 설정 파일을 받으려면 저에게 연락하십시오. 가격: 판매된 라이선스 수에 따라 가격이 상승합니다. 남은 복사본 수: 3 금 거래는 금융 시장에서 가장 변동성이 큰 자산 중 하나로, 높은 정확도, 신중한 분석 및 매우 효과적인 위험 관리가 필요합니다. Golden Scalper PRO 는 이러한 요소들을 통합한 견고하고 정교한 시스템으로 개발되었습니다. 첨단 기술과 고급 전략을 사용하여 초보자부터 전문가까지 안전하게 도전하고 기회를 활용할 수 있도록 지원합니다. Golden Scalper는 적응형 인텔리전스, 다중 타임프레임 분석, 자동 거래 조정 및 엄격한 위험 관리를 결합하여 시장 변화에 신속하게 대응하며 장기적으로 자본을 보호합니다. 심볼 XAUUSD (골드) 시간 단위 M5 자본금 최소 500달러 브로커 모든 브로커 가능 계좌 유형 모든 유형, 스프레드가 낮은 계좌
RangeChannel
Andriy Sydoruk
Indicator RangeChannel (RC) or, band channel indicator. The use of the indicator allows the trader to react in time for the price to go beyond the limits of the channel established for it. This corridor is built on the basis of the analysis of several candles, starting from the last one, as a result of which the extremes of the investigated interval are determined. They create the lines of the channel. A sell signal occurs when the price touches the lower border and, conversely, the contact wit
BB Sub
Etsushi Ishizuka
BB-Sub – 서브윈도우 볼린저 밴드 표시 BB-Sub 는 차트의 서브윈도우(보조창)에 볼린저 밴드를 독립적으로 표시할 수 있는 간단하면서도 강력한 인디케이터입니다. 일반적인 볼린저 밴드는 메인 차트에 겹쳐 표시되지만, BB-Sub는 별도의 보조창에서 작동하여 캔들스틱이나 다른 인디케이터와 겹치지 않습니다. 밴드의 움직임과 형태 변화에 집중해 분석하고 싶은 트레이더에게 이상적입니다. 주요 특징 상단 밴드, 하단 밴드, 중간 밴드(SMA)를 보조창에 동시에 표시 기본값은 20기간, ±2σ이지만, 기간과 밴드폭(편차)은 파라미터로 자유롭게 조정 가능 계산에 사용할 가격 종류(종가, 시가, 고가, 저가, 중앙값, 대표값, 가중평균)를 선택할 수 있어 다양한 전략에 맞춰 최적화 가능 다른 인디케이터와의 비교/조합이나 여러 보조창을 활용한 멀티타임프레임 분석 지원 가벼운 설계로 긴 기간 데이터나 여러 인디케이터 사용 시에도 차트가 느려지지 않음 보조창 높이를 조정하여 밴드의 확장/수축 및
FREE
PowerXXX
Marco Fornero Monia
PowerXXX measures the power of the current candlestick and displays it in numerical format and colors. The indicator can cover multiple timeframes and can be placed on the main chart or on the charts of the underlying indicators. The number of timeframes is selectable, as well as the color levels according to the power expressed. In the latest version, the power can be expressed as a function of the opening of the candle itself or as a function of the opening of the total candles before. There
Trend Analysis in act
Ihab Mohamed Kamal Fouda
The Trend Analysis Indicator is an innovative tool designed for traders and investors who seek to navigate the complexities of the financial markets with greater precision and insight. This powerful indicator is engineered to adeptly identify whether a market is trending or not, offering users a vital edge in their trading strategy. Key Features: Accurate Trend Detection : The core functionality of the Trend Analysis Indicator lies in its ability to accurately detect market trends. It analyzes p
Multi Timeframe Buy and Sell Power MT4 The Multi Timeframe Buy and Sell Power indicator for MetaTrader 4 is a versatile tool designed to provide traders with a clear visual representation of market pressure across nine standard timeframes, from M1 to MN1. By aggregating buy and sell strength percentages derived from recent price action and tick volume, it helps identify potential trends, reversals, and neutral conditions in real-time. The indicator displays this information in a compact dashbo
FREE
Beautiful
Tatiana Savkevych
The Beautiful indicator shows potential market reversal points. The intelligent algorithm of the indicator detects the trend well, filters out market noise and generates input signals and exit levels. Uses just one parameter for settings. Simple, visual and efficient trend detection. The indicator does not redraw and does not lag. You can set up message alerts as sound or email. Works on all currency pairs and on all timeframes. Ready-made trading system.
Inside Candle EA
Hong Ling Mu
1 (1)
Based on my original trading strategy, it appears that this EA is programmed to use technical analysis to identify an inside candle pattern in the current candle and wait for a breakout in either direction. If the price breaks out higher, the EA will place a buy order, and if it breaks out lower, the EA will place a sell order. The take profit and stop loss levels are set at 50 pips each. Additionally, using a martingale strategy, which involves increasing the lot size after a losing trade, ca
FREE
Trend and Lines
Oliver Hinrichs
This indicator draws lines at the open, close, high and low price of the last chart candle from the set timeframe. In addition, a label shows whether it was an up or down candle. The standard settings follow the original idea of ​​getting the price data from the daily timeframe for day trading/scalping, but since this indicator is fully customizable, you can also set a different timeframe. Based on the drawn price lines, you can then also display Fibonacci levels. This function can also be
MQL Trendline EA
Martin Eshleman
3 (2)
Summary This EA will trade semi-automatically based on trend lines or horizontal lines that are manually plotted on the chart by the user. It can handle any number of lines per chart and each line can have its own adjustable settings. This EA manages every line separately based on specific user 'keywords' set for each line. Since each line has it's own independent settings, this is why there are very few shared inputs in this EA. Doing it this way allows for a single EA to manage many lines and
FREE
Introduction This indicator detects volume spread patterns for buy and sell opportunity. The patterns include demand and supply patterns. You might use each pattern for trading. However, these patterns are best used to detect the demand zone (=accumulation area) and supply zone (=distribution area). Demand pattern indicates generally potential buying opportunity. Supply pattern indicates generally potential selling opportunity. These are the underlying patterns rather than direct price action. T
XFlow4
Maxim Kuznetsov
XFlow shows an expanding price channel that helps determine the trend and the moments of its reversal. It is also used when accompanying transactions to set take profit/stop loss and averages. It has practically no parameters and is very easy to use - just specify an important moment in the history for you and the indicator will calculate the price channel. DISPLAYED LINES ROTATE - a thick solid line. The center of the general price rotation. The price makes wide cyclical movements around the
XFibo Auto Fibonacci
Welinton Dos Reis Goncalves
5 (1)
Use with disciplined risk management. Fibonacci entry system based on the golden zone 38.2 - 61.8 where the entry is confirmed at 23.6 with indications of Take Profit 3:1. Automatically plotted Fibonacci contains retracement and expansion Fibonacci in a single indicator. Up to 77% win rate with this system. FTMO challenge pass with 0.50% risk and 1.50% R:R.
GO Trend MultiTimeFrame
Martin Alejandro Bamonte
GoTrend Multi-Timeframe 지표 "GoTrend Multi-Timeframe" 지표는 여러 시간 프레임에서 통화쌍의 전체 및 특정 추세를 빠르고 효율적으로 평가하려는 트레이더에게 필수적인 도구입니다. 이 지표는 트레이더가 시장 방향에 대한 명확하고 포괄적인 시각을 한눈에 얻을 수 있도록 하여 의사 결정을 최적화하고 거래 전략의 효과를 높일 수 있습니다. 주요 특징: 다중 시간 프레임 분석: 이 지표는 M5, M15, M30, H1, H4 및 D1의 여섯 가지 다른 시간 프레임에 대한 포괄적인 분석을 제공하여 트레이더가 각 기간의 추세를 이해할 수 있도록 합니다. 통합 기술 지표: 이 지표는 RSI, SAR, MA, MACD 및 ADX의 다섯 가지 강력한 기술 지표를 사용하여 각 시간 프레임에서 추세 방향을 결정합니다. 명확하고 직관적인 시각화: 신호는 직관적인 기호와 색상으로 메인 차트의 원하는 코너에 표시됩니다. 이를 통해 트레이더는 시장 상황을 한눈에 평가할 수
이 제품의 구매자들이 또한 구매함
Gann Made Easy
Oleg Rodin
4.83 (150)
Gann Made Easy 는 mr.의 이론을 사용하여 최고의 거래 원칙을 기반으로 하는 전문적이고 사용하기 쉬운 Forex 거래 시스템입니다. W.D. 간. 이 표시기는 Stop Loss 및 Take Profit Levels를 포함하여 정확한 BUY 및 SELL 신호를 제공합니다. PUSH 알림을 사용하여 이동 중에도 거래할 수 있습니다. 거래 팁, 보너스, GANN MADE EA를 무료로 받으시려면 구매 후 저에게 연락주세요! 아마도 Gann 거래 방법에 대해 이미 여러 번 들었을 것입니다. 일반적으로 Gann의 이론은 초보자 거래자뿐만 아니라 이미 거래 경험이 있는 사람들에게도 매우 복잡한 것입니다. Gann의 거래 방식은 이론적으로 적용하기 쉽지 않기 때문입니다. 나는 그 지식을 연마하고 Forex 지표에 최고의 원칙을 적용하기 위해 몇 년을 보냈습니다. 표시기는 적용하기가 매우 쉽습니다. 차트에 첨부하고 간단한 거래 권장 사항을 따르기만 하면 됩니다. 지표는 지속적으로 시장
Smc Blast Signal
Mohit Dhariwal
4.75 (4)
NEW YEAR 2026 SALE OFFER PRICE AT JUST 80 DOLLARS FEW COPIES ONLY AT This price From 5th Jan -10th Jan MIDNIGHT Final offer GRAB YOUR COPY ON THIS New Year EVE Prices will be increased to 150 after the offer period ends Full Fledged EA and Alert plus for alerts will also be provided in this offer along with the purchase of Indicator. Limited copies only at this price and Ea too. Grab your copy soon Alert plus for indicator with set file is kept in comment section with the image  SMC Blast Signa
현재 20% 할인 ! 초보자 또는 전문가 트레이더를 위한 최고의 솔루션! 이 대시보드 소프트웨어는 28개의 통화 쌍에서 작동합니다. 2가지 주요 지표(Advanced Currency Strength 28 및 Advanced Currency Impulse)를 기반으로 합니다. 전체 Forex 시장에 대한 훌륭한 개요를 제공합니다. 고급 통화 강도 값, 통화 이동 속도 및 모든(9) 시간대의 28 Forex 쌍에 대한 신호를 보여줍니다. 추세 및/또는 스캘핑 기회를 정확히 파악하기 위해 차트의 단일 지표를 사용하여 전체 시장을 볼 수 있을 때 거래가 어떻게 개선될지 상상해 보십시오! 잠재적인 거래를 식별하고 확인하면서 강력한 통화와 약한 통화를 더욱 쉽게 식별할 수 있도록 이 지표에 기능을 내장했습니다. 이 표시기는 통화의 강세 또는 약세가 증가 또는 감소하는지 여부와 모든 시간대에서 수행되는 방식을 그래픽으로 보여줍니다. 추가된 새로운 기능은 현재 시장 조건 변화에 적응하는
Scalper Inside PRO
Alexey Minkov
4.74 (69)
An exclusive indicator that utilizes an innovative algorithm to swiftly and accurately determine the market trend. The indicator automatically calculates opening, closing, and profit levels, providing detailed trading statistics. With these features, you can choose the most appropriate trading instrument for the current market conditions. Additionally, you can easily integrate your own arrow indicators into Scalper Inside Pro to quickly evaluate their statistics and profitability. Scalper Inside
F-16 비행기 지표를 소개합니다. 이것은 귀하의 거래 경험을 혁신하도록 설계된 최첨단 MT4 도구입니다. F-16 전투기의 비할 데 없는 속도와 정밀성에 영감을 받아이 지표는 고급 알고리즘과 최첨단 기술을 결합하여 금융 시장에서 압도적인 성능을 제공합니다. F-16 비행기 지표를 사용하면 실시간 분석을 제공하고 매우 정확한 거래 신호를 생성하여 경쟁을 앞서갈 수 있습니다. 다양한 자산 클래스에서 수익 기회를 식별하는 데 필요한 동적 기능을 갖추고 있어 확신을 가지고 정보에 근거한 결정을 내릴 수 있습니다. 사용자 친화적인 인터페이스로 구성된 F-16 비행기 지표는 인기있는 MetaTrader 4 플랫폼과 완벽하게 통합되어 원활하고 효율적인 거래 과정을 보장합니다. 초보자 트레이더든 경험 많은 전문가든 이 지표를 쉽게 사용자 정의하여 고유한 거래 스타일과 선호도에 맞출 수 있습니다. F-16 비행기 지표의 강력함을 경험해 보세요. 이 지표는 시장 트렌드를 정확하고 민첩하게 탐색하며
Game Changer Indicator
Vasiliy Strukov
4.67 (9)
Game Changer는 모든 금융 상품에 사용하도록 설계된 혁신적인 추세 지표로, 메타트레이더를 강력한 추세 분석기로 탈바꿈시켜 줍니다. 이 지표는 재작성이나 지연 현상이 발생하지 않습니다. 모든 시간대에서 작동하며 추세 파악을 지원하고, 잠재적 반전 신호를 제공하며, 트레일링 스톱 메커니즘으로 활용되고, 신속한 시장 반응을 위한 실시간 알림을 제공합니다. 숙련된 투자자, 전문가, 또는 우위를 점하려는 초보자 등 누구나 이 도구를 통해 자신감과 원칙을 바탕으로, 그리고 근본적인 추세 역학에 대한 명확한 이해를 바탕으로 거래할 수 있습니다. 구매 후 바로 연락 주시면 개인 보너스를 드립니다! 강력한 지지선과 추세 스캐너 지표를 무료로 받으실 수 있습니다. 개인 메시지로 알려주세요 저는 텔레그램에서 EA나 특별 세트를 판매하지 않습니다. Mql5에서만 사용 가능하며, 세트 파일은 제 블로그에서만 볼 수 있습니다 . 사기꾼을 조심하시고 다른 사람에게서 세트를 구매하지 마세요 설정 추세
M1 Sniper
Oleg Rodin
4.89 (18)
M1 SNIPER 는 사용하기 쉬운 거래 지표 시스템입니다. M1 시간대에 맞춰 설계된 화살표 지표입니다. 이 지표는 M1 시간대 스캘핑을 위한 단독 시스템으로 사용할 수 있으며, 기존 거래 시스템의 일부로도 사용할 수 있습니다. 이 거래 시스템은 M1 시간대 거래용으로 특별히 설계되었지만, 다른 시간대에도 사용할 수 있습니다. 원래는 XAUUSD와 BTCUSD 거래를 위해 이 방법을 설계했지만, 다른 시장 거래에도 유용하다는 것을 알게 되었습니다. 이 지표의 신호는 추세 방향과 반대로 거래될 수 있습니다. 저는 지표의 신호를 활용하여 양방향으로 거래할 수 있도록 돕는 특별한 거래 기법을 알려드립니다. 이 방법은 특별한 동적 지지선과 저항선 가격 영역을 활용하는 것을 기반으로 합니다. 구매하시면 M1 SNIPER 화살표 지표를 바로 다운로드하실 수 있습니다. 또한, 아래 스크린샷에 표시된 Apollo Dynamic SR 지표는 M1 SNIPER 도구를 사용하는 모든 사용자에게 무료로
Dynamic Forex28 Navigator
Bernhard Schweigert
4.43 (7)
Dynamic Forex28 Navigator - 차세대 외환 거래 도구. 현재 49% 할인. Dynamic Forex28 Navigator는 오랫동안 인기 있는 지표의 진화형으로, 세 가지의 힘을 하나로 결합했습니다. 고급 통화 Strength28 지표(695개 리뷰) + 고급 통화 IMPULSE with ALERT(520개 리뷰) + CS28 콤보 신호(보너스). 지표에 대한 자세한 정보 https://www.mql5.com/en/blogs/post/758844 차세대 Strength 지표는 무엇을 제공합니까?  원래 지표에서 좋아했던 모든 것이 새로운 기능과 더 높은 정확도로 강화되었습니다. 주요 기능: 독점적인 통화 Strength 공식.  모든 시간대에 걸쳐 부드럽고 정확한 강도선. 추세와 정확한 진입을 식별하는 데 이상적입니다. 역동적인 시장 피보나치 수준(시장 피보나치).  이 지표에만 있는 고유한 기능. 가격 차트가 아닌 통화 강도에 피보나치가 적용됩니다.
Katana Scalper Pro
Yuki Miyake
5 (3)
Special Launch Offer: Available at a limited-time price to celebrate the new release. [Concept: Cutting Through the Noise] In a market filled with chaotic movements and lagging indicators, clarity is the ultimate weapon. KATANA Scalper is engineered with a singular philosophy: to cut through market noise like a precision blade. By filtering out non-essential fluctuations, it reveals the pure "Momentum Structure" hidden within the price action, allowing you to execute with surgical precision. 5
Trend indicator AI
Ramil Minniakhmetov
4.95 (76)
트렌드 인공 지능 지표는 실행 가능한 진입 점 및 반전 경고와 추세 식별을 결합하여 상인의 시장 분석을 향상시킬 훌륭한 도구입니다. 이 표시기는 사용자가 자신감과 정밀도로 외환 시장의 복잡성을 탐색 할 수 있도록 지원합니다 기본 신호 외에도 트렌드 인공 지능 지표는 풀백 또는 되돌림 중에 발생하는 2 차 진입 점을 식별하여 거래자가 기존 트렌드 내에서 가격 수정을 활용할 수 있도록합니다. 중요한 장점: ·작동 4 및 5 *명확한 구매 또는 판매 신호 *다시 칠하지 않습니다 *모든 자산에서 작동 나는 전보 사기에 개 또는 세트를 판매하지 않도록주의. 모든 설정은 블로그에 여기에 무료.  중요! 지침 및 보너스를 얻기 위해 구입 후 즉시 저에게 연락! 진짜 가동 감시는 뿐 아니라 나의 다른 제품 여기에서 찾아낼 수 있습니다: https://www.mql5.com/en/users/mechanic/seller&nbsp ; 설정 및 입력: 모든 자산에 대해 기본 설정을 권
RFI levels PRO
Roman Podpora
사전 지표       시장 반전 수준과 영역을 파악하여   가격이 해당 수준으로 되돌아올 때까지 기다렸다가 새로운 추세의 시작점에서 진입할 수 있도록 해줍니다. 즉, 추세의 끝에서 진입하는 것이 아닙니다. 그는 보여준다       반전 수준       시장이 방향 전환을 확인하고 추가적인 움직임을 형성하는 지점입니다. 이 지표는 차트를 다시 그릴 필요 없이 작동하며, 모든 금융 상품에 최적화되어 있고, 특정 금융 상품과 함께 사용할 때 최대의 잠재력을 발휘합니다.       트렌드 라인즈 프로       지시자. 모든 계측기에 적용 가능한 가역 구조 스캐너 모든 거래 상품을 자동으로 추적하고 모든 R-반전 패턴을 즉시 식별하여 LOGIC AI 신호가 이미 존재하는 위치와 기타 유용한 정보를 표시합니다. 로직 AI – 진입점을 표시해주는 도우미 시장 진입에 가장 적합한 시점을 판단하는 지능형 신호입니다. TPSproSYSTEM 알고리즘을 사용하여 가격 변동, 추세 및 주요 시장 참
Advanced Currency Strength28 Indicator
Bernhard Schweigert
4.91 (657)
현재 26% 할인 초보자 또는 전문가 트레이더를 위한 최고의 솔루션! 이 지표는 우리가 독점 기능과 새로운 공식을 통합했기 때문에 독특하고 고품질이며 저렴한 거래 도구입니다. 단 하나의 차트로 28 Forex 쌍의 통화 강도를 읽을 수 있습니다! 새로운 추세 또는 스캘핑 기회의 정확한 트리거 포인트를 정확히 찾아낼 수 있기 때문에 거래가 어떻게 개선될지 상상해 보십시오. 사용 설명서: 여기를 클릭  https://www.mql5.com/en/blogs/post/697384 그것이 첫 번째, 원본입니다! 쓸모없는 지망생 클론을 사지 마십시오. 더 스페셜  강력한 통화 모멘텀을 보여주는 하위 창의 화살표 GAP가 거래를 안내합니다! 기본 또는 호가 통화가 과매도/과매도 영역(외부 시장 피보나치 수준)에 있을 때 개별 차트의 기본 창에 경고 표시가 나타납니다. 통화 강도가 외부 범위에서 떨어질 때 풀백/반전 경고. 교차 패턴의 특별 경고 추세를 빠르게 볼 수 있는 다중 시간
Hidden Cycles
Lev Vladimirovic Marushkin
5 (1)
Christmas Sale! – The Only 100% Universal Tool Grab Hidden Cycles for only $129 (regular price $179). Stop trading against nature! This is your chance to secure the only indicator rooted in the absolute laws that govern the entire universe. Most tools guess—this one reveals the truth. Offer ends soon — Buy another toy or buy the truth. Your choice... Based on Universal Laws — NOT Some Guy’s Algorithm: Let the market adjust to the Hidden Cycles Geometry — not the other way around. Most indicat
M1 Arrow
Oleg Rodin
5 (19)
시장의 두 가지 기본 원칙에 기반한 일중 전략. 알고리즘은 추가 필터를 사용하여 거래량 및 가격 파동 분석을 기반으로 합니다. 지표의 지능형 알고리즘은 두 가지 시장 요인이 하나로 결합될 때만 신호를 제공합니다. 지표는 더 높은 시간 프레임의 데이터를 사용하여 M1 차트에서 특정 범위의 파도를 계산합니다. 그리고 파동을 확인하기 위해 지표는 볼륨 분석을 사용합니다. 이 표시기는 준비된 거래 시스템입니다. 트레이더가 필요로 하는 모든 것은 신호를 따르는 것입니다. 또한 지표는 자신의 거래 시스템의 기초가 될 수 있습니다. 거래는 분 차트에서만 수행됩니다. 지표가 MTF 원리를 사용한다는 사실에도 불구하고 지표 알고리즘은 가능한 한 안정적입니다. 구매 후 반드시 저에게 편지를 보내주세요! 내 거래 설정 및 권장 사항을 공유하겠습니다!
Volatility Trend System - a trading system that gives signals for entries. The volatility system gives linear and point signals in the direction of the trend, as well as signals to exit it, without redrawing and delays. The trend indicator monitors the direction of the medium-term trend, shows the direction and its change. The signal indicator is based on changes in volatility and shows market entries. The indicator is equipped with several types of alerts. Can be applied to various trading ins
BlueDigitsFx Easy 1 2 3 System
Ziggy Janssen
4.87 (299)
MT5 버전은 여기에서 이용 가능합니다: https://www.mql5.com/en/market/product/50048 텔레그램 채널 & 그룹: https://t.me/bluedigitsfx V.I.P 그룹 접속: 유료 제품 구매 증빙을 메시지로 보내주세요 추천 브로커: https://bit.ly/BlueDigitsFxStarTrader BlueDigitsFx Easy 123 System — MT4용 강력한 반전 및 돌파 감지 시스템 초보자와 전문가 모두를 위한, 시장 구조 변화, 돌파 및 추세 반전을 쉽고 명확하게 감지할 수 있는 올인원 논리 재도색 방지(Non-Repaint) 인디케이터입니다. 이 인디케이터는 "123" 패턴을 따릅니다: 1단계: 잠재적 과매수/과매도 지점에서 큰 화살표로 새로운 고점 또는 저점을 식별 2단계: 구조가 깨졌음을 신호로 보내 추세 반전 가능성을 확인 3단계: 작은 화살표와 지지/저항 점으로 진입 신호를 확정 참고: 큰 화살표는 봉이 종료될
Quantum Breakout Indicator PRO
Bogdan Ion Puscasu
4.96 (26)
소개       Quantum Breakout PRO   , 브레이크아웃 존 거래 방식을 변화시키는 획기적인 MQL5 지표! 13년 이상의 거래 경험을 가진 숙련된 트레이더 팀이 개발한   Quantum Breakout PRO는   혁신적이고 역동적인 브레이크아웃 영역 전략으로 거래 여정을 새로운 차원으로 끌어올리도록 설계되었습니다. Quantum Breakout Indicator는 5개의 이익 목표 영역이 있는 브레이크아웃 영역의 신호 화살표와 브레이크아웃 상자를 기반으로 한 손절 제안을 제공합니다. 초보자 거래자와 전문 거래자 모두에게 적합합니다. Quantum EA 채널:       여기를 클릭하세요 MT5 버전 :   여기를 클릭하세요 중요한! 구매 후 설치 매뉴얼을 받으려면 개인 메시지를 보내주십시오. 추천: 기간: M15 통화쌍: GBPJPY, EURJPY, USDJPY,NZDUSD, XAUUSD 계정 유형: 스프레드가 매우 낮은 ECN, Raw 또는 Razo
Entry Points Pro
Yury Orlov
4.62 (172)
다시 색을 칠하지 않고 거래에 진입할 수 있는 정확한 신호를 제공하는 MT4용 지표입니다. 외환, 암호화폐, 금속, 주식, 지수 등 모든 금융 자산에 적용할 수 있습니다. 매우 정확한 추정값을 제공하고 매수와 매도의 가장 좋은 시점을 알려줍니다. 하나의 시그널로 수익을 내는 지표의 예와 함께 비디오 (6:22)시청하십시오! 대부분의 거래자는 Entry Points Pro 지표의 도움으로 첫 거래 주 동안 트레이딩 결과를 개선합니다. 저희의   Telegram Group 을 구독하세요! Entry Points Pro 지표의 좋은점. 재도색이 없는 진입 신호 신호가 나타나고 확인되면(시그널 캔들이 완성된 경우) 신호는 더 이상 사라지지 않습니다. 여타 보조지표의 경우 신호를 표시한 다음 제거되기 때문에 큰 재정적 손실로 이어집니다. 오류 없는 거래 게시 알고리즘을 통해 트레이드(진입 또는 청산)를 할 이상적인 순간을 찾을 수 있으며, 이를 통해 이를 사용하는 모든 거래자의 성공률이
Trend Lines PRO
Roman Podpora
5 (1)
트렌드 라인즈 프로       이 지표는 시장이 실제로 어떤 방향으로 전환되는지 파악하는 데 도움이 됩니다. 실제 추세 반전 지점과 주요 시장 참여자들이 다시 진입하는 지점을 보여줍니다. 보시다시피       BOS 라인       복잡한 설정이나 불필요한 노이즈 없이 더 높은 시간대의 추세 변화와 주요 레벨을 확인할 수 있습니다. 신호는 차트에 다시 그려지지 않고 캔들이 마감된 후에도 계속 표시됩니다. 지표가 보여주는 내용: 실제 변화       추세(BOS 라인) 한 번 신호가 나타나면 그 신호는 계속 유효합니다! 이는 신호를 발생시킨 후 변경될 수 있는 리페인팅 방식의 지표와 중요한 차이점입니다. 리페인팅 방식의 지표는 잠재적으로 자금 손실로 이어질 수 있습니다. 이제 더욱 높은 확률과 정확도로 시장에 진입할 수 있습니다. 또한 화살표가 나타난 후 목표가(익절)에 도달하거나 반전 신호가 나타날 때까지 캔들스틱 색상이 계속 바뀌는 기능도 있습니다. 반복 항목          
Meravith
Ivan Stefanov
5 (1)
이 인디케이터는 각 지점에서 볼륨을 분석하고 해당 볼륨에 대한 시장의 피로 레벨을 계산합니다. 이 인디케이터는 세 개의 라인으로 구성됩니다: 강세 볼륨 피로 라인 약세 볼륨 피로 라인 시장 추세를 나타내는 라인. 이 라인은 시장이 강세인지 약세인지에 따라 색이 변합니다. 원하는 시작 지점에서 시장을 분석할 수 있습니다. 볼륨 피로 라인에 도달하면 다음 분석을 시작할 새 지점을 식별하세요. 트렌드와 수정 모두 분석할 수 있습니다. 좋은 접근 방법은 트렌드 라인에 도달하거나 고점 또는 저점에 도달할 때마다 인디케이터를 이동시키는 것입니다. 트렌드 라인과 볼륨 피로 라인 간의 거리가 클수록 해당 방향의 볼륨이 더 큽니다. 트렌드 라인은 주문을 열기 위한 장소로 사용할 수 있으며, 피로 라인은 수익을 얻는 데 사용됩니다. 이 시스템은 정말 독특하지만 매우 직관적입니다. 시장에는 비슷한 제품이 없습니다. 사용에 제한이 없습니다. 모든 시장과 모든 시간 프레임에서 적용할 수 있습니다. 중요:
Advanced Supply Demand
Bernhard Schweigert
4.91 (296)
현재 33% 할인! 초보자나 전문 트레이더를 위한 최고의 솔루션! 이 보조지표는 우리가 다수의 독창적 기능과 새로운 공식을 통합한 독특하고 고품질이며 저렴한 거래 도구입니다. 이 업데이트를 통해 이중 시간대를 표시할 수 있습니다. 더 높은 TF를 표시할 수 있을 뿐만 아니라 차트 TF와 더 높은 TF 모두를 표시할 수 있습니다: 중첩 영역 표시. 모든 Supply Demand 트레이더들이 좋아할 것입니다. :) 중요한 정보 공개 Advanced Supply Demand의 잠재력을 극대화하려면 다음을 방문하십시오. https://www.mql5.com/ko/blogs/post/720245   진입 또는 목표의 명확한 트리거 포인트를 정확히 찾아냄으로 해서 거래가 어떻게 개선될지 상상해 보십시오. 새로운 알고리즘을 기반으로 매수자와 매도자 간의 잠재적인 불균형을 훨씬 더 쉽게 분간할 수 있습니다. 왜냐하면 가장 강한 공급영역과 가장 강한 수요 영역과 과거에 어떻게 진행 되었는지를(이전
현재 26% 할인!! 이 지표는 두 주요 지표( Advanced Currency Strength 28   &  Advanced Currency IMPULSE with ALERT )의 슈퍼 조합입니다. TICK-UNITS에 대한 통화 강도 값과 28개 Forex 쌍에 대한 경고 신호를 보여줍니다. 11개의 다른 틱 단위를 사용할 수 있습니다. 1, 2, 3, 4, 5, 6, 10, 12, 15, 20, 30초입니다. 두 번째 타이머 내에 최소 1틱이 있으면 하위 창의 Tick-Unit 막대가 표시되고 왼쪽으로 이동합니다. 단 하나의 차트로 28 Forex 페어를 스캘핑할 수 있습니다! 스캘핑 기회의 정확한 트리거 포인트를 정확히 찾아낼 수 있기 때문에 스캘핑이 어떻게 개선될지 상상해 보십시오. 그것은 1분보다 낮은 기간에 작동하는 시장의 첫 번째 통화 강도 지표입니다! 그것은 시장에 빠르게 들어오고 나가고 시장에서 작은 핍을 잘라내기를 원하는 빠른 스캘퍼를 위한 것입니다. 사
Currency Strength Exotics
Bernhard Schweigert
4.88 (33)
현재 20% 할인! 초보자 또는 전문가 트레이더를 위한 최고의 솔루션! 이 표시기는 Exotic Pairs Commodities, Indexes 또는 Futures와 같은 기호에 대한 통화 강도를 표시하는 데 특화되어 있습니다. 금, 은, 석유, DAX, US30, MXN, TRY, CNH 등의 진정한 통화 강도를 보여주기 위해 9번째 줄에 모든 기호를 추가할 수 있습니다. 이것은 독특하고 고품질이며 저렴한 거래 도구입니다. 우리는 많은 독점 기능과 새로운 공식을 통합했습니다. 새로운 추세 또는 스캘핑 기회의 정확한 트리거 포인트를 정확히 찾아낼 수 있기 때문에 거래가 어떻게 개선될지 상상해 보십시오. 사용 설명서: 여기를 클릭 https://www.mql5.com/en/blogs/post/708876 모든 시간대에 작동합니다. TREND를 빠르게 확인할 수 있습니다! 새로운 기본 알고리즘을 기반으로 설계되어 잠재적인 거래를 더욱 쉽게 식별하고 확인할 수 있습니다. 8개의
Day Trader Master
Oleg Rodin
5 (15)
Day Trader Master 는 데이 트레이더를 위한 완벽한 거래 시스템입니다. 시스템은 두 개의 지표로 구성됩니다. 하나의 지표는 매수 및 매도를 위한 화살표 신호입니다. 얻을 수 있는 화살표 표시기입니다. 2차 지표를 무료로 드립니다. 두 번째 지표는 이러한 화살표와 함께 사용하도록 특별히 설계된 추세 지표입니다. 표시기는 반복하지 않고 늦지 않습니다! 이 시스템을 사용하는 것은 매우 간단합니다. 2색 선으로 표시되는 현재 추세 방향의 화살표 신호를 따라가기만 하면 됩니다. 파란색은 구매 추세입니다. 빨간색은 판매 추세입니다. 파란색 화살표는 매수 신호입니다. 빨간색 화살표는 매도 신호입니다. 추세선의 색상과 일치하려면 화살표의 색상과 신호의 방향이 필요합니다. 화살표 표시기는 주로 시간 간격 M5 및 M15에서 일중 거래를 위해 만들어졌습니다. 그러나 기술적으로 시스템은 다른 시간 간격으로 사용할 수 있습니다. 표시기에는 PUSH 메시지 기능이 있는 팝업 경고가 장착되어 있
PZ Mean Reversion MT4
PZ TRADING SLU
3 (4)
평균 회귀 거래에 대한 전문적이고 정량적인 접근 방식을 구현하는 고유한 지표입니다. 이는 가격이 예측 가능하고 측정 가능한 방식으로 평균으로 전환되고 반환된다는 사실을 이용하여 비정량적 거래 전략을 훨씬 능가하는 명확한 진입 및 퇴장 규칙을 허용합니다. [ Installation Guide | Update Guide | Troubleshooting | FAQ | All Products ] 명확한 거래 신호 놀랍도록 쉬운 거래 사용자 정의 가능한 색상 및 크기 성능 통계 구현 대부분의 거래 전략을 능가합니다. 적절한 SL 및 TP 레벨을 표시합니다. 이메일/음향/시각 알림을 구현합니다. 작동 원리 이 지표는 더 높은 기간에서 완전히 사용자 정의 가능한 이동 평균 주변의 표준 편차를 측정하고 추세 추종 접근 방식을 사용하여 정확하게 거래를 찾습니다. 거래는 현재 차트의 가격 동작을 살펴보고 선택한 더 높은 기간에서 계산된 평균 가격대로 가격이 돌아오면 닫힙니다. 코딩 방식 때문에 지
PZ Divergence Trading
PZ TRADING SLU
5 (2)
Unlock hidden profits: accurate divergence trading for all markets Tricky to find and scarce in frequency, divergences are one of the most reliable trading scenarios. This indicator finds and scans for regular and hidden divergences automatically using your favourite oscillator. [ Installation Guide | Update Guide | Troubleshooting | FAQ | All Products ] Easy to trade Finds regular and hidden divergences Supports many well known oscillators Implements trading signals based on breakouts Display
SMC Easy Signal
Mohamed Hassan
4.73 (15)
3 copies left at $65, next price is $120 SMC Easy Signal was built to remove the confusion around the smart money concept by turning structural shifts like BOS (Break of Structure) and CHoCH (Change of Character) into simple buy and sell trading signals. It simplifies market structure trading by automatically identifying breakouts and reversals as they happen, allowing traders to focus on execution rather than analysis. Whether the market is continuing its trend or preparing to reverse, the i
Trend Screener
STE S.S.COMPANY
4.79 (95)
트렌드 표시기, 트렌드 트레이딩 및 필터링을 위한 획기적인 고유 솔루션, 하나의 도구 안에 내장된 모든 중요한 트렌드 기능! Forex, 상품, 암호 화폐, 지수 및 주식과 같은 모든 기호/도구에 사용할 수 있는 100% 다시 칠하지 않는 다중 시간 프레임 및 다중 통화 표시기입니다. 기간 한정 특가: 지원 및 저항 스크리너 지표는 단 100달러에 평생 제공됩니다. (원래 가격 50 달러) (제안 연장) Trend Screener는 차트에 점이 있는 화살표 추세 신호를 제공하는 효율적인 지표 추세 추종 지표입니다. 추세 분석기 표시기에서 사용할 수 있는 기능: 1. 트렌드 스캐너. 2. 최대 이익 분석이 있는 추세선. 3. 추세 통화 강도 측정기. 4. 경고가 있는 추세 반전 점. 5. 경고가 있는 강력한 추세 점. 6. 추세 화살표 Trend Screener Indicator가 있는 일일 분석 예, 일일 신호 성능...등은 여기에서 찾을 수 있습니다.   여기를 클릭하십시오. L
Atomic Analyst
Issam Kassas
5 (3)
우선적으로 언급할 점은이 거래 지표가 다시 그리지 않고 지연되지 않으며 이를 통해 수동 및 로봇 거래 모두에 이상적이라는 점입니다. 사용자 매뉴얼: 설정, 입력 및 전략. Atomic Analyst는 가격의 강도와 모멘텀을 활용하여 시장에서 더 나은 이점을 찾는 PA Price Action Indicator입니다. 고급 필터를 장착하여 잡음과 거짓 신호를 제거하고 거래 잠재력을 높이는 데 도움이 됩니다. 복잡한 지표의 다중 레이어를 사용하여 Atomic Analyst는 차트를 스캔하고 복잡한 수학적 계산을 간단한 신호와 색상으로 변환하여 초보 트레이더가 이해하고 일관된 거래 결정을 내릴 수 있도록합니다. "Atomic Analyst"는 새로운 및 경험이 풍부한 트레이더를위한 종합적인 거래 솔루션입니다. 프리미엄 지표와 최고 수준의 기능을 하나의 거래 전략에 결합하여 모든 종류의 트레이더에 대한 다재다능한 선택지가되었습니다. 인트라데이 거래 및 스캘핑 전략 : 빠르고 정확한 일일
추측을 멈추세요. 통계적 우위로 트레이딩을 시작하세요. 주식 지수는 외환과 다르게 거래됩니다. 정해진 세션이 있고, 야간에 갭이 발생하며, 예측 가능한 통계적 패턴을 따릅니다. 이 지표는 DAX, S&P 500, 다우존스와 같은 지수를 자신 있게 거래하는 데 필요한 확률 데이터를 제공합니다. 무엇이 다른가 대부분의 지표는 무엇이 일어났는지 보여줍니다. 이 지표는 다음에 무엇이 일어날 가능성이 있는지 보여줍니다. 매 거래일마다 지표는 100일간의 과거 데이터를 기준으로 현재 설정을 분석합니다. 유사한 갭, 유사한 시가 위치를 가진 날을 찾고, 가격이 주요 레벨에 도달한 빈도를 정확히 계산합니다. 갭이 메워질지, 어제 고점이 테스트될지 더 이상 추측할 필요가 없습니다. 실제 데이터에 기반한 정확한 백분율을 얻게 됩니다. 모든 입력 설명이 포함된 전체 매뉴얼: https://www.mql5.com/en/blogs/post/766370 훌륭한 설정을 찾는 데 도움이 되는 전략 가이드: ht
제작자의 제품 더 보기
TrendFinder SMA
Jose Ramon Miranda Ramos
4.78 (9)
Trendfinder SMA are Colored candlesticks showing the trend based on two Simple Moving Averages and the slope of the slow moving average. This indicator will give you the color change on the next bar on the confirmation candle and will never repaint   Trendfinder SMA is optimize to trade on any market and to be used trending and None trending markets. PLEASE TAKE NOTICE: For best results use this indicator as an extra tools after you have completed your regular analysis and use it for alerts base
FREE
MTF Fair Value Gaps Alerts
Jose Ramon Miranda Ramos
MTF Fair Value Gaps Alerts indicator is based on Fair Value Gaps (FVG), Volume imbalance (VI) and Gaps. This indicator will create 2 arrows pointing to the left showing the area of the FVG, VI and Gaps and will never repaint after the candle has been closed . Inputs: TF (Timeframe of the Alert For Current timeframe use CURRENT) barshilft : the barshift needs to be the same timeframe as the above TF. barshift format (CURRENT, M1, M5, M15, M30, H1, H4, D1, W1, MN) Send Email: Audible Alert Push N
FREE
CCI Trend finder
Jose Ramon Miranda Ramos
CCI Trend Finder indicator with different colors at levels 0, 100 and -100. The cross is a signal for "123 Exit" as presented by MPlay and used in Woodies CCI system. This exit signal is effective especially in short-term breakout trades, because it prevents early exiting at small corrections.  This indicator is great for having it as an extra tool for your analysis.
FREE
Strength Scalper Pro
Jose Ramon Miranda Ramos
3 (1)
PLEASE TAKE NOTICE: This indicator is in current development. final version will be free. This is a simple indicator that uses 3 timeframes in its formula to create Possible buy and sell signals. This indicator is optimized for the M1 timeframe Only. It has 2 types of Alerts: Push Notifications Audio Alerts UPDATES: 3/19/24: Still testing the final code Troubleshooting: When loading the indicator, if you don't see the arrows on the current chart that means that MT4 has not loaded all the high
FREE
TrendFinder Volume
Jose Ramon Miranda Ramos
TrendFinder VolumeI are Colored candlesticks showing the trend based on Volume and Slope of Trend This indicator will give you the color change on the next bar on the confirmation candle and will never repaint Lime Green = Possible Buy (Volume up),  Teal Green = Bullish Weak (Volume Decreasing), Red = Possible Sell (Volume up) , Orange = Bearish Weak (Volume Decreasing) TrendFinder Volume is optimize to trade on any market and to be used trending and None trending markets. For best results use
FREE
TrendFinder RSI
Jose Ramon Miranda Ramos
TrendFinder RSI are Colored candlesticks showing the trend based on The Relative Strength Index (RSI) This indicator will give you the color change on the next bar on the confirmation candle and will never repaint   TrendFinder RSI is optimize to trade on any market and to be used trending and None trending markets. For best results use this indicator as an extra tools after you have completed your regular analysis and use it for alerts based on such analysis.
FREE
Trendfinder SMA With Zone and Alert are Colored candlesticks showing the trend based on two SMA as Signal and two SMA as a Buy and Sell Zone and the slope of the slow moving average. This indicator will give you the color change on the next bar on the confirmation candle and will provide alert on Buy and sell signal, when it enters the buy and sell zone and when the market test the buy or sell zones as support or resistance and will never repaint . This indicator has the following: 2 SMA for th
FREE
Trendfinder MA Pro
Jose Ramon Miranda Ramos
Trendfinder MA Pro are based on Colored candlesticks showing the trend based on two Moving Averages as Signal and two Moving Averages as a Buy and Sell Zone, the slope of the slow Signal moving average and ATR and Volume increasing. This indicator will give you the color change on the next bar on the confirmation candle and will provide alert on Buy and sell signal, when it enters the buy and sell zone and when the market test the buy or sell zones as support or resistance and will never repain
FREE
Retracement Reversal and Support and Resistance Pro is based on a formula used by Proprietary trading firms and other big institutions on WallStreet including on my Company and used by my traders here in the capital of the world. This indicator will create Red and Green arrows on a possible mayor Retracement level,  Reversal Level and future Support and Resistance levels and  Yellow arrows on a possible m i nor Retracement level,  Reversal Level and future Support and Resistance levels . This in
FREE
필터:
davevicens
336
davevicens 2023.10.30 19:15 
 

Great indicator. I use it all the time

리뷰 답변