Confluence Edge Indicator
- 지표
- 버전: 1.0
- 활성화: 5

Confluence Edge Indicator
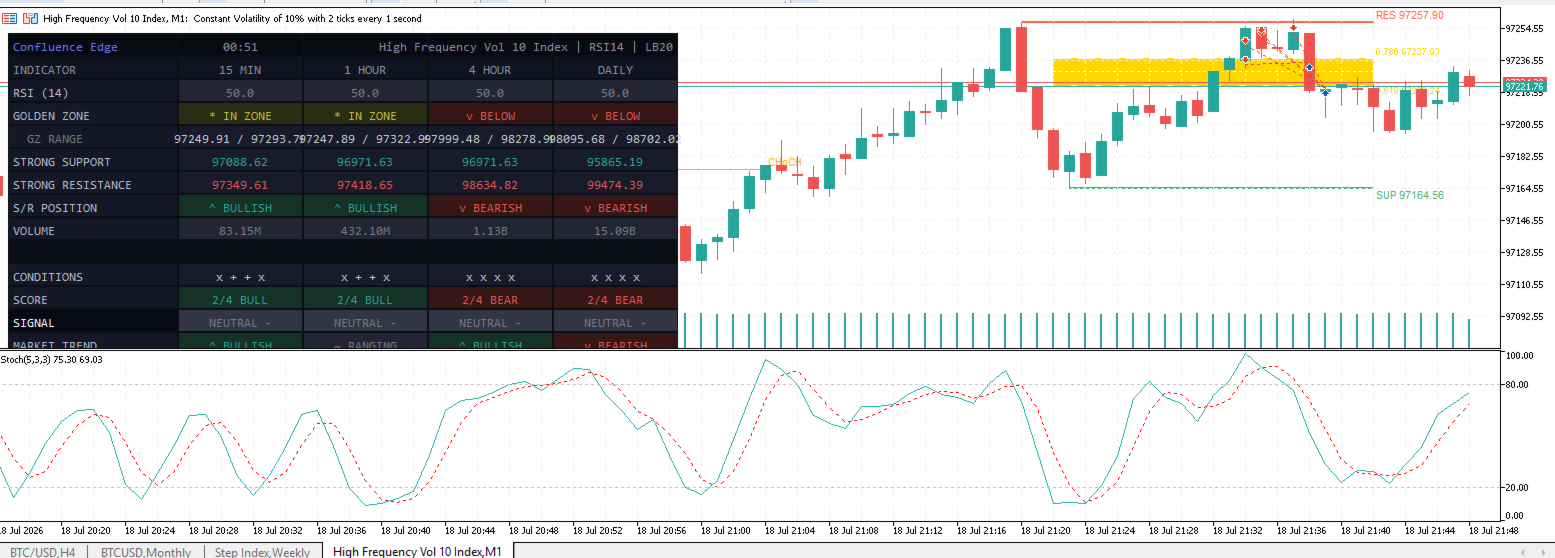
Confluence Edge Indicator is a powerful all-in-one technical analysis tool designed to provide a complete multi-timeframe view of market conditions. It removes the need for multiple chart indicators by combining proven trading methodologies into a single, clean, intuitive dashboard.
Built for traders who rely on confluence, this indicator delivers real-time analysis using price action, volume, momentum, market structure, and algorithmic scoring concepts. It is designed to provide non-repainting signals and help traders identify high-probability market opportunities with greater confidence.
🌟 Key Features
- Multi-Timeframe Dashboard
Monitor market conditions across up to 7 customizable timeframes simultaneously. Quickly identify higher timeframe alignment without switching between multiple charts. - Smart Money Concepts (SMC)
Automatically identifies and displays important market structures, including:- BOS (Break of Structure)
- CHoCH (Change of Character)
- CISD (Change in State of Delivery - Bullish & Bearish)
- Advanced Market Trend Algorithm
Determines whether the market is BULLISH, BEARISH, or RANGING using a two-factor analysis model:- EMA Alignment: Evaluates the relationship between the 50, 100, and 200 Exponential Moving Averages.
- Price Action Structure: Analyzes swing formations to identify Higher Highs/Higher Lows (HH/HL) or Lower Highs/Lower Lows (LH/LL).
- Golden Zone Fibonacci Analysis
Automatically calculates and displays the key 0.618 - 0.786 Fibonacci retracement zone from the current market structure, highlighting potential reaction areas. - Momentum & Volume Confirmation
Uses RSI and relative volume analysis (current volume compared to average volume) to validate price movements and improve signal quality. - Dynamic Support & Resistance
Automatically plots important high and low price levels based on the selected lookback period, helping traders identify targets and invalidation zones. - Confluence Scoring System
Combines multiple market factors across timeframes to generate a simplified dashboard signal:- +1 = Bullish / Buy Bias
- -1 = Bearish / Sell Bias
- 0 = Neutral
🛠️ How To Use
- Analyze the Dashboard
Look for timeframe alignment. Higher probability setups often occur when multiple timeframes confirm the same market direction. - Confirm Market Direction
Align trades with the displayed market trend. Avoid trading against the trend unless targeting a confirmed reversal from a major level. - Wait for Price Retracement
Look for price to return to important areas such as the Golden Zone or dynamic Support & Resistance levels. - Confirm Market Structure
Wait for a lower timeframe CHoCH or CISD confirmation inside your area of interest before entering a trade.
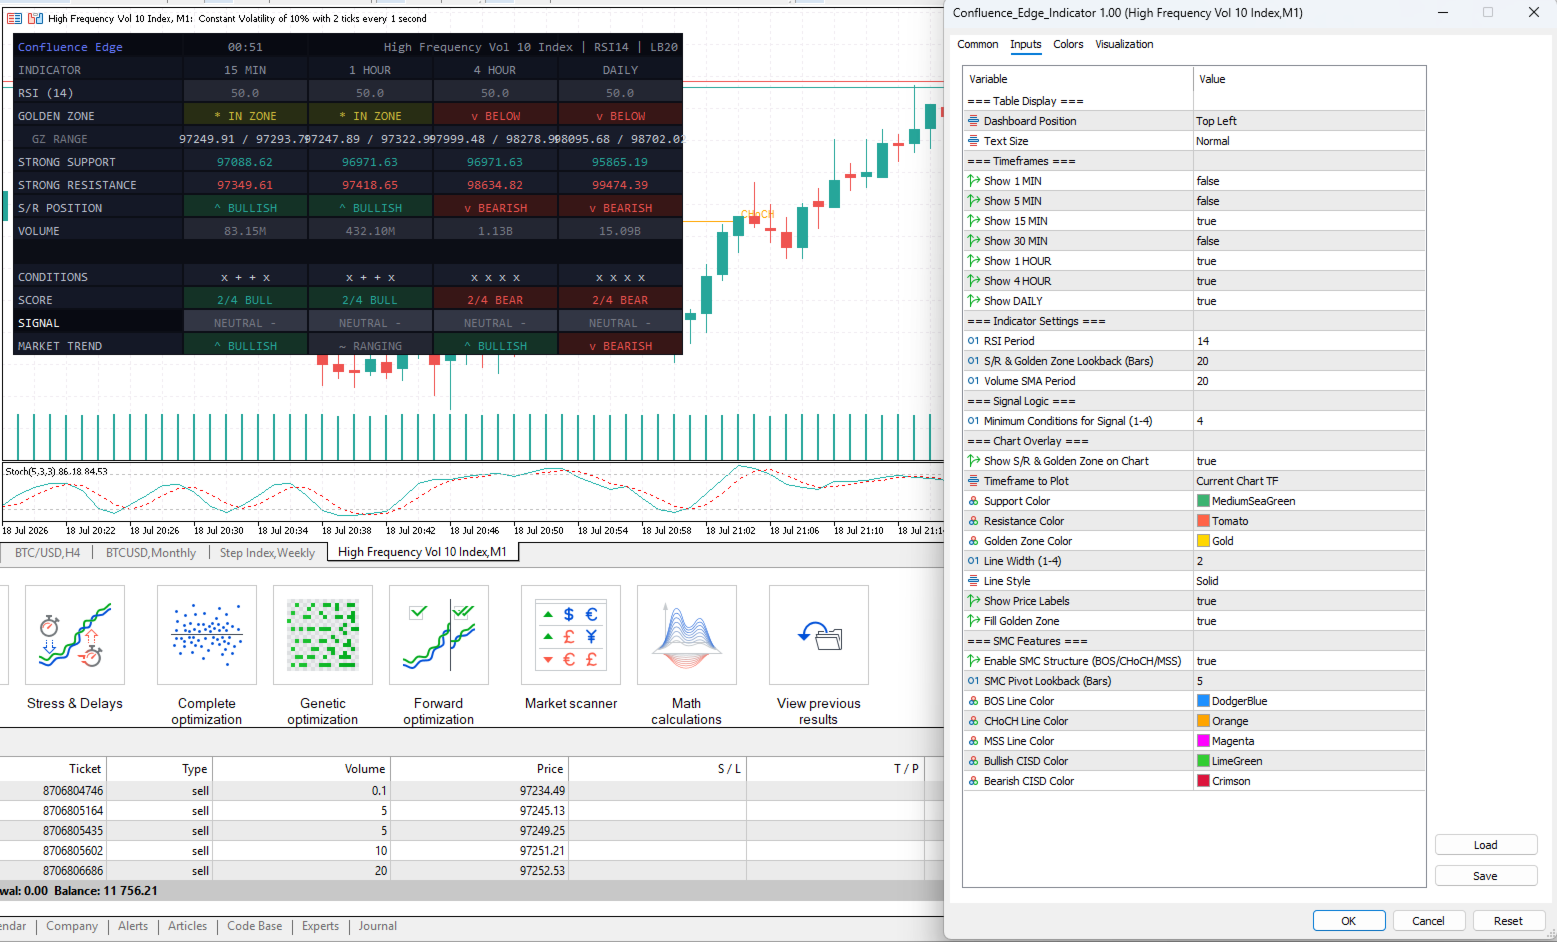
⚙️ Main Input Parameters
- Timeframe Setup: Configure up to 7 individual timeframes such as M1, M5, M15, M30, H1, H4, and D1.
- Indicator Lookback: Defines the number of historical candles used for Support/Resistance and Golden Zone calculations.
- RSI Period: Controls the Relative Strength Index calculation period.
- Volume Moving Average Period: Determines the period used for average volume calculations.
- Minimum Conditions For Signal: Sets the number of required confluence factors needed before generating Buy or Sell signals.
- SMC Pivot Length: Defines the number of bars used for identifying swing highs and swing lows.
- Enable SMC: Allows Smart Money Concept chart overlays to be enabled or disabled.
- Dashboard Customization: Adjust colors, fonts, position, and X/Y offsets to match your preferred chart layout.
⚠️ Important Notes
- Confluence Edge Indicator is designed as a market analysis and decision-support tool. It is not an automated trading robot and does not execute trades automatically.
- Always combine indicator signals with proper risk management and a well-defined trading plan.
- For the best viewing experience, a dark chart theme is recommended.